btc transaction analysis
The trading strategy analyzed by everyone earlier, I believe that all friends who keep up will have great profits.
btc trading is expected to fluctuate and fall this week, focusing on 27400-26650-26150, I will choose to look for trading opportunities at these three points, keep up with me, and I will share more accurate trading signals with you.
Next, I will continue to provide more trading signals with an accuracy rate of more than 90%. If your trading results are not satisfactory to you, then you should join me as soon as possible!I will make your account profitable every week to reach more than 8K-15Kusd
Btctusd

BTC very interesting fractal !BTC / USDT
BTC is making a very interesting fractal
The left side chart is 2016 and right side is today
If this repeats then be ready for a surprise 50% pump from here (unexpected for the majority of traders)
This scenario is also considered the 1st structure I shared with you in my last analysis …check attachment below
Most of pepole now will vote for major bearish wave which could be a main reason for pump (may be not 50% but hit of their stoploss /taking liquidity before dropping looks reasonable)
is this scenario possible? Agree or not ?
Share with me in comment section below ⬇️

BTC-24 MONTH PRICE EXPECTATIONSHalving History Performance
A zoomed in view of yesterdays chart. The chart below illustrates the two prior halving cycles fractals 1 year pre & post the halving date.
Whilst past performance is no guarantee of future returns, the chart can help us frame the 24 month period ahead of us and give an idea of reasonable price expectations.
Reasonable Price Expectations
May 2023 - April 2024:
$19,150 to $44,284
(Average $31.7k)
May 2024 - April 2025:
$28,790 to $86,000
(Average $57.4k)

BITCOIN needs to hit 26k before more gain ❌🧨Hello 🐋
we can see more correction to the downside, at least close to great daily support level ($26000) ❌🧨
in other word
if
the price doesn't break the resistance zone to the upside and just complete the retest, we will see more correction, at least to our lower trend line ❌🧨
otherwise
we can see more gain to upper resistance level ✔️🚀
for
any other huge pump, we need more correction 📖📖📖📖📖
if
breakout of the lower support zone be completed, we can see more correction to the downside ❌🧨
brief amount of green candlesticks to the upside before any other movement is logical 📖💡
Please, feel free to share your point of view, write it in the comments below, thanks 🐋

$BTC update... These are the scenario's I'm looking for to #trade long range on #Bitcoin... 2 long setups and 1 short setup...
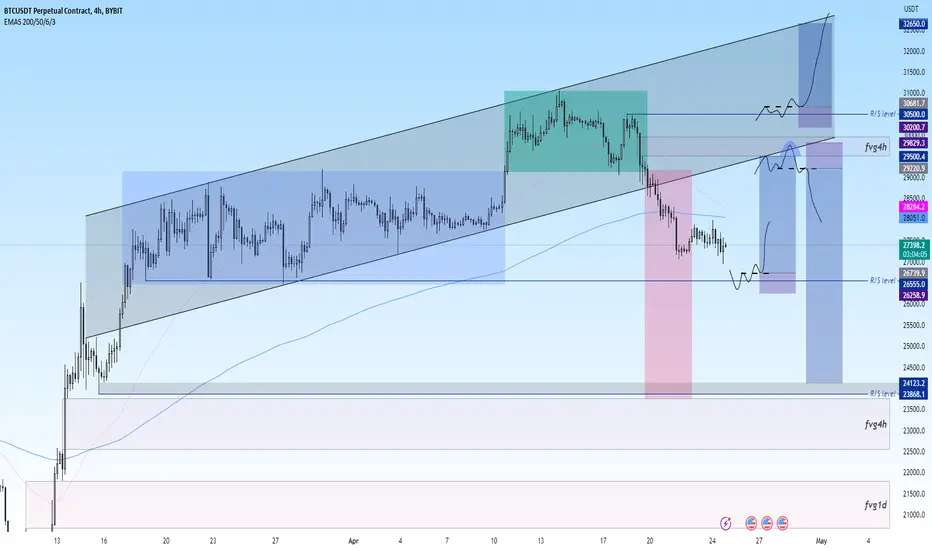
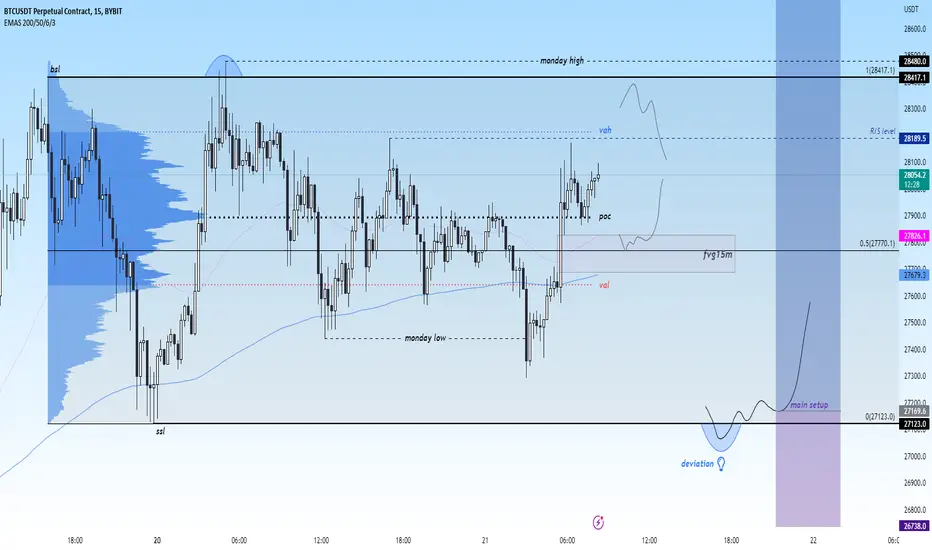
Parallel with that, #BTC dominance chart shows the same R/S target around 49%...
Until then, we keep scalping... 🐨🔪
#trading #Crypto

$BTC/USD 6H Bearish Diamond Future Price ActionIntroduction:
Bitcoin , the world's most popular cryptocurrency, has recently exhibited a bearish diamond formation in its price movement. In this analysis, we will explore the implications of this pattern, the estimated breakdown price, potential long entry points, and the prospects of a correction before a further move to 32k.
Bearish Diamond Formation:
The bearish diamond is a relatively rare chart pattern in technical analysis , formed when the price of an asset expands and contracts within a specific diamond shape. This pattern is considered bearish because it usually signals a trend reversal from an uptrend to a downtrend.
Price Breakdown:
The bearish diamond formation in Bitcoin's price movement indicates that it could potentially break down to an estimated price of 27.2k. This breakdown price is derived from the measurement of the widest part of the diamond, projected downwards from the point of breakout.
Long Entry Points:
Considering the bearish diamond pattern, traders may look for long entry points between 24.2k and 25.8k. This range represents a possible area of price support, as it lies below the estimated breakdown price of 27.2k. Entering at these levels may provide a favorable risk-to-reward ratio, especially if the price rebounds from this range.
Correction and Move to 32k:
Despite the bearish nature of the diamond formation, I believe that Bitcoin is displaying a correction before a further move to 32k. This scenario suggests that the bearish diamond formation could be a temporary setback before a resumption of the uptrend. If this is the case, the price would need to stabilize and reverse from the long entry range of 24.2k-25.8k, followed by a sustained upward movement.
Key Factors to Consider:
For the correction scenario to play out and Bitcoin to reach 32k, several factors should be monitored:
Volume: A significant increase in buying volume could signal a potential trend reversal, supporting the idea of a correction before a move to 32k. Liquidation Volumes and funding rates will impact these volumes as well.
Market Sentiment: Positive news, developments, or a change in market sentiment may contribute to a shift in the price trend.
Technical Indicators: Keep an eye on key technical indicators such as Moving Averages, RSI , and MACD , as they can provide insights into the strength of the trend and possible reversal points.
Conclusion:
The bearish diamond formation in Bitcoin's price movement suggests a possible breakdown to 27.2k, with long entry points between 24.2k and 25.8k. However, some analysts believe this pattern may represent a correction before a move to 32k. To validate this outlook, traders should closely monitor factors such as volume , market sentiment, and technical indicators. As always, it is crucial to manage risk and set appropriate stop-loss levels when trading cryptocurrencies.

Bitcoin update#trade confirmed... Stop loss moved close to entree because dayshift is over (RM)...
Lets see how we wake up tomorrow...
Gn 🌙
#trading $BTC

( Alart ) EMA 30 , 50 are breaking the EMA 200 down !!!#18
after passing 16 days up warding EMA 30 , 50 are breaking EMA 200 down - and that could be short signal for $BTC
in my opinion if this indicators break each and price stabilize under 26 600 the game is under hands of bearish market - Always be in profit !
.
BINANCE:DOGEUSDT
BINANCE:BTCUSDT
FOREXCOM:XAUUSD

#BTC update...#BTC update...
I expected #Bitcoin to take out SSL first, to knock out the previous high... The dominance is currently strong...
I await this situation... For now, will continue scalping until main setup is reached...
Bitcoin Key Levels for 2023Now we're retracing back into the large macro move down, it's worthy to know your levels - as Bitcoin rallies off it's bear market bottom can be quite savage.
Linear Scale Fibs
Log Scale Fibs
Annual Pivots

BTC potential plan in coming days BTC / USDT
BTC outperforms altcoins just like 2019, also price is forming mega-phone pattern ..This is bullish pattern but price didn’t make any close above 25k by daily or weekly
Here’s what i think is coming in next :
1- Consolidation around 25k and direct breakout to 28k-32k
2- BTC fail to hold above 25k… then we can still visit lower support before going up again
My Targets is the same 28k-32k ( monthly resistance )
if you have any questions or thoughts share with us in comment section below ⬇️

BTC Possible Scenario Hello dear traders. Hope you are having a fantastic day. I see BTC is forming an ABC correction wave before HUGE move up.
What do you think?
Please comment down below.

Btc Best For BuyBased on the price action, the best opportunity to buy has been provided, and if we expect to cross the price ceiling as in the past, my target is 100,000. The market is currently waiting for a spark to move upwards, which may take several months. The future will emerge. If you notice in the monthly chart, the number of bearish candles is much more than the bearish ones, which means that the market has been able to fall with great effort.

BTC Update ✔Hello Traders. Hope you are doing well. Last time BTC formed a QM pattern which is a reversal pattern that I published in my analyses. Now it has formed a triangle as well as you can see on the chart. On the daily you can see a huge divergence on RSI too which suggests that BTC is going into the correction. The trigger that shows us that BTC is certainly going to go down is if price breaks the triangle to the downwards.
What do you think guys?
Comment your thoughts on what is going to happen. ❤

Bitcoin Try to regain 23.7 On WeekendBitcoin legdown around 5% and bounced back from the yellow support line which it touched before ( on the first dump)
Please support and motivate me by Boost,Follow,Comment
Usually a Friday dump into weekend does not tell me a real move , meaning this could be retraced and even go higher but if it loses 22K more downside is way more possible than up side.
The liquidation around 24K is now 5M and high leverage is around 2M around 22.8
Detailed explanation on video
Also if you want to talk about trades leave a comment
Thanks for watching

Bitcoin signal with high leverage. btcusdt Long position 20XA very low risk long position on BTCUSDT. By implying 20X lev, the SL will be about 8%. so use proper margin and manage your risk.

BTC QM SetupHello Traders. Hope you are having a great weekend. As you can see BTC has formed a QM pattern on an important resistance which is 25K. A correction is
expected for BTC at least to 22-23K. The pattern gets invalidated if 2H candle closes above the last high about 25.3K.
What is your idea?
Comment down Pls.

Bitcoin Daily UPDATEDespite the DXY strength being shown, BTC PA is holding up very well which is SO VERY Bullish....
Even more so when you lok at this chart. PA has come back down to the neckline of the "FTX Recovery" move, to test it as support.
More than that, it has the 50 & 200 MA's to back it up
Also the Daily MACD is nearing the neutral zone to possibly begin turning.
For me, the ideal situation this week is likely to Range though a further drop is also very possible.
Watch DXY - Thats the trigger
p.s. Nice to see others beginning to use my ideas here....

BTC Wave Analysis + Trade SetupI think that wave A of (A B C) is complete and we are currently in wave B.
Warning: Wave B itself consists of 3 waves, the third wave being the longest wave.
After reaching the specified target, I strongly warn the owners of altcoins that the risk of most altcoins becoming zero is very high. (No matter how valuable gold is, if it is bought at a bad time and at a bad price, it is no different from a piece of garbage.)
Be successful and profitable

CHANGED MY PLAN - IM NOW LONG I changed the plan of my last trade (look at my last post) because of the 3 suspiscious wicks on the daily chart, because of the trend in the recent day (15m chart) many traders are trapped there and cant get out of there position i think the target of capitulation isnt reached yet, i am seeing that capitulation is about those highs. thanks.

This is BTC - A Game of PatternsThis is a pattern showing a scenario featuring exponential growth.
If BTC remains what it was in the past, this is just possible. 25k next month doesn't mean it can't 10x within the next 6 months.
This is not financial advise, neither a prediction. This is a game of patterns.
What will happen?
If BTC's fundamentals change, if it gets flipped by other assets, that can invalidate many older frameworks we use, which means you can start preparing for a more even world of crypto.
However if institutions and smart money will embrace BTC, then the price levels stated above are not unrealistic at all.
Choose your strategy.

Elliot Waves Complete Guide | Chapter 3.3 - "Running, Contract"Hello Traders. Welcome to Chapter 3.3, where we talk further about a different form of corrective waves, the Flat and Expanded correction. In chapter 3.3 I discuss the last of the types of flat corrections! Here, we will also dissect the contracting triangle, also known as the symmetrical triangle by many traders.
Chapter 3 Glossary:
3.1 Zig-Zag Waves
3.2 Flat Correction , Expanded Flat
3.3 Running Flat, Contracting Triangle
3.4 Barrier Triangle, Expanded Triangle
3.5 Double-Three
3.6 Triple-Three
-----
Running Flat
The is the last type flat correction: the running flat variation. It is the least common one, but has the same 3-3-5 structure. This one is hard to spot because a rising wedge is usually considered bearish for many and the last wave is where you will find the confirmation. For these, you want to trade the breakout.
Rules:
• Wave B ends above the beginning of wave A
• Wave C ends higher than the end of wave A
• Usually wave C is the same length as wave A.
→ This kind of correction happen in really strong and fast markets, especially Bitcoin. The fast and high push of wave B and the short wave C are signs of a strong primary trend.
A parallel channel regularly marks the low of
wave C, marked by the yellow lines!
Contracting Triangle
Triangles represent a balance and even pressure of buyers and sellers within the market. They contain five overlapping waves with a 3-3-3-3-3 structure. The contracting triangle represents the most frequently appearing.
Rules:
• Triangles have 5 Waves: A-B-C-D-E
• All of the waves are corrective
• Upper line is declining, lower line is rising
• Wave E frequently overshoots the trendline and can also be a triangle
• Triangles only occur as a Wave 4/B/X/Y
• Never as a Wave 2/A
❗Triangles represent a continuation pattern for the dominant trend. Remember, continuation patterns are the main trend!
