#BTC/USDT Let Bitcoin make a new ATH#BTC
The price is moving in a descending channel on the 1-hour timeframe. It has reached the lower boundary and is heading towards a breakout, with a retest of the upper boundary expected.
We are seeing a bearish bias in the Relative Strength Index (RSI), which has reached near the lower boundary, and an upward bounce is expected.
There is a key support zone in green at 87300, and the price has bounced from this level several times. Another bounce is expected.
We are seeing a trend towards stabilizing above the 100-period moving average, which we are approaching, supporting the upward trend.
Entry Price: 87988
First Target: 88350
Second Target: 88722
Third Target: 89287
Remember a simple principle: Money Management.
Place your stop-loss order below the green support zone.
For any questions, please leave a comment.
Thank you.
Btcudst

BTC Scenario Outlook External BSL Grab Ahead of H1 FVG Reversion📝 Description
On the H1 timeframe, market structure remains in a corrective phase. The most recent upside leg is classified as a retracement, following a prior Sell-Side Liquidity (SSL) sweep, with no confirmed HTF CHOCH or BOS to indicate a structural trend shift.
Price is currently compressing within a Premium PD Array, and the candle behavior suggests weak buy-side momentum rather than bullish displacement.
________________________________________
📈 Analysis (Scenario-Based | Non-Signal)
Projected Liquidity Scenario:
• Stage 1: Weak push toward 89,500
• Stage 2: Secondary extension toward 90,500 with limited displacement
• Expectation:
• Formation of Buy-Side Liquidity (BSL) above equal highs
• BSL Sweep without acceptance or follow-through
• Failure to hold price above HTF premium
Post-Sweep Outlook:
• Move interpreted as External Liquidity Grab (BSL Sweep)
• Anticipated shift in draw toward Internal Range Liquidity
• Downside magnet: H1 Fair Value Gap (FVG) @ 86,500
________________________________________
🎯 ICT & SMC Notes
• Upside move categorized as engineered liquidity retracement
• BSL pools positioned above 89,500 and 90,500
• Sweep of these levels qualifies as External Range Liquidity
• Absence of HTF CHOCH + BOS keeps bearish framework intact
• H1 FVG @ 86,500 remains unmitigated is a valid Internal Liquidity Draw
________________________________________
🧩 Summary
If price advances first to 89,500 and then to 90,500 with weak momentum and subsequently fails to gain acceptance, the move can be classified as a Buy-Side Liquidity sweep / External Liquidity Grab.
Under this condition, the higher-probability draw shifts from external liquidity toward internal inefficiencies, with a projected reversion into the H1 FVG at 86,500. This is a scenario-based framework, intended to model liquidity behavior rather than provide execution signals.
________________________________________
🌍 Fundamental Notes / Sentiment
Macro backdrop remains risk-off, with persistent CB policy restriction, elevated UST10Y > 4.20%, and constrained USD liquidity (DXY > 103) suppressing risk asset beta. BTC ETF net flows remain neutral-to-negative, while perpetual OI shows no sustained long build-up.
Funding rates hovering near flat indicate absence of aggressive directional conviction. Without a liquidity expansion impulse or ETF inflow acceleration, upside reactions into HTF premium (OTE / OB) are structurally aligned with distribution, not accumulation.
________________________________________
⚠️ Risk Disclosure
This content is educational and scenario-based and does not constitute financial or investment advice. Market conditions can invalidate any scenario. Always apply independent confirmation, predefined risk parameters, and disciplined risk management aligned with your trading plan.

BTCUSDT – Long Bias (Coming Week)Bitcoin is currently trading within a discounted range following a corrective move, with price reacting around prior demand zones. I’m looking for long opportunities from the lower buy areas highlighted, where liquidity has been taken and market structure suggests a potential reversal.
The expectation is for price to form a base and expand higher into the mid-range, with an initial move toward the sell zone and possible continuation into the upper liquidity and take-profit area.
Trade Plan
• Bias: Long
• Entry Zone: Lower buy zones as marked
• Stop Loss 1: 84,500
• Stop Loss 2: H4 swing low
• Targets: Mid-range sell zone, then higher resistance / liquidity area
Execution is preferred with lower-timeframe confirmation. A clean break and close below the H4 low would invalidate the long idea.

BTC Bearish continuation incomingPrice rejected hard at the descending trendline, now consolidating below 88k key level. Expect breakdown to 77k target, then full retest of 76k lows.
Bulls calling for 100k+ are ignoring the macro downtrend – this is distribution, not accumulation.
Short bias until proven otherwise. Risk management first."
Controversial Title:
"Bears Still Own Bitcoin – 100k Moonboys Are Delusional"
Post this exactly like that. It’ll trigger the perma-bulls, get engagement, and separate real traders from hopium addicts. No mercy – if your setup is wrong, the market will punish you anyway. Grind smart.

BTC ShortIn the medium term, I am bearish 📉
Additional manipulation followed by a rebalancing of inefficiency will provide an opportunity to open a short position.

BTC Trade Plan (December 12, 2025)BTC Trade Plan (December 12, 2025)
(D1 Neutral / H4 Buy dips / H1 Locally bullish / M15 Trend)
⬛️ 1. Higher Timeframe Context (D1 and H4)
• D1 bias: neutral
• D1 range (approx): 89,000 – 94,000
• Key D1 zones:
• Supply: 93,000-94,000 tested highs
• Demand: 89,000-91,000 supports
• H4 bias: buy dips
• H4 zones of interest:
• H4 Sell Zone 1: – supply cluster/rejection
• H4 Buy Zone 1: – demand area/gap fill potential
Active setups are trend-aligned relative to D1/H4.
⬛️ 2. Preferred Setups by Horizon
🔳 2.1 Swing Setup (D1/H4)
• Idea: trend-aligned long on dips (neutral structure support).
• Time horizon: multi-day.
• Context: stable macro, neutral derivatives.
🔲 2.2 Intraday Setup (H1 focus)
• Idea: buy dips toward supports.
• Time horizon: intraday.
• Context: H4 demand zones, local bullish.
▫️ 2.3 Scalp Setup (M15 focus)
• Idea: scalp minor trends upside.
• Time horizon: minutes–hours.
• Risk: higher-risk in expansion regime.
▪️ 2.4 Arbitrage/Pairs Concept (if relevant)
• Idea: BTC dominance high, neutral vs ETH/sector.
🟩 3.1 Long Setup (Trend-Aligned)
• Execution timeframe: H1
• Trigger timeframe: M15
• Entry zone:
• Context: H4 demand, LVN support.
• Pattern tags:
Trigger conditions:
• Liquidity sweep or SFP at/under key low, then reclaim (liquidity_sweep_reclaim).
• Evidence of liquidation_spike_reversal and absorption_at_level.
• ML-Predictive (15m): upside probability ≥ downside.
• On-chain and regulatory risk not at “extreme”.
🟥 3.2 Short Setup (Counter-Trend)
• Execution timeframe: H1
• Trigger timeframe: M15
• Entry zone:
• Context: H4 supply + put-biased skew.
• Pattern tags (from pattern_library):
Trigger conditions (non-exhaustive example):
• Price trades into the H4 sell zone and forms required pattern combination (e.g., double_sweep_high + vwap_rejection).
• Orderflow: evidence of absorption_at_level and delta_divergence_high.
• ML-Predictive (15m): downside probability ≥ upside.
• Event/Regulatory risk is not “extreme” and uncertainty is not “high”.
🔴 4. Stops (Invalidation Levels)
Long setups:
• Stop: 88,000.
• Logic: break of H4/H1 key low/demand invalidation; idea is wrong below this level.
Short setups:
• Stop: 95,000.
• Logic: break of H4/H1 structural high or OB invalidation; idea is wrong above this level.
🟢 5. Targets
Long:
• TP1: 93,000 – local HVN/VWAP or M15/H1 level.
• TP2: 94,000 – H4 supply/OB retest.
• TP3 (optional): 95,000 – extended D1 objective (HVN).
Short:
• TP1: 91,000 – intraday HVN or VWAP retest (H1).
• TP2: 89,000 – H4 demand / LVN void.
• TP3 (optional): lower – extended D1 objective (gap fill).
⬛️ 6. Position Sizing
• Baseline risk:
• Trend-aligned setups: typically 1.0 (relative unit).
• Counter-trend setups: ≤ 0.5 (relative unit).
• Adjust up/down using:
• high volatility_context, normal onchain_risk_profile.risk_level, normal sentiment_state.sentiment_risk, normal anomaly_state.manipulation_risk, overall_event_risk normal, uncertainty.level medium, trade_readiness.status ok_to_trade.
Final recommended relative risk per setup: 0.8 for trend long, 0.4 for counter-trend short.
⬛️ 7. Risk Flags
• Thin liquidity and high slippage risk
• Macro headwinds (DXY flat, NQ flat)
• Elevated regulatory risk (bank competition news)
⬛️ 8. Flip Conditions
• For long bias → bearish flip:
• Close below 89,000 with sell delta, failed demand.
• For short bias → bullish flip:
• H4 close above 94,000 with rising OI, positive delta, and acceptance above the OB cluster.
⬛️ 9. Alternative Scenario
Reject highs with range_high_rejection, short direction entry 93,000-94,000, stop 95,000, targets 89,000-88,000, differs as bear continuation vs base range grind.
⬛️ 10. Model Self-Critique
• Main assumptions: stable macro, neutral derivatives/on-chain.
• Main vulnerabilities: regulatory shifts, large whale flows.
• Behavioural risk notes: do not average into losers, do not increase leverage beyond a safe threshold.
⬛️ 11. Uncertainty and Constraints
• Uncertainty level: medium.
• Avoid high leverage, require strict pattern confirmation before entry, limit the number of trades.

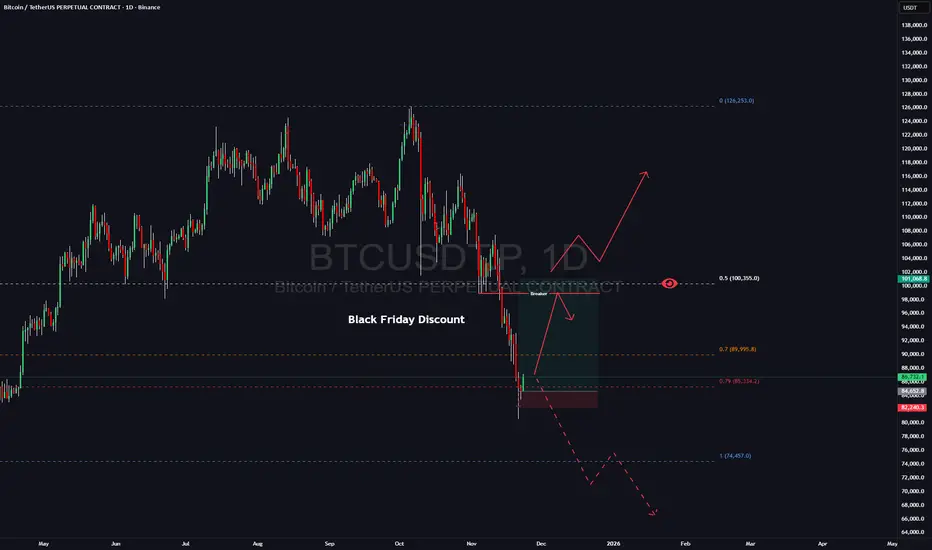
BTC Is Preparing Monster Move: My Bullish Roadmap to New High!A lot of people are already calling for the end of the BTC rally and welcoming a new bear market. Whether that’s true or not — the chart will show. I approach the market with a neutral mindset and let price action speak for itself.Plus dont forget we have Black Friday coming and probably crypto market decided to give you a nice discount)
From my perspective, Bitcoin has simply tapped the weekly discount zone. Historically, BTC often delivers a 20–30% corrective move, which is completely normal within a bullish cycle. And with Black Friday approaching, it seems the crypto market decided to offer its own “discount.”
I’ve taken a long position from this area, with my first target set at 94–96K, where I plan to secure the majority of my profits.
My stop is positioned around 82K — if the market goes against me, I’m fully comfortable with the risk.
I’ve also added some spot positions and will share detailed analysis on those in upcoming posts.
Once we reach the 94–96K zone, I’ll reassess the market. Price can shift in either direction from there, which is why that area is my main profit-taking zone while letting the remainder of the position run.
Follow me for further updates and trade breakdowns.
104k Moonshot or Brutal 96k Rejection? Bitcoin’s Final Bull TrapFriends, Bitcoin has played out exactly as outlined in my previous idea.
As I mentioned last time, that drop could have either been:
1. The start of a deeper bearish continuation after a minor correction, or
2. Wave B of a larger ABC correction — in which case BTC had to reclaim above 93k.
The chart has confirmed the second option — it was wave B.
Therefore, we are now building wave C upwards, and Bitcoin has already broken above 93k.
On the current chart I still have two active scenarios:
🟠 Orange arrow scenario:
A quick push toward ~96k followed by a reversal and drop back to the recent lows.
In this case, the entire three-wave move we’ve seen so far could become wave A of a larger corrective structure.
🟢 Green arrow scenario (my preferred one for now):
Continuation higher to the 102–104k zone, completing wave C of this correction, and only AFTER that we finally update the recent lows.
My ultimate downside target remains 60k and below, but first let’s see which path Bitcoin chooses in the coming days.
Which scenario do you think will play out — orange or green?
Drop your thoughts in the comments! 👇
Like, comment, follow if you find this helpful — really appreciate your feedback and reactions! 🚀

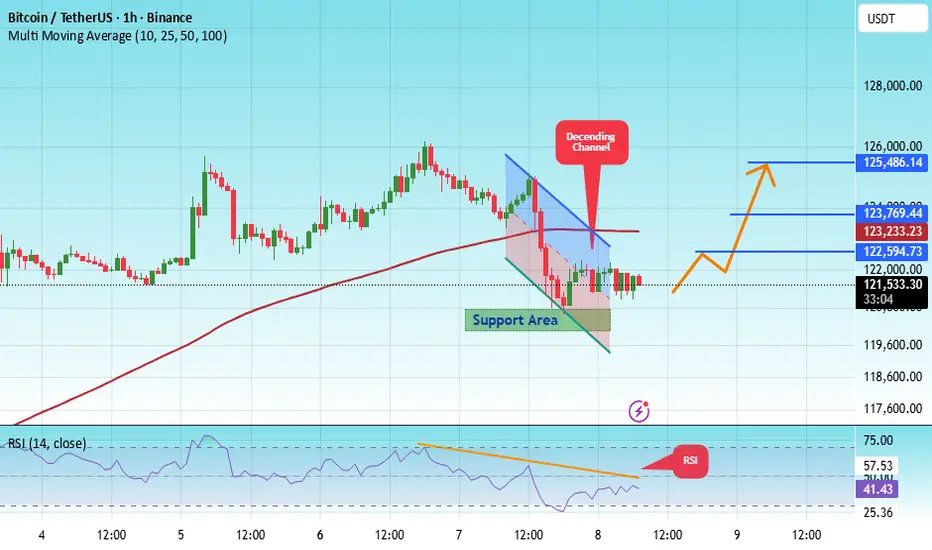
#BTC/USDT is currently strongly bullish#BTC
The price is moving in a descending channel on the 1-hour timeframe. It has reached the lower boundary and is heading towards breaking above it, with a retest of the upper boundary expected.
We have a downtrend on the RSI indicator, which has reached near the lower boundary, and an upward rebound is expected.
There is a key support zone in green at 92500. The price has bounced from this level multiple times and is expected to bounce again.
We have a trend towards consolidation above the 100-period moving average, as we are moving close to it, which supports the upward movement.
Entry price: 92990
First target: 93204
Second target: 93750
Third target: 94406
Don't forget a simple principle: money management.
Place your stop-loss below the support zone in green.
For any questions, please leave a comment.
Thank you.

#BTC/USDT is currently strongly bullish#BTC
The price is moving in a descending channel on the 1-hour timeframe. It has reached the lower boundary and is heading towards breaking above it, with a retest of the upper boundary expected.
We have a downtrend on the RSI indicator, which has reached near the lower boundary, and an upward rebound is expected.
There is a key support zone in green at 85249. The price has bounced from this zone multiple times and is expected to bounce again.
We have a trend towards stability above the 100-period moving average, as we are moving close to it, which supports the upward movement.
Entry price: 86624
First target: 87386
Second target: 88635
Third target: 90106
Don't forget a simple principle: money management.
Place your stop-loss below the support zone in green.
For any questions, please leave a comment.
Thank you.

btcTwo important points seem to me: First, I think we are close to the time to buy and we should be ready to continue. But the second important point is that the red box has not yet allowed to break and has brought the price down. The red triangle area is in high demand, so we need to see if we can make a swing buy at the current prices.

Start Accumulating BTC!Bitcoin has reached a major demand zone between $91,000–$97,000, an area that has consistently acted as a strong support throughout 2024–2025.
Price has now tapped the bottom of this accumulation zone, where buyers previously stepped in aggressively.
Key Points:
BTC is sitting inside a high-probability bounce zone.
Historically, this region has triggered strong upward reversals.
Market structure is still intact as long as price holds above $91,000.
Perfect area for long-term positioning.
Start accumulating BTC within this support zone.
This is one of the cleaner levels to build exposure before the next macro move.

ANFIBO | Bitcoin BTCUSD - Bet a Buy order [11.14.2025]Hi traders, Anfibo’s here!
BTCUSD – Technical Outlook
Technical Structure:
BTC is now trading extremely close to a major structural support zone, aligning with the 61.8% Fibonacci retracement around the $94,000 region. This confluence makes the area a high-value reaction point—historically, 61.8% fib zones often act as strong bases for corrective rebounds during healthy bull-cycle pullbacks. Momentum is slowing down as price compresses into this support cluster, signaling that the market is preparing for a potential relief bounce… unless the level fails.
Trading Strategy:
Our approach today focuses on respecting this key confluence zone.
If BTC stabilizes above 94k, a short-term rebound toward 110,000 USD is a realistic target.
However, if price breaks below 91,000 USD, structure becomes decisively bearish, exposing deeper supports and invalidating the rebound setup.
This is a “react at the level, not before the level” type of day.
Daily Trading Plan:
>>> BUY ZONE:
ENTRY: 93,500 – 95,000
SL: 90,500
TP: 110,000
(Looking for a clean rebound from the 61.8% confluence, ideally with volume pickup or bullish rejection candles.)
>>> SELL ZONE: (only if 91k breaks cleanly)
ENTRY: 90,000 – 91,000 (retest of breakdown)
SL: 94,000
TP: 87,000 → 80,000 → 77,000 → 72,000 → 63,000
(A structural breakdown would shift momentum from corrective to impulsive downside.)
Risk Management:
Keep size moderate; counter-trend buys at major supports require disciplined SL usage.
If entering long, move stop to breakeven once price clears 98k–100k to reduce downside exposure.
Never average down near broken supports; wait for structure to confirm strength before adding.
If the 91k level breaks, switch to defensive mode — reassess bias and avoid catching falling knives without confirmation.
Conclusion:
BTC is sitting on one of its most important confluence supports at 94k. A rebound from here can push price toward 110k, but a clean breakdown below 91k will shift the broader narrative toward a deeper corrective leg with multiple supports waiting below (87k → 80k → 77k → 72k → 63k). Today is a critical inflection point—let the level decide the direction and react accordingly with disciplined execution.
GOODLUCK GUYS!!!

XAUUSD:PRICE ON FIREHello traders,
Our bullish outlook on gold has been confirmed. Price followed the analysis step by step and we’re currently sitting at +1800 pips.
Waiting for the final target to be tapped. Stay patient & disciplined. 📈✨

BTC Is Warming Up for Its Next Big Move — Don’t Miss This Setup Few thoughts about BTC:
when you trade crypto you have to look at 4h+ time frame, daily or weekly is the best to see clean picture.
Right now BTC just touched discount( 100359)
now i can see 3 possible scenarios
1 - small pull back next week and then pump 130-140k first target
2 - price will go a bit deeper to fill weekly FVG at ~90k
3 - CRYPTO SCAM AND WE ARE ALL DOOMED😱😱😱
until we didnt see BTC break below 70k , i am still bullish on crypto and buying some coins on spot for my portfolio, i am not heavy in crypto but 200-300$ a week is nice investment with potential x10-20 return is nice option

#BTC/USDT bounce from Support, Bullish Momentum Intact#BTC
The price is moving within a descending channel on the 1-hour frame, adhering well to it, and is heading for a strong breakout and retest.
We have a bearish trend on the RSI indicator that is about to be broken and retested, which supports the upward breakout.
There is a major support area in green at 120,500, which represents a strong support point.
We are heading for consolidation above the 100 moving average.
Entry price: 121,666.
First target: 122,600.
Second target: 123,770.
Third target: 125,480.
Don't forget a simple matter: capital management.
When you reach the first target, save some money and then change your stop-loss order to an entry order.
For inquiries, please leave a comment.
Thank you.
ANFIBO | BTCUSD will go to 109,000 USD?Hi guys, Anfibo's here ! This is my BITSTAMP:BTCUSD – In-Depth Analysis & Trading Plan
In the most recent session, BTC showed a positive reaction at the $111,000 support level, bouncing back above $112,000. This indicates that short-term buying pressure remains present around this key zone. However, on the H4 timeframe, I believe BTC is likely to form a double bottom pattern around the $109,000 region – which is precisely where I am waiting for a strategic buy entry with a favorable risk-to-reward setup.
Here's My Trading Plan:
>>> BUY ZONES:
- ENTRY: 108,000 - 110,000
- SL: below 107,000 (depending on risk appetite)
- TP1: 117,500
- TP2: 122,000
- TP3: 128,000
Key Resistance Levels Before Reaching TP
For BTC to achieve the targets, it must first clear several intermediate resistance levels:
$117,500
$119,000
$122,000
These will serve as critical checkpoints, as price reactions here will determine whether the recovery trend can sustain momentum.
Important Support Zones to Watch
In the event of further weakness, the following support levels will be crucial:
$109,500
$105,000
$101,000
Notably, $101,000 is a decisive level on the higher timeframe. Should this support break convincingly, we must prepare for a major trend reversal scenario, potentially opening the door to a deeper decline.
Conclusion, Personal Outlook
BTC is currently moving within a key support area and is showing signs of forming a short-term bottom. My primary strategy is to buy around $109,000, aiming for a recovery toward the $120,000 – $125,000 range, while maintaining strict risk management in case the $101,000 level is broken.
In this environment, short-term traders can take advantage of corrective rallies, while long-term investors should remain patient and monitor the 101k zone closely – as it represents a potential “line in the sand” that could redefine the next major cycle.
WISH ALL YOU THE BEST, MY FRIENDS!

BTC/USDT Bearish Trend analysis Read The captionSMC Trading point update
Technical analysis of BTC/USDT (4H timeframe) chart analysis:
---
Bearish Bitcoin Setup
Trend: The market is clearly in a downtrend, with price respecting the descending channel.
Fair Value Gaps (FVG): Two FVG zones are highlighted where price retraced to fill imbalances.
Moving Averages:
50 EMA (red) and 200 EMA (blue) are above price, confirming bearish momentum.
Key Resistance: Price is currently retesting the FVG supply zone around 111,000 – 111,500, which aligns with the descending trendline.
Rejection Expected: If sellers defend this zone, price is likely to continue its bearish trajectory.
---
Target Point
A measured move suggests a potential drop towards 106,218 (next support / target zone).
This aligns with the channel’s lower boundary.
.
Mr SMC Trading point
---
Trading Idea
Bias: Bearish.
Entry Zone: Around 111,000 – 111,500 (FVG supply & trendline confluence).
Target: 106,218.
Invalidation: A breakout above 113,000 (200 EMA) would weaken the bearish setup.
---
Please support boost 🚀 this analysis

BTC Bearish ScenarioPattern Recognition:
A Head and Shoulders (H&S) reversal structure formed on the daily chart. The 1:1 measured move target has already been achieved, confirming the pattern’s validity.
Confluence Zone:
That 1:1 target aligns closely with the 0.618 retracement of the previous down leg (124,610 → 107,211). This adds weight to the idea that the move is corrective in nature rather than a fresh bullish leg.
Market Structure:
Even though price rallied strongly, the bigger picture shows a lower low was created when the 112,017 support level was broken. This keeps the macro trend bearish until proven otherwise.
Bearish Scenario:
Price is currently respecting the rising trendline. A break below this trendline followed by a retest could trigger continuation to the downside. Potential supports to watch:
112,017 (previous broken support, could flip resistance).
110,681 / 109,363 (structural levels).
108,432 (major demand zone).
RSI:
Momentum has cooled off without reaching overbought levels, suggesting that upside pressure is weakening.

BTC Analysis — Long-Term Buy Zone AheadI'm watching $111,000 as a major buy zone on Bitcoin.
If price retraces to that level, I’ll be ready to enter a long position.
This is not a prediction — it’s a scenario.
Smart traders don’t guess, they prepare.
Let price come to your level. No chasing.
📍Set your alerts and stay patient.

BTC Inverse Head and ShouldersThe chart clearly shows an inverse head and shoulders formation:
Left Shoulder: ~Aug 26 low.
Head: ~Aug 29 low.
Right Shoulder: ~Sep 5-7 low.
This is a bullish reversal pattern after a prolonged downtrend. The breakout above the neckline (around 113,200 – 113,500) confirms the bullish bias.
Fib & Extension Targets :
Immediate target: Fibonacci 1.0 extension ~119,600.
Extended target: 1.618 extension ~123,500.
These align well with previous resistance levels (early August highs).

BTC Inverse Head and ShouldersThe chart clearly shows an inverse head and shoulders formation:
Left Shoulder: ~Aug 25 low.
Head: ~Aug 29 low.
Right Shoulder: ~Sep 5-7 low.
This is a bullish reversal pattern after a prolonged downtrend. The breakout above the neckline (around 113,200 – 113,500) confirms the bullish bias.
Fib & Extension Targets :
Immediate target: Fibonacci 1.0 extension ~119,600.
Extended target: 1.618 extension ~123,500.
These align well with previous resistance levels (early August highs).

#BTC/USDT Bullish Divergence on 1H, Low Risk Trade#BTC
The price is moving within a descending channel on the 1-hour frame, adhering well to it, and is heading for a strong breakout and retest.
We have a bearish trend on the RSI indicator that is about to be broken and retested, which supports the upward breakout.
There is a major support area in green at 109800, which represents a strong support point.
For inquiries, please leave a comment.
We are in a consolidation trend above the 100 Moving Average.
Entry price: 111164
First target: 111727
Second target: 112450
Third target: 113470
Don't forget a simple matter: capital management.
When you reach the first target, save some money and then change your stop-loss order to an entry order.
For inquiries, please leave a comment.
Thank you.
