BTCUSD Rejected at Range High – Bearish Pressure BuildingPrice is trading inside a broad consolidation range / channel, but the key detail is this:
We had a strong impulsive bounce from the lows
Price tapped the upper boundary (~72K area)
Since then → forming lower highs
Now compressing under resistance around 68.6K
That shift from higher highs to lower highs is important. Momentum is fading.
🔴 Bearish Scenario (Primary Bias)
Current structure shows:
Descending minor trendline
Rejection from resistance zone
Weak consolidation near support
If price breaks below:
68,000 – 67,900 support zone
Then we likely see:
🎯 66,500
🎯 65,000
Possibly channel lower boundary near 63K if momentum expands
This looks like distribution after a corrective rally.
🟢 Bullish Invalidation
For bulls to regain control:
Price must reclaim 70,200 resistance
Break and close above descending structure
Without that, upside looks limited.
📊 Overall Bias
Short-term bias: Bearish while below 70.2K
This is classic:
Range high rejection → lower highs → pressure building at support.
If support cracks, move could accelerate quickly.
Btcupdate

BTC : (70103.85 Daily High)Bitcoin will be crossing over to the potential level of (70103.85) this is due to the daily time frame as it needs to close above it’s previous high , and on the (1 Hour) it’s looking to give a nice bullish push up that will head upwards using (3 white soldiers), the structure is very clear to see and with price included we could even touch the (71468.81) area / price zone)

`bitcoin await breakout#BTCUSD price await 69900 for bullish trend, after break there it will reach 70545 which shows another trend on H4. Valid breakout there will push price to 72k,74k
Buy stop 69900, target 72k,74k, SL 68700.
Below 68200 break holds sell continuation till 65k

Bitcoin 1H Pullback Into Key Support ZoneStrong impulsive move up.
Price started forming a rising channel.
After tapping upper channel resistance, momentum faded.
Now we’re seeing a controlled bearish pullback inside the structure.
That red leg down shows short-term bearish pressure — lower highs forming on the intraday scale.
📉 Current Situation
Price is sitting around 68,800–69,000 zone, which is:
Near the lower channel trendline
At a marked horizontal support / prior resistance flip area
This is a decision zone.
🐂 Bullish Scenario
If price:
Holds above 68,700–68,800
Prints higher lows on lower timeframe
Breaks back above 69,500–69,800
Then we could see a push toward:
70,300
71,000
Possibly upper channel resistance again
This would confirm the channel is still respected.
🐻 Bearish Scenario
If price:
Breaks and closes below the lower channel
Loses 68,700 decisively
Then momentum likely accelerates toward:
67,800
67,000 area
That would invalidate the bullish channel structure and shift bias short-term bearish.
🎯 Bias Right Now
Neutral-to-bullish as long as the channel holds.
But short-term momentum is bearish until structure flips back.
This is a classic “support reaction or breakdown” moment.

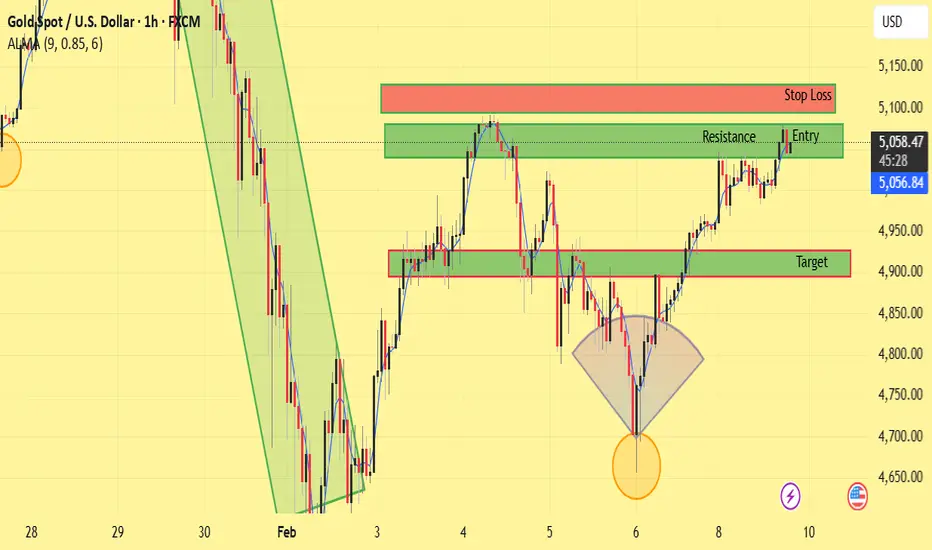
We’re looking at Gold vs USD on the 1-hour chartPrice recently completed a deep pullback after a strong bullish leg.
That pullback formed a rounded / cyclical bottom (purple curve), which often signals trend continuation, not reversal.
🧠 Structure & Price Action
What stands out:
Higher low formed after the sell-off → bullish market structure
Strong impulsive bullish candles off the lows → buyers in control
Price reclaimed and is holding above a key mid-range level (~4960)
This tells us:
The correction phase is likely complete, and price is transitioning back into an impulse phase upward.
🎯 Trade Idea (Based on Your Chart)
✅ Entry
Buy around 4,960 – 4,970
This is a pullback entry inside bullish continuation
🛑 Stop Loss
Below the recent structure low
Around 4,840 – 4,860
If price breaks here, the bullish idea is invalidated
🎯 Target
5,050 – 5,100 zone
This aligns with:
Prior resistance
Projected impulse leg (measured move)
Liquidity resting above highs
Risk–Reward:
Roughly 1:2.5 to 1:3, which is solid for an intraday/swing setup.
🔍 Why This Setup Makes Sense
Bullish continuation after correction
Structure shift confirmed (higher low)
Strong momentum candles
Clear invalidation level (clean risk)
The blue projected path you drew fits perfectly with a pullback → continuation → expansion model.
⚠️ Invalidation Clue
If price:
Breaks and closes below the stop zone
Or starts printing lower highs + strong bearish momentum
→ bullish bias is off, and we reassess.

XAUUSD (Gold) – 1H Chart Analysis & Trade IdeaGold is currently trading within a short-term bullish structure after forming a clear reversal from the recent swing low. The price action shows higher highs and higher lows, supported by strong bullish momentum.
Technical Overview
Price previously sold off aggressively but found strong demand near the marked swing low, forming a V-shaped reversal.
After the reversal, gold broke above minor structure and continued to climb, confirming bullish continuation.
The current price is approaching a key resistance zone, which has been marked as the potential entry area.
This resistance zone also aligns with prior supply, increasing the probability of a short-term pullback.
Trade Idea
Entry: Sell from the marked resistance zone near 5,055–5,060
Stop Loss: Above the upper red zone (above resistance / liquidity area)
Target: The marked green demand zone around 4,900
Bias
Short-term: Bearish from resistance (pullback expected)
Invalidation: A strong bullish close above the resistance zone would invalidate the short setup and suggest continuation to higher levels.
This setup is based on support & resistance, market structure, and price reaction zones. Always wait for confirmation and manage risk accordingly.
Premium Sell Zone Activated on BTCUSDMarket Structure – BTCUSD (1H)
Price is moving inside a rising channel
Overall short-term structure = bullish correction inside a broader downtrend
We’re currently trading around 69,790
Key reaction zones are clearly marked:
Upper supply / resistance: 71,968 – 71,900 area
Mid support / target zone: 68,371
Channel support below that
🧠 What’s Happening?
Price rallied strongly from the 60K lows and is now compressing near the upper half of the channel.
But here’s the important part:
The 71.9K zone is acting as a major supply area + prior support turned resistance.
That makes it a strong reaction zone.
The chart bias looks like a sell-from-premium idea inside the channel.
📉 Bearish Scenario (Primary Idea)
Entry zone: 71,900 – 71,968
Stop loss: Above 72,200 (clean break above supply)
TP1: 70,000 psychological level
TP2: 68,371 (major support level marked)
Extended TP: Channel support near 66K if momentum builds
This would be a clean liquidity grab above resistance → rejection → move back to mid-channel support.
Risk-reward is solid if entry is near 71.9K.
📈 Bullish Invalidation
If BTC:
Breaks and closes strong above 72.2K
Holds above the supply zone
Then we likely see continuation toward 74K–75K and possibly channel highs.
⚖️ My Technical Take
Right now, this looks more like a corrective rising channel inside a bearish macro structure — which statistically favors:
👉 Sell high in the channel
👉 Target mid or lower channel
Unless buyers show strong breakout volume.

BTCUSDT – Structured Re-Entry | Buyers DefendingAfter taking profit on my previous idea, I am re-entering with new structures developing on the lower timeframes.
This is a somewhat dangerous trade. Momentum is not explosive yet and the market may require time and patience before expansion. However, price is currently sitting in a reaction zone where demand has previously stepped in, offering a favorable risk-to-reward profile.
I am not expecting an instant pump — I am positioning for the probability of a push at least toward the 74K - 76k liquidity area if buyers manage to defend this base.
We currently have three setups:
🔥 1 aggressive entry – tighter invalidation, higher sensitivity.
⚖️ 2 moderate entries – more confirmation, smoother exposure.
Each trader can decide the level of risk they want to assume.
If the structure breaks → I exit and reassess.
If it holds → we aim for continuation into higher prices.
Patience and risk control are key here.

Elliott Wave Cycle Completed: ABC Correction in ProgressThis idea presents a high-timeframe Elliott Wave analysis on BTC/USDT (1W), suggesting that Bitcoin has likely completed a full 5-wave impulsive cycle and is now unfolding a corrective ABC structure, with Wave C currently in progress.
The goal of this post is educational first: to illustrate how Elliott Wave Theory structures market cycles, while also integrating macro-economic and geopolitical factors that may influence Bitcoin price action in the coming months.
Elliott Wave Structure Explained
According to Elliott Wave Theory, markets move in fractal cycles:
5 waves in the direction of the main trend (Impulse)
3 waves against the trend (Correction: A-B-C)
On this chart:
Waves (1) to (5) form a clear impulsive advance
Momentum divergence and structural exhaustion appear near the Wave (5) top
The market then transitions into a corrective phase
Wave A : sharp impulsive decline
Wave B: corrective rebound (often deceptive and sentiment-driven)
Wave C : typically the strongest and most emotional leg, often matching or exceeding Wave A in magnitude
Current price action suggests BTC is developing Wave C, which historically aligns with:
Increasing fear
Negative narratives
Macro uncertainty
Liquidity tightening
Technical Confluence
Several technical elements support the Wave C hypothesis:
Breakdown below key Fibonacci retracement levels
Loss of prior macro support zones
Weak momentum structure on higher timeframes
RSI trending into bearish territory, consistent with corrective phases rather than impulsive rallies
Wave C often seeks liquidity zones, prior consolidation ranges, or deeper Fibonacci retracements before a larger trend resumes.
Macro, Economic & Political Context
Beyond pure technicals, Bitcoin does not move in isolation. Current macro conditions that may amplify corrective pressure include:
Monetary policy uncertainty
High interest rates and delayed rate cuts reduce speculative liquidity, impacting risk assets like crypto.
USD strength vs global currencies
A strong dollar historically pressures BTC during corrective phases.
Geopolitical instability
Wars, trade tensions, and political polarization increase short-term volatility and risk aversion.
Regulatory pressure & narrative cycles
Regulatory uncertainty often peaks during market corrections — right when sentiment is weakest.
These factors do not invalidate Bitcoin’s long-term thesis, but they align well with a corrective Wave C environment.
Important Notes
Elliott Wave counts are probabilistic, not absolute
Alternative counts always exist
This is not financial advice
Always manage risk and confirm with your own tools
Corrections are not the end of a trend — they are the price paid for the next expansion.
Final Thought
Wave C is often where fear peaks and opportunity quietly forms. Whether this scenario plays out fully or partially, understanding where we are in the market cycle provides a strong strategic edge, especially on higher timeframes.
If you find this breakdown useful or educational, feel free to like, comment, or share your alternative counts — market structure thrives on discussion.

Markets Could See Up to $80B of Selling PressureGoldman Sachs Warns of Massive Systematic Selling — Markets Could See Up to $80B of Pressure
Goldman Sachs’ trading desk recently issued a cautionary note that the current sell-off in global markets may not be over yet, and that downside pressure could extend significantly through February and beyond.
🔹 Systematic selling still in motion
According to GS, trend-following algorithmic strategies (like CTAs — Commodity Trading Advisers) have already triggered sell signals as key equity indices dipped, making them net sellers in the near term regardless of direction. Even in a flat market, these systematic models are expected to unload shares simply to rebalance positions.
🔹 Billions in potential sell-offs
Goldman’s analysis suggests:
~$33B of selling could occur this week if markets continue to weaken;
As much as ~$80B of systematic selling could be triggered over the next month if the S&P 500 breaches key technical thresholds.
Even without a further drop, models imply roughly $15B–$8B of selling in various scenarios as systematic funds reset exposure.
This selling isn’t driven by fundamental business news but mechanical trends and volatility — meaning these flows can hit markets even during mild rebounds.
⚠️ Why This Matters for Markets
📉 Equities: If trend-following selling continues, it may prolong or deepen the equity correction. These models can act independently of fundamental earnings or macrodata, amplifying volatility.
📉 Crypto (including BTC):
Bitcoin and other risk assets often move in sympathy with equities during stress periods. Liquidity drain in stock markets can spill over into crypto as investors de-risk, and systematic selling can trigger stop-loss cascades across correlated markets. Reports specifically note that such selling could pose downside risks for Bitcoin, gold, and silver as liquidity conditions deteriorate.
🧠 What This Means in Practice
💡 Not a guaranteed crash, but a higher probability of continued volatility and downside pressure across risk assets if:
Key equity support levels break
Volatility stays elevated
Trend-following models remain active sellers
This is not about fundamentals turning suddenly weak — it’s about technical and systematic flows creating selling pressure on autopilot.

BTC/USDT — Exhausted Sell-Off: Consolidation or Slow Grind Lower✔️ The week closed with a red candle and a long lower wick, but it does not qualify as a reversal pattern.
🟢 RSI is extremely oversold on higher timeframes.
🟢 Buyer reaction is visible at the support block.
Price spent ~250 days in the 55–70k range — it’s reasonable to expect at least a pause or consolidation here.
🟢 US employment is weakening — a potential signal for rate cuts ahead.
🟠 The structure resembles May 2022, as if only half of the downside move has played out.
This scenario is now widely discussed on social media, which reduces the odds of a direct repeat.
🟠 Extreme fear, with the index dropping to 5.
🔴 The market is highly exhausted, but hasn’t reached full apathy yet.
🔴 Both institutional and retail investors continue selling crypto ETFs.
🔴 Negative cumulative delta: –$1.62B.
🔴 The risk of entering a prolonged bear cycle is increasing.
🧠 The sell-off unfolded faster than expected, but the rebound failed to produce a reversal.
Base case: slow grind lower for 1–3 weeks, with a reversal near the lows — possibly with a sweep, possibly without.
The key is that a reversal eventually forms.

BTCUSDT PLAN B ROCKED
As we discussed earlier Plan-B worked hope it helped you guys, now lets wait for retracement then will update the move as Price Action

BTC — Range Deviation Play & Bear Flag TargetBitcoin continues to trade inside a clearly defined sideways range. Recently, the price made a deviation above the range high — a classic false breakout — and quickly returned back inside the channel, confirming the upper boundary as strong resistance.
Now, on the daily timeframe , the market is forming a bear flag , which typically acts as a continuation pattern to the downside. If this structure breaks lower, it opens the way toward the $68–67K zone , which aligns perfectly with the lower boundary of the range.
A move into this area would likely create a deviation below the range low, mirroring the earlier deviation at the top. Such symmetrical deviations often signal liquidity grabs before a potential mid-term reversal.
Key Points:
Range structure remains intact
Upper deviation confirmed — failed breakout
Daily bear flag suggests continuation lower
Target: $68–67K (potential lower deviation zone)
This scenario remains valid as long as BTC stays below the mid-range and the bear flag structure holds.

Liquidity Sweep → Corrective Rally SetupMarket Structure (HTF → LTF)
Strong bearish BOS on the left → clear downtrend.
Price makes a sell-side liquidity sweep (labeled “fake breakout”) below the prior low.
Immediate rejection from the lows → suggests bear trap / short covering.
👉 This often precedes a mean reversion or corrective rally, not an instant trend reversal.
2. Key Zones on the Chart
🟦 Support / Demand Zone (~66k–68k)
This is where price:
Swept liquidity
Reclaimed structure
Printed strong bullish candles
Valid reaction zone, but still counter-trend.
⬛ Resistance / Target Area (~74k–75k)
Marked as TARGET POINT
Aligns with:
Prior structure
BOS origin / imbalance
Logical upside objective for a relief rally.
3. Current Price Behavior
Price is consolidating and stair-stepping up from support.
No clean bullish BOS yet on higher timeframes.
Structure is corrective, not impulsive.
📌 This favors scalp → short swing longs, not HTF position longs.
4. Trade Scenarios (TradingView-Friendly)
🔵 Bullish Scenario (Preferred)
Entry:
Pullback into the support zone OR
LTF CHoCH above minor highs
Targets:
TP1: ~70.9k (mid-range / equilibrium)
TP2: ~74k–75k (main target)
Invalidation:
Clean close below the support zone
🔴 Bearish Scenario (If Rejected)
Strong rejection / bearish engulfing near 74k–75k
Look for:
LTF BOS down
Failed continuation
Possible continuation with the dominant HTF trend

XAUUSD (Gold) – 1H Chart Analysis & Trade IdeaGold has completed a strong corrective phase after the sharp bearish impulse and is now showing signs of trend reversal and bullish continuation. Price respected the recent swing low (marked with the circle), forming a higher low, which confirms improving market structure.
After the rebound, price pushed above the short-term moving average and successfully retested a key demand zone, which now acts as support. This area aligns with previous consolidation, increasing the probability of bullish continuation.
Trade Idea
Entry: Buy from the highlighted green support / entry zone
Stop Loss: Below the red support zone (below recent higher low)
Target: Upper green resistance zone (prior supply area)
Technical Confluence
Higher low formation (bullish structure shift)
Strong rejection from demand zone
Moving average support holding
Previous resistance turned support
Favorable risk-to-reward setup
Conclusion
As long as price holds above the stop-loss zone, the bullish bias remains valid. A sustained move toward the marked target zone is expected. A break below support would invalidate this setup.
This analysis is for educational purposes only. Always manage risk properly.
If you want, I can also:
Rewrite this in short TradingView post style
Translate it into German, French, Spanish, Italian, Turkish, or Polish
Create a title-only version for quick posting

Eliana | BTCUSD – 30M – Intraday Market ConditionBITSTAMP:BTCUSD COINBASE:BTCUSD
After distribution near the 79,000–78,000 resistance range, BTC experienced a strong impulsive sell-off, confirming bearish dominance. The breakdown below 73,000 accelerated momentum toward the 69,000 liquidity pocket. Current bounce appears corrective rather than a trend reversal. As long as price remains below the broken structure and supply zones, overall bias stays bearish, with only intraday pullback opportunities for buyers.
Key Scenarios
❌ Bearish Case 📉 (Primary Bias) →
Rejection below 72,900 – 73,500 keeps sellers in control.
🎯 Target 1: 69,150
🎯 Target 2: 67,800
🎯 Target 3: 66,500
✅ Bullish Case 🚀 (Relief Bounce Only) →
Strong hold above 69,100 demand may trigger a corrective move.
🎯 Target 1: 72,900
🎯 Target 2: 75,000
🎯 Target 3: 76,800
(Bullish move is corrective unless structure flips)
Current Levels to Watch
Resistance 🔴: 72,900 – 76,800
Support 🟢: 69,100 – 67,800
⚠️ Disclaimer: This analysis is for educational purposes only. Not financial advice.

Selena | BTCUSD – 1D | Major Structure Breakdown & Recovery BITSTAMP:BTCUSD BITSTAMP:BTCUSD
After months of trending higher inside a rising channel, BTC lost structural support and rejected from the upper range near 126,000. Price formed a distribution range around 90,000–95,000, which ultimately broke down aggressively. The sharp sell-off suggests panic/liquidity release, with price now reacting from a strong historical demand area. Any upside from here should be treated as corrective until structure is reclaimed.
Key Scenarios
✅ Bullish Recovery (Corrective) 🚀
Strong hold above 50,000–52,000
Short-term recovery targets:
🎯 75,000
🎯 90,000–96,000 (previous supply / breakdown zone)
Current Levels to Watch
Resistance 🔴: 90,000 – 96,000
Support 🟢: 52,000 → 48,000
⚠️ Disclaimer: This analysis is for educational purposes only. It is not financial advice

Gold (XAU/USD) using a combination of key technical levelsThis chart analysis is focused on trading Gold (XAU/USD) using a combination of key technical levels and a specific entry, stop loss, and target strategy. Let’s break down the key components and ideas from the chart:
1. Price Structure and Trend:
The chart shows an overall sideways movement or consolidation pattern, with price moving within a certain range. It appears to be in a pullback after a prior upward move, with a possible bullish reversal expected from this point.
The purple curved line suggests the trader expects the price to rebound and move upwards, based on the price pattern and technical analysis.
2. Entry Point:
The entry point is marked at approximately 4,964.30, where the price is expected to start moving up. This level is significant because the price appears to be at a support zone (highlighted in green), and traders are looking for a buy position at this point, anticipating a breakout or reversal to the upside.
3. Target Level:
The target is identified around 5,080.00 (blue zone), where the trader expects the price to go if the trend continues upwards. This level is set with the idea of capturing potential profits if the price reaches or exceeds it.
The target area is likely determined based on resistance or past price highs, where the price has previously struggled to push higher.
4. Stop Loss:
The stop loss is placed around 4,840.00 (red zone). The stop loss is designed to limit potential losses if the price moves in the opposite direction of the trade (downwards).
The stop loss level appears to be just below a key support zone, ensuring that if the price falls below this level, it would signal that the bearish trend may continue, invalidating the trade idea.
5. Risk/Reward Setup:
The setup shows a favorable risk/reward ratio. The price has a chance to move up to the target (5,080.00) while limiting potential losses if the price falls to the stop loss (4,840.00).
If the trade is successful, the potential profit could significantly outweigh the potential loss, which is ideal for risk management.
6. Technical Indicators and Price Action:
The price action suggests that the market may be forming a double bottom pattern or similar reversal pattern near the entry point, signaling a potential shift to an uptrend.
The chart has a bullish bias, as indicated by the trader's setup for a long position and the price potentially breaking above resistance levels.
7. Conclusion/Trade Idea:
Buy near 4,964.30 (Entry Point) if the price shows signs of reversal or breaking through resistance.
Set a stop loss around 4,840.00 to manage risk.
The target is set at 5,080.00, expecting the price to reach this level if the bullish trend continues.
This setup relies on the idea that the market is in a bullish reversal phase, and the trader aims to profit from an upward movement.
This trading strategy focuses on technical analysis (support, resistance, price action) and aims to capitalize on the reversal after a pullback. The trader is positioning for a possible breakout and looking to manage risk using a well-placed stop loss.

Identifying Breakout & Retest Inside an Ascending Channel BTCUSDPrice is moving inside a clear ascending channel.
We’ve already seen a strong impulsive move up from the lower boundary.
Now price is consolidating near channel resistance around 70,800–71,200.
Previous resistance has flipped into short-term support (good bullish sign).
Momentum is slowing slightly, but structure is still bullish unless support breaks.
📈 Bullish Scenario (Primary Bias)
If price holds above 70,200 – 70,300 support zone:
Entry Zone: 70,600 – 70,800
Stop Loss: Below 70,150
Target 1: 71,270
Target 2: 71,900 – 72,000
Extended Target: 73,500+ (if channel breakout confirms)
Your projected move of ~1.6% toward 71,683 makes sense technically. That aligns with channel continuation.
⚠️ Bearish Scenario (Invalidation)
If price breaks and closes below 70,150 support zone:
Expect pullback toward 69,500
Deeper correction toward 68,800 possible
That would mean temporary channel weakness.
🧠 My Read
This looks like bullish continuation after breakout + retest inside rising channel.
As long as buyers defend 70.2k area, upside probability is higher.
🔥 Clean Title Idea:
BTCUSD 30M Ascending Channel – Bullish Continuation Toward 72K

Is 16000 - 19000 Possible for BTC??BTC Analysis
CMP 66200.71 (05-02-2026)
Hit the Target of Cup & Handle around 120000 - 123000 & then crashed.
Now it may bounce back from 61000 - 63000 towards 80000.
However, breaking the important Support zone (61000 - 63000)
may drop the price further around 48000 & then around 33000.
For long term investment, the most attractive buying range is
around 16000 - 19000 (if it comes).

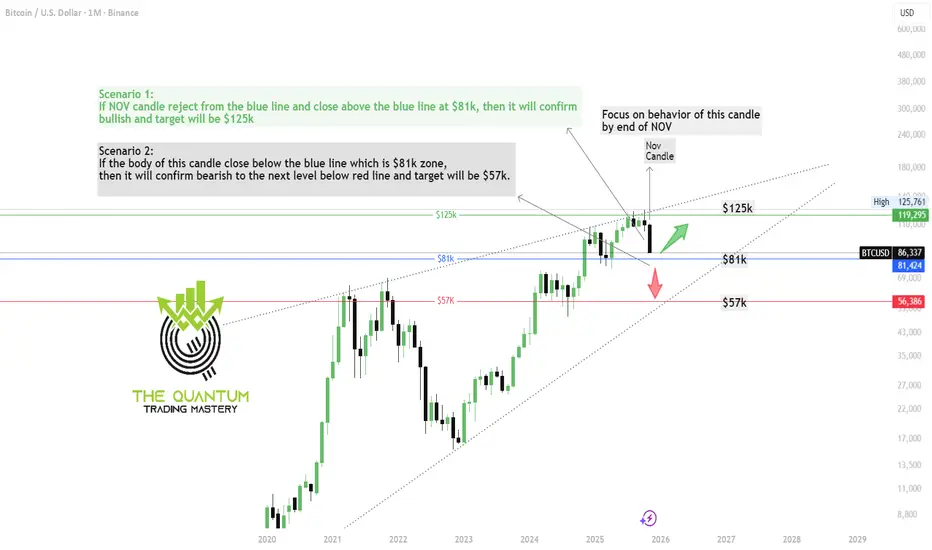
BTC Monthly Chart Technical AnaylsisDear Traders,
As expected from our previous weekly chart analysis, BTC has reached the $80K zone and has now successfully tapped $86K.
At this stage, the monthly candle is extremely important. I’ve shared the November candle—watch the closing carefully, because a major opportunity could be forming.
Trade smart, stay cautious, and if you find this update valuable, please show your support by boosting the post and dropping a comment.
The Quantum Trading Mastery
BTC WEEKLY CHART TRADING PLAN ROUTE MAPDear Traders,
Take a look at the BTC weekly chart—I’ve clearly marked all the key areas for you.
As you can see the weekly trendline is already broken which confirms bearish.
It appears that BTC may be repeating a familiar pattern heading into 2026. Compare the area highlighted with the orange circle in 2022 to the orange circle marked for 2026.
In 2022, price retested the trendline and formed a bull trap, where many buyers were likely caught. Price was then rejected from that zone, printed a bearish engulfing candle, the EMA 20 crossed below the EMA 50, and a strong bearish move followed to the downside.
If the EMA 20 crosses below the EMA 50, price is likely to revisit the EMA 200 (shown by the purple line) as a key support zone, where a bounce can be expected. Following that bounce, BTC could potentially break above the previous high around $125K and, if momentum continues, most likely extend toward the $150K region.
This chart is shared to give you a heads-up on potential traps ahead.
On the other hand, if the EMA 20 does not cross below the EMA 50 and candle bar closes above the trendline, it would confirm bullish trend continuation without a deeper pullback.
Its Important to practice patience, and risk management.
The Quantum Trading Mastery

BTC Multi-Timeframe Trading PlanWeekly Timeframe (Macro Bias & Swing Context )
On 17 December 2025, I shared the BTC weekly chart and clearly outlined what was likely to unfold. Congratulations to those who followed the analysis.
Price is mirroring the 2022 breakout pattern → expecting accumulation and breakout by mid-2025, with 2026 as a potential cycle expansion phase.
I’ve now updated the BTC weekly chart with additional confluences, highlighting two key upcoming support zones:
Swing Zone (liquidity Sweep possibilities): 65k – 68k
Retracement Zone: 56k – 60k
Comparison: 2022 vs 2026 setups
The 2022 structure marked on chart shows BTC breaking out from a falling trendline post large retracement, leading to multi-month rally.
The 2026 comparative zone mimics that exact setup — short-term liquidity sweep below support, confluence with OB + retracement zone, then structural breakout.
Key Observations
Trend Bias: Bullish macro cycle — higher highs and higher lows.
Structure: Re-Accumulation phase above 50W EMA & long-term ascending trendline.
Important Levels:
Demand / OB Zone: 55K–60K
Strong Support: 70K–73K
Resistance/FVG: 88K–92K → 110K–125K
Weekly Bias:
→ Bullish Re-Accumulation.
→ Enter dips near 70K–73K; accumulate for 90K+ breakout.
Weekly Swing Route Map
Entry: On Retrace Zone to 68K–73K OR breakout close above 80K.
Stop Loss: Below 65K (key structural invalidation).
Targets:
TP1 = 90K (FVG fill)
TP2 = 110K+ (cycle expansion zone)
Hold Duration: 2–8 weeks.
Integrated Setup (Multi Time Frame)
Example
1️⃣ On 4H: Look for a liquidity sweep under 75K (fake out wick) and bullish engulfing to close back above 75.5K.
→ Enter partial long with tight SL (74.5K).
2️⃣ On 1D: Add position when daily candle closes above 78K (bullish structure confirmation).
3️⃣ On 1W: If weekly closes strong >$80K, hold remaining position for macro target 90K–110K.
Trade with cautious. Trade is involved RISKs. This is not a trading Signal, its pure technical analysis based on many confluences marked.
Follow our page for more updates on GOLD, NASDAQ and BTC
The Quantum Trading Mastery
