Bitcoin 30M Ascending Channel | Buy the Pullback SetupStrong impulse from channel support
Break above minor consolidation
Currently sitting near upper channel resistance
No bearish shift yet (no lower low formed)
This is still a bullish continuation environment.
📈 Bullish Scenario (Primary Bias)
✅ Entry Zone
Around 70,050 – 70,150 (your marked entry area)
Best entry = pullback, not chasing highs.
🎯 Targets
TP1: 71,208
TP2: 71,755
If strong breakout above 71,800 → continuation toward 72K+ possible.
Momentum favors upside as long as channel holds.
🛑 Stop Loss
Conservative: below 69,678
Safer structural SL: below 69,622
Full structure invalidation: below 69,500
If price breaks below 69,622 and closes strong, that’s a warning of deeper retracement.
🔵 Key Support Zone
69,600 – 70,000
This is demand + mid-channel support.
If price pulls back into this zone and holds → high-probability continuation.
⚠ Bearish Scenario (Only If)
Rejection at channel top
Strong bearish candle closing below 69,622
Break of ascending structure
If that happens, next downside liquidity sits around:
65,758
65,715 zone
But right now? That’s secondary.
Overall Bias: Buy the Pullback in an Ascending Channel
This is not a breakout chase setup — it’s a structure respect setup.
Btcupdate

BTCUSDT - Where to buy?After such a big drop, price may range for a month.
I’m waiting for a long toward 80k, then a short to 49.1k.
The 40k–50k zone looks best for long-term accumulation.
BTC below 60k is still good opportunity to buy it

WEEKLY ANALYSISFirstly, you have to manage your watchlist by not having too many pairs. This will help your state of Reasoning and enable you to be more profitable. Wishing you a Great week start.

BTC 2H Update: Descending Broadening Wedge Breakout in Play!
Bitcoin has broken out of a **Descending Broadening Wedge** pattern on the **2-hour timeframe**!
This classic pattern features diverging downward-sloping trendlines with increasing volatility — often appearing at the end of a consolidation or downtrend phase. Statistically, descending broadening wedges show a strong bullish bias on upward breakouts (around 70-80% probability in many historical studies).
We've now seen a clean break above the upper resistance line, signaling that buyers are taking control with fresh momentum.
**Current Situation (as of Feb 8, 2026):**
- BTC is trading around $69,000–$70,000 after recent choppy action and a sharp dip/recovery earlier this week.
- The breakout looks promising, but crypto remains volatile — watch closely!
**Key Things to Monitor:**
✅ **Confirmation**: Price needs to hold firmly above the breakout level with rising volume to confirm strength and lower fakeout risk.
⚠️ **Fakeout Danger**: If price reverses quickly back into the wedge or turns the broken line into resistance, the setup could fail (watch recent lows for invalidation).
🎯 **Potential Targets**: If momentum builds, a measured move from the pattern could deliver a solid upward leg — room for a nice pump if buyers stay aggressive.
Stay disciplined: Manage your risk, avoid FOMO chasing, and don't go all-in blindly. This could kick off a strong move, but remember — Bitcoin loves throwing fakeouts! 😅

BTC Friday Retrace Hits VWAP: Bullish Reversal or Bull Trap?Will Bitcoin hold this level, or are we looking at a deeper correction?
The Friday retrace played out exactly as anticipated, with price pulling back into the VWAP and establishing a reversal into the weekly close. We are now sitting at a major resistance level where the market must decide its next macro move. In this video, I break down the exact price action signals I'm watching to determine if we break bullish or if the bears take control for a deeper run into the lows. 📉🚀
As a trader, the most dangerous move is front-running a breakout before the market settles. I’ll walk you through my Step-by-Step Trade Plan for the beginning of the week, including the specific entry triggers and risk zones I’m using to navigate this volatility.
What we cover today:
The significance of the Friday VWAP retrace and weekly close 📊
Key support and resistance levels for the Monday open 🔑
Market structure shift vs. trend continuation scenarios
My personal bias
Stay Disciplined: We don't predict; we react. Let the market settle into the new week and provide the confirmation needed to execute.
⚠️ RISK DISCLAIMER: Trading involves significant risk. This video is for educational and entertainment purposes only and does not constitute financial advice. Always perform your own due diligence before risking capital.

BTC Stalling Under Resistance — $63K Next?CRYPTOCAP:BTC quick update if you’re watching price right now 👇
#Bitcoin is still stuck under the same downtrend line. Every bounce into it keeps getting sold, which tells me this move is still weak.
We’re going sideways here, but honestly… this looks more like a pause than a real reversal.
If this range gives way, I wouldn’t be surprised to see $65K–$63K next.
For this to flip bullish, BTC needs to break and hold above the trendline. Until that happens, caution makes sense.
Let’s see how this level plays out.
DYOR, NFA

BTCUSD 15M: Accumulation Below 70K – Breakout or Rejection?Price is ranging just under a key resistance zone around 69,800 – 70,000. We can clearly see:
Previous high liquidity sweep (circled top)
Strong sell-off → market structure shift
Now forming a tight consolidation above support
This is classic accumulation below resistance.
🔵 Key Levels
Resistance:
69,800 – 70,000 (major intraday supply)
Above that → 70,800 – 71,200 (next liquidity pool)
Support:
69,300 – 69,350 (current demand zone)
68,950
68,450 (stronger 15M support)
🟢 Bullish Scenario (Preferred for now)
If price holds above 69,300 zone and breaks 69,800 with strong momentum:
Targets:
🎯 TP1: 70,000
🎯 TP2: 70,800
🎯 TP3: 71,200
Stop Loss: Below 68,950 (safer below 68,450 for swing hold)
The structure is slightly bullish because:
Higher lows forming
Price holding above mid MA
Consolidation under resistance usually means breakout pressure building
🔴 Bearish Scenario
If price fails to break 69,800 and loses 69,300 support:
Targets:
🎯 68,950
🎯 68,450
🎯 67,800 (if momentum increases)
That would confirm distribution instead of accumulation.
📌 Overall Bias
Short-term: Bullish above 69,300
Breakdown only if that support flips.
This setup looks like it’s loading energy for a push — but we need confirmation candle above resistance, not just a wick.

#BTC/USD Sell Trade Scenario.Here’s an up-to-date BTC/USD Sell trade outlook (technical + fundamental) to help you assess whether positioning for a Downside makes sense right now.
Thank You......

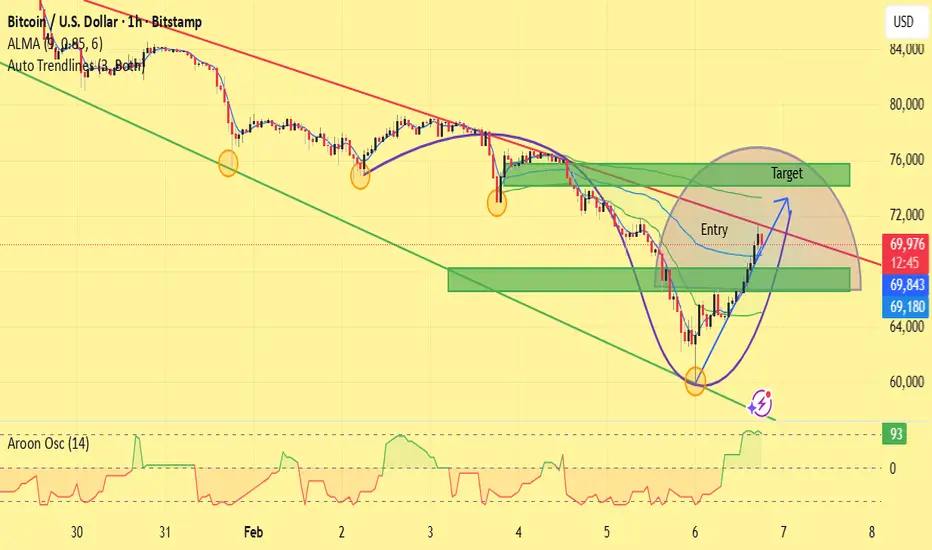
BTCUSD – 1H Chart Analysis & Trade Idea Bitcoin is trading within a broader descending channel, but recent price action shows a strong bullish reaction from channel support, suggesting a potential short-term recovery.
Technical Analysis
Price respected the lower trendline support of the descending channel and formed a rounded bottom / V-shaped recovery, indicating exhaustion of sellers.
A bullish structure shift is visible after the strong bounce from the lows, with higher highs and higher lows on the lower timeframe.
The green demand zone has acted as a solid support area, from which price is pushing upward.
The red descending trendline above is a key resistance and confluence area.
ALMA and dynamic levels suggest price is attempting a corrective move within the overall downtrend.
Aroon Oscillator is strongly bullish, confirming increasing upside momentum.
Trade Idea
Entry: Buy on pullback / confirmation within the marked green support zone.
Target: Upper resistance zone near the descending trendline (marked “Target”).
Bias: Short-term bullish correction, long-term trend still bearish unless price breaks and holds above the descending trendline.
Invalidation: A strong close below the demand zone and channel support.
Conclusion
This setup favors a counter-trend bullish move toward resistance. Traders should manage risk carefully, as the overall market structure remains bearish until a confirmed breakout occurs.
This analysis is for educational purposes only and not financial advice.
Bearish Continuation Setup After Dead-Cat Bounce (1H)
What the chart is saying:
Clear bearish trend: Price has been making lower highs and lower lows. The broader structure is decisively bearish.
Range breakdown: The blue box shows a consolidation range that broke to the downside, confirming continuation rather than accumulation.
Strong sell-off into demand: Price aggressively dropped into the red support zone (~62k–64k), where buyers stepped in hard, creating a sharp bounce.
Relief rally, not reversal: The current move up is a retracement, not a trend change. Momentum looks corrective, not impulsive.
Key resistance zone (~71k–72k):
This green area is previous support turned resistance
It aligns with the breakdown level → classic short opportunity
Planned trade idea (as drawn):
Entry: Into resistance (green zone)
Invalidation: Clean acceptance above resistance
Target: Prior support / liquidity pool around 63k
R:R: Favorable if rejection confirms
Bias:
📉 Bearish below resistance
Only a strong breakout + hold above 72k would weaken the short thesis
What to watch next:
Rejection wicks, bearish engulfing, or momentum divergence at resistance
Volume drying up on the push into the green zone
Failure to reclaim broken structure
⚠️ This setup assumes trend continuation, not a bottom. Until structure flips, rallies are sell-the-rip candidates.

BTCUSD Daily – Bearish Breakdown & Sell-the-Retests Setup
Here’s what the chart is saying, clean and to the point:
Market Structure
Clear distribution → breakdown sequence on the daily.
Price topped near the mid-90Ks, rolled over, and lost the 83–84K demand zone (former support marked in blue).
That loss flipped market structure firmly bearish.
Key Levels
Major breakdown level: ~83–84K (prior demand → resistance)
Supply / entry zone: ~72–74K (blue zone labeled “entry”)
Current support: ~67.4K (thin blue line)
Primary target: ~60–62K (grey demand zone)
Price Action Logic
The vertical sell-off into ~67K suggests impulsive bearish strength, not exhaustion.
The projected path shows a dead-cat bounce / consolidation into ~72–74K.
That zone aligns with:
Prior consolidation
Bearish retest logic
Likely supply from trapped longs
Trade Thesis (as illustrated)
Bias: Short
Entry idea: Sell a rejection in the 72–74K zone
Invalidation: Strong daily close back above ~75K
Target: 60–62K demand (first meaningful higher-timeframe support)
Big Picture
Unless BTC reclaims the 80K+ region quickly, this chart favors continuation lower, not a V-shaped recovery. The structure says rallies are for selling, not buying.

BTC To the moon?Bitcoin (BTC/USD) is currently positioned in a critical demand zone, which I believe represents a strong accumulation area for buyers. This zone has historically acted as a support level where significant buying interest emerges, preventing further downside and setting the stage for upward momentum.
From a technical perspective:
The price is consolidating around this demand area, showing signs of reversal with increasing volume and bullish candlestick patterns.
Key support levels in this zone are holding firm, aligning with Fibonacci retracement levels from the previous bull run.
I anticipate a strong bullish impulse from here, targeting $120,000 as the primary upside objective.
This target is derived from measured moves based on prior wave extensions and resistance projections.
Risk management: Place stops below the demand zone to protect against invalidation.
This is not financial advice; always DYOR.

BTC Breakdown Below $78.5K — Bearish Continuation Toward $55K?On the 3D timeframe (3-Day), Bitcoin’s structure appears to have exited the distribution phase at the top and is now entering a mid-term corrective phase. After printing a higher high around 120K+, price action has formed a sequence of lower highs → lower lows, indicating a structural shift from bullish to bearish in the medium term.
The recent sharp decline shows an impulsive sell-off that broke below a key horizontal support around $78,500, which previously acted as a demand / mid-range support zone.
This breakdown has turned the level into a new resistance (S/R Flip).
---
Pattern Formation
Several patterns can be identified on this chart:
1. Distribution → Markdown Phase (Wyckoff Context)
The upper range around 100K–120K reflects a distribution phase.
Multiple fake breakouts occurred before the final breakdown.
Once mid-range support failed, the market entered markdown.
2. Lower High Structure
After the ATH, every bounce failed to create a new high.
This signals weakening buyers and increasing seller dominance.
3. Bearish Retest Setup
The yellow path illustrates a common scenario:
Breakdown
Retest resistance
Rejection
Continuation downward
This is a classic breakdown → pullback → continuation structure.
---
Key Levels
Resistance:
$78,500 → Major resistance (former support)
$90K area → Minor supply if strong reclaim occurs
Support / Demand:
$55,000 → First major demand zone
$49,500 → Macro demand / previous cycle ATH zone
The $49K–$55K region is a historically strong HTF reaction zone.
---
Bullish Scenario
A bullish outcome remains possible but requires strong confirmation.
Bullish Requirements:
1. Price reclaims $78,500 with strong HTF candle closes.
2. Successful retest holding as support.
3. Structure shifts back into higher highs.
Upside Targets if reclaim succeeds:
$90K
$100K
$110K+
A reclaim of the breakdown level often triggers a short squeeze.
---
Bearish Scenario (Primary Outlook)
This is the dominant scenario based on the chart.
Bearish Flow:
1. Breakdown from $78,500.
2. Pullback / retest to resistance.
3. Rejection.
4. Continuation toward lower demand zones.
Downside Targets:
$62K (minor support)
$55K (major demand)
$49.5K (macro support / cycle level)
If $49K breaks, the market could enter a deeper macro correction.
---
Conclusion
BTC’s structure on the 3D timeframe shows a shift from bullish to mid-term bearish after losing the key $78.5K support.
As long as price remains below this level, market bias leans bearish with downside potential toward the $55K–$49.5K demand zone.
A reclaim of $78.5K becomes the key invalidation level for the bearish outlook.
#BTC #Bitcoin #BTCUSD #CryptoAnalysis #TechnicalAnalysis #BTCChart #CryptoMarket #PriceAction #SupportResistance #Wyckoff #MarketStructure #BearishScenario #BullishScenario #CryptoTrading

Smart Money Is Accumulating Bitcoin — Massive Move IncomingHi Traders ! BTCUSD was in a clear short-term downtrend but has now formed a strong reversal structure after bouncing from a key support zone around 64K–66K. Price is reclaiming momentum and pushing above minor resistance, signaling fresh bullish pressure.
A continuation move toward the next major resistance area is highly probable, marked as the TAKE PROFIT zone at 76,355.
📈 Long Setup
Entry: 70,035
Stop Loss: 64,165
Take Profit: 76,355
Momentum is shifting bullish — buyers are stepping back into the market. Time to go LONG on BTCUSD.
⚠️ This content is for educational purposes only, not financial advice. Trade at your own risk and manage your capital wisely.

Bitcoin’s V-Bounce Raises Red Flags! Short Squeeze or Real BottoBTC Today: Short Squeeze or Real Bottom? Why This Move Might Be a Trap
Today’s Bitcoin move has sparked optimism across the market. After dipping into the ~60k region, BTC aggressively squeezed higher, reclaiming key levels around 68k–71k in a short amount of time. Many are already calling this “the bottom.”
But if you zoom out and study Bitcoin’s historical behavior, this move looks far more like a short squeeze than a confirmed cycle low.
Why Today’s Move Looks Like a Short Squeeze
The rally came after:
A sharp sell-off into a well-known high-liquidity demand zone (~58k–60k)
Extremely bearish sentiment
Heavy short positioning after multiple breakdowns
This is the perfect environment for a squeeze:
Shorts pile in late
Price hits a major level
Market snaps higher as shorts cover and late longs FOMO
Short squeezes are fast, emotional, and convincing — exactly like what we saw today.
The Historical Problem: BTC Rarely Bottoms With a V-Shaped Recovery
Here’s the key issue:
Bitcoin almost never forms a macro bottom with a clean V-shaped recovery.
Across prior cycles:
Bottoms are formed through chop, retests, and boredom
Price usually revisits the lows at least once
Structure builds slowly, not explosively
The only major exception was the COVID crash, which was driven by:
Emergency global stimulus
Forced liquidations across all markets
Extreme external intervention
Outside of that event, V-shaped BTC bottoms are not the norm.
Why This Move May Be Creating False Hope
Markets often rally just enough to:
Convince traders the worst is over
Pull sidelined money back in
Force shorts to exit
This creates hope, which is a powerful tool.
But hope-driven rallies inside broader corrective structures often lead to:
Lower highs
Failed breakouts
A return to sweep remaining liquidity
And right now, there is still significant liquidity resting below 60k.
Why the “Real Move” Often Happens on the Weekend
Another pattern worth noting:
Bitcoin frequently makes decisive moves during low-liquidity periods
Weekends are notorious for:
Stop hunts
Fake breakouts
Sharp reversals when participation is low
If the market truly wants to reset positioning, a weekend move that:
Reverses lower
Sweeps liquidity below 60k
Forces maximum pain
…would be completely in line with historical behavior.
Key Levels to Watch
Resistance: 71k–72k (squeeze extension zone)
Support: 68k, then 66.8k
Liquidity magnet: sub-60k
As long as BTC remains below major weekly resistance, today’s move should be treated with caution.
Final Thoughts
This rally does not need to fail immediately to still be a trap.
Short squeezes can extend, consolidate, and then reverse.
Until Bitcoin:
Holds higher lows on higher timeframes
Reclaims and sustains key weekly levels
Stops reacting violently to liquidity
…it’s premature to declare the bottom is in.
Hope rallies feel good. Real bottoms feel boring.
Stay patient. The market may still have unfinished business below.

BTC actually Bullish IMOI get everyone is bearish on BTC and for all the right reasons. It lost support after support. But if you check supply profit/loss we are in a stage where honestly I really DONT SEE how whales and institutions will not fill their bags at this low prices similar to december 2018. Its common sense IMO. For me, this looks very bullish.

BTCUSDT Weekly UpdateBTCUSDT Weekly Update.
Bitcoin is currently trading around $70K after a sharp rejection from the recent highs near $100K.
Price has dropped back into the major weekly support zone ($68K–$72K)
This zone previously acted as resistance in 2021–2024 → now acting as flip support
Strong volatility after the breakdown from the rising structure
Weekly trend still bullish as long as support holds
Major Support: $68K – $72K
Next Support: $60K – $62K (critical demand zone)
Resistance: $80K → $92K → $100K
Bearish Scenario If weekly closes below $68K, BTC may revisit $60K or even deeper liquidity before recovery.
Bullish Scenario Strong reclaim + weekly close back above $75K–$78K could restart momentum toward $90K+ / $100K.
Market Structure Overall macro trend remains bullish, but short-term momentum is weak → possible consolidation / shakeout phase before the next big move.

BTC bounce time !BTC/USD
Following my recent bearish analysis , Bitcoin's price plummeted by $16,000, from $76,000 to $60,000 (-22% in just 3 days!).
What's next?
BTC has reached a very important S/R zone, which has acted as strong support for a long time.
I believe Bitcoin will take some time here forming a new range between $60k and $78k - $83k before continuing its decline again possibly into the $50k or $40k .

Intraday Long Setup on BTCUSD | 4% Upside PotentialBitcoin formed a sharp V-reversal from the 60K zone and is now moving inside a well-respected rising channel. We’ve got:
Higher highs
Higher lows
Clean bullish momentum
Break above short-term descending resistance
That shift from bearish pressure to structured bullish recovery is important.
🔵 Key Levels
Entry Zone: 66,300 – 67,000
Price is consolidating above this demand block after a breakout retest. This is healthy accumulation behavior.
Stop Loss: 66,399 (below structure + channel support)
If this level breaks cleanly, bullish structure weakens.
Target: 70,800 – 71,000
Measured move from the channel + previous resistance liquidity.
Projected move ≈ 4.3% upside.
🧠 Scenarios
✅ Bullish Continuation (Primary Bias)
Hold above 66,300
Minor consolidation
Break above 68K
Expansion toward 70.8K target
Momentum currently favors buyers.
⚠️ Bearish Risk
Strong rejection near 68K
Break below 66,300
Channel failure
Pullback toward 64K zone
🎯 Bias
Intraday bullish while above 66K structure.
The channel is clean, momentum is controlled, and buyers are defending support properly.

BTC next projected ATHBTC next projected ATH.
BTC probably should see bottom between 56-58k (0.618 fib retracement) as a bear bottom bear of this year. We should go in a parabolic move from here now to 190-194k (-0.618 fib extension).
Let's see

BTC Holding 64K Support – Bulls Eye 67KPrice is moving inside a rising channel, forming higher lows after that strong bounce from the bottom.
Momentum is steady, not explosive — this looks like controlled accumulation rather than breakout hype.
🟢 Bullish Scenario
Price holding above 64,000 – 64,100 support
Respecting channel midline
Gradual higher highs forming
As long as we stay above 64,026, bias remains bullish.
🎯 Target zone: 66,800 – 66,900
That aligns with:
Channel upper boundary
Marked resistance area
Liquidity above recent highs
If momentum increases near the top, breakout toward 67K+ becomes possible.
🔴 Bearish Risk
A clean breakdown below 64K would:
Break the higher-low structure
Push price toward lower channel support
Potentially revisit 62K–63K zone
Right now, sellers are weak — but rejection at 66.9K could create short-term pullback.
📌 Key Insight
This is a grind-up structure — not aggressive.
Best entries are usually pullbacks to support, not chasing near channel highs.
💡 Bias
Short-term: Bullish continuation while above 64K
Invalidation: Breakdown below 64K
Target: 66.9K

Bitcoin ShortBitcoin is looking to retest the 98200 support and if broken, would be headed to 76550-75000 area on this current weekly structure. Be careful guys.

Short Signal: BTC/USD (Bitcoin)Entry: Sell / Short now or around current levels ~67,000–68,000 (on confirmation of breakdown below key neckline/support ~70,000–73,000 zone after retracement bounce, or on rejection from 73,000–75,000 area for improved risk-reward).Rationale: Weekly chart displays a classic bearish Head and Shoulders pattern post-parabolic rally (peak near 120k–130k+ in late 2025), with left shoulder, higher head, right shoulder, and confirmed breakdown below the neckline (~80,000 gray zone earlier, now flipped). Recent retracement to 73,000–75,000 acted as a bearish retest before further downside. Fundamentals align: heavy institutional outflows from ETFs, macro risk-off (tech sell-off, geopolitical tensions), forced liquidations, and reversal from all-time highs signaling potential deep correction / "crypto winter" continuation. Momentum bearish with strong red weekly candles and measured move targeting lower. Targets: TP1: 60,000–65,000 (near-term support / 200-WMA zone, psychological)
TP2: 50,000–52,000 (classic H&S measured target from pattern height)
Extended: 25,000 (aggressive long-term crash scenario if cycle breaks fully)
Stop Loss: Above recent swing high / invalidation ~73,000–75,000 (or tighter above neckline retest for protection against fakeout bounce).Risk Management: Risk no more than 0.5–1% of account per trade. Use partial profits to trail stops. Monitor volume and macro news closely—volatility extreme.#Bitcoin #BTC #Bearish #HeadAndShoulders #CryptoCrash #ShortSignal #Trading #Investor #CryptoWinter #BTCUSDNot financial advice — This is purely for educational and entertainment purposes. Trading cryptocurrencies involves extreme risk of loss, including total capital wipeout. Markets are highly volatile and can move against patterns quickly due to news, manipulation, or sentiment shifts. Always conduct your own research (DYOR), use proper risk management, and never trade with funds you cannot afford to lose. Past patterns do not guarantee future results. Stay safe out there!
