You will ask, "how did he know Btc would crash to $60K"?On Saturday January 31st I suggested that Btc would crash (from current price at $78,716) to $60K (+/- $2K). This target at $60K (T2) was hit today.
I expect a significant bounce from here, as I often see when long term WTs are hit. There is another WT target just below at $52,683 (+/- $2K). This target may get hit on this dump, or possibly after a significant pump first. As always, I'm not trying to predict time, but these targets are accurate.
Congrats to everyone that set buy orders at T2, as Btc is already up 8% in the last hour, and we are safely under the trade with stops at break even. If T3 gets hit I'm going in even heavier.
May the trends be with you.
Btcupdate

2026 THE YEAR OF THE BEAR Some people say the 4 year cycle is over...
I disagree
As you can see my 4 year cycle is right on target with PRICE rising shortly after YEAR 1 begins
And PRICE dropping shortly after YEAR 4 begins
As you can see YEAR 4 is marked RED due to the fact that this is the BEAR market year
Now this is a LONG term chart as you can see the TIMEFRAME is WEEKLY
Sorry BULLS but if you have not taken PROFIT yet I highly advise you too
I have applied my FIB from previous cycle LOW to this recent cycle HIGH
With an 80% correction that would put us around 38.8k approximately
Lets check back towards the END of the year and see where PRICE is :)

My BTC Gameplan: How to Trade the Retest of This Big Supply ZoneThe macro narrative for BTC Bitcoin is currently under intense pressure as we navigate a significant "Risk-Off" shift across global markets 🏦. This week's carnage was largely fueled by a cooling AI sector and disappointing labor data, which sent a shockwave through speculative assets. Interestingly, general online sentiment has reached a point of extreme "capitulation" chatter, with retail consensus flipping heavily bearish as price breached the psychological $65k floor. This level of synchronized fear often signals a "liquidity hunt" is underway, where the market seeks to flush out late-stage shorts before finding a stable floor.
We are seeing a clear Bearish Market Structure on the 30m chart 📉. The price has been respecting a steep descending Parallel Channel, characterized by aggressive sell-offs followed by shallow "bear flag" consolidations. While widespread community chatter is calling for a "death spiral" toward $50k, the technicals show we are approaching the $60,079.58 level, which represents the 0.00% Fibonacci extension of the recent leg. This suggests the immediate downside momentum might be overextended, setting the stage for a relief rally toward the supply zones above.
Key Zone: The primary area of interest is the confluence between the upper boundary of the Parallel Channel and the Fibonacci 51.8% to 61.8% Retracement zone (approximately $71,457 to $71,878).
We are currently trading at the bottom of the current impulse range, just under the $61k mark. I am watching for a "run on liquidity" to sweep the late sellers who are piling into shorts at the bottom of the channel 🧹. My view is that the market will likely bounce to retest the VWAP and the 50% Fibonacci level near $69,471 before the next major decision point.

BTC planDidn't expect my BTC plan to hit this quickly. Still some room for downside, will dca some alts from this point. Spot only

$BTC Short UpdateShort I predicted played out well hitting all targets to the T.
this last target we are currently at if we lose this opens up a huge sell off!

#URGENT BITCOIN UPDATE! Don't Miss the Bottom!!CRYPTOCAP:BTC has entered a very important level. It has been a severe correction.
To keep it simple, the only meaningful support left in this entire move is around $58K.
If price breaks below that level, the downside could be aggressive, with BTC likely moving into the $43,850 – $47,712 range, which aligns with the weekly Fair Value Gap.
The current candle closes in 3 days.
From a technical perspective, price is approaching a potential short-term reversal in LTF. This is not optimism; it is what the chart is showing.
DYOR | NFA
Please hit the like button and share your views in the comments.
Thank you
#PEACE

BTC — Market Is Still in Free FallHello traders,
Since the 0.382 rejection, Bitcoin has been free falling. Every so-called “support” has failed to act like one
Right now, the only thing keeping BTC from accelerating lower is the support below current price. If — and only if — that level holds:
1️⃣ Short-term push up to close the CME gap
2️⃣ One more relief rally / bull trap to give false hope
3️⃣ Final rejection → continuation lower into the $40k–$50k macro demand zone
That would align perfectly with market behavior in prolonged bear phases:
Compression → Relief → Distribution → Capitulation.
Most people don’t want to hear this, but this structure suggests 2026 is shaping up to be a full bear market year
There will be lots of accumulations and manipulations movements, but nothing major
A meaningful recovery likely doesn’t start until early 2027
Manage your risk, and avoid believing in narratives
Good Luck!

Bitcoin Sell Zone: 75,500–76,000 Downtrend + FVGEntry: Sell/short on confirmation around 75,500–76,000 zone (Selling Area FVG + 0.78 Fib) – wait for bearish candle rejection or failed breakout attempt
Target 1: 74,500–74,689 (next support / prior BOS level, initial downside)
Target 2: 73,000–72,790 (extension to lower BOS / blue curve projection low)
Stop Loss: Above zone high / invalidation ~76,500–77,000 (above CHOCH/resistance flip) to protect if bullish reversal occurs
Rationale: Downtrend continuation favored on 15M with price rejecting higher into the Selling Area (FVG confluence + 0.78 Fib retracement acting as strong resistance). Bearish structure from recent BOS/CHOCH breaks supports shorts if confirmation hits. Watch for volume on downside or bearish patterns for conviction — potential leg lower in the ongoing correction.
Bitcoin looking heavy in the zone — patience for that confirmation could set up a nice short! ₿ #Bitcoin #BTCUSD #ShortBitcoin #CryptoTrading #BearishSetup #FVG #Fibonacci #TradingSignal #Downtrend #CryptoInvestor #Investor #Investing #Crypto Not financial advice — Trading cryptocurrencies involves very high risk of loss due to extreme volatility. Always do your own research, wait for your personal confirmation, use strict risk management (e.g., risk <1-2% per trade), and consider broader market factors (macro, sentiment, news). This is for educational/entertainment purposes only. Trade responsibly!

BTCUSD (1H) – Bearish Continuation | Trendline Breakdown IdeaMarket Structure
Bitcoin remains in a clear descending channel on the 1H timeframe. Price has consistently respected the downward sloping trendline, confirming a strong bearish structure with lower highs and lower lows.
Technical Confluence
Trendline Resistance (Red): Multiple rejections validate seller dominance.
Auto Pitchfork: Price is trading below the median line, indicating continuation toward the lower parallel.
Dynamic Support (Green): The recent breakdown below channel support signals bearish continuation rather than a reversal.
Balance of Power (BoP): Reading around -0.38 reflects sustained selling pressure with no bullish divergence.
Price Action
A brief consolidation failed to hold, followed by a strong bearish impulse that broke key intraday support. The current move suggests momentum-driven continuation, not exhaustion.
Trade Idea
Bias: Bearish
Sell Zone: Pullback toward broken support / descending trendline
Targets:
First target: Previous minor low
Extended target: Lower pitchfork boundary / demand zone
Invalidation: Sustained close above the descending trendline
Conclusion
As long as BTC remains below the descending trendline and pitchfork median, the path of least resistance is downward. Any retracement into resistance is likely to be a selling opportunity unless market structure shifts.
Always manage risk and wait for confirmation.

BTCUSD 15M – Bearish Continuation After PullbackMarket Structure
Market is in a clear bearish trend
Series of lower highs & lower lows
Strong impulsive sell-off → confirms seller dominance
No bullish break of structure yet
🟥 Supply / Resistance Zone
Key supply zone: 67,600 – 68,600
This area aligns with:
Previous support → flipped resistance
Pullback after impulsive drop
Expect selling pressure on retests
📉 Trade Idea (Intraday Short)
Entry zone: 67,600 – 68,200
Stop-loss: Above 68,600
Target: 65,400 – 65,200
Risk–Reward: Favorable for continuation trades
📌 Price is expected to consolidate briefly, then continue lower.
⚠️ Invalidation
Strong 15M close above 68,800
Bullish momentum with high volume → bearish bias invalid
🧠 Conclusion
This is a trend-following short setup, not a reversal.
Best suited for:
Intraday traders
Momentum & structure-based strategies

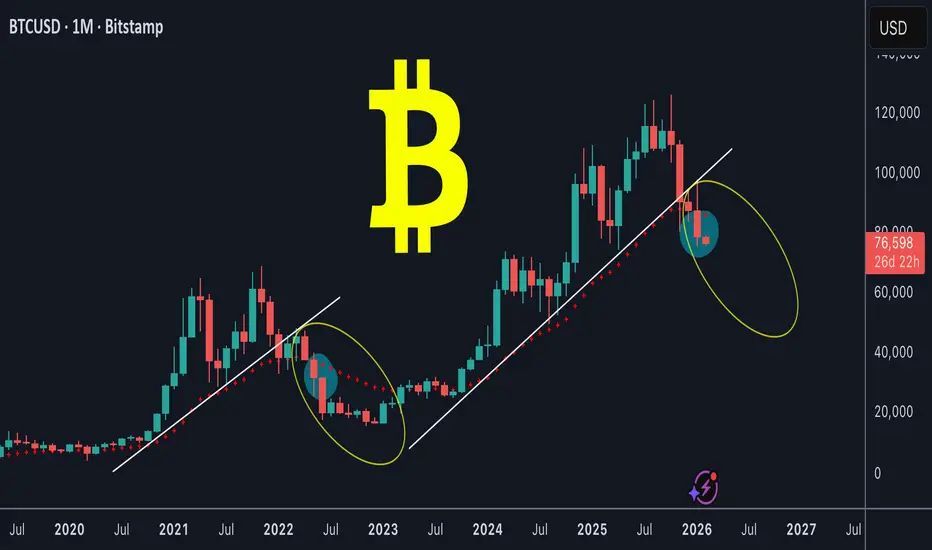
BTC monthly chart is bearishBTC / USD
I've been bearish on Bitcoin for the past 4 months (previous posts are attached below), and today we're seeing the price of Bitcoin continue to decline.
What is the current situation for Bitcoin (monthly chart)?
In short, Bitcoin has broken its upward trendline (white), as well as a very important EMA on the monthly chart (dashed red).
The current situation resembles the end of the bull market at 2022, and you can anticipate what will happen next by looking at my chart
Conclusion:
The current view on HTF is pure bearish
BTC Market Alert: Bearish Below 71.8K | The Path to $60,000📅 Date: February 5, 2026
The Pivot Point: $71,865
The $71,865 level is currently the decisive zone for Bitcoin's next major move.
📉 Bearish Scenario (Main Outlook)
As long as Bitcoin trades below the $71,865 pivot, the selling pressure remains dominant. We anticipate further declines toward:
Target 1: $66,400
Target 2: $60,000 (Major Psychological Support)
📈 Bullish Scenario (Corrective Move)
Any movement above $71,865 is considered a temporary technical recovery (correction). For a trend reversal, the price must stabilize above this level to target:
Resistance 1: $78,690
Resistance 2: $85,425
📰 Fundamental Drivers & Why is BTC Dropping?
Miner Capitulation: With BTC dropping below $71,000, many mining companies are now operating at a loss. The average production cost has risen to nearly $87,000, forcing miners to sell their holdings to cover operational costs, adding massive sell pressure to the market.
Macroeconomic Pressure: A strengthening U.S. Dollar and hawkish signals from the Federal Reserve are pushing investors away from "risk-on" assets like crypto and into safer havens.
Massive Liquidations: Over $775 million in long positions were liquidated in the last 24 hours. These forced liquidations create a "snowball effect," accelerating the downward move.
Extreme Fear: The Fear & Greed Index has plummeted to 12 (Extreme Fear). Historically, this indicates a period of high panic among retail investors.
🔍 Summary
Bitcoin is in a high-risk zone. The $71,865 level is the key to any potential recovery. Until then, the path of least resistance is to the downside. Trade with caution and manage your risks.

BTCUSDT Forming Bullish MomentumBTCUSDT is forming a clear bullish momentum pattern, a classic bullish reversal signal that often indicates an upcoming breakout. The price has been consolidating within a narrowing range, suggesting that selling pressure is weakening while buyers are beginning to regain control. With consistent volume confirming accumulation at lower levels, the setup hints at a potential bullish breakout soon. The projected move could lead to an impressive gain of around 70% to 75% once the price breaks above the wedge resistance.
This bullish momentum pattern is typically seen at the end of downtrends or corrective phases, and it represents a potential shift in market sentiment from bearish to bullish. Traders closely watching BTCUSDT are noting the strengthening momentum as it nears a breakout zone. The good trading volume adds confidence to this pattern, showing that market participants are positioning early in anticipation of a reversal.
Investors’ growing interest in BTCUSDT reflects rising confidence in Bitcoin’s long-term fundamentals and current technical strength. If the breakout confirms with sustained volume, this could mark the start of a fresh bullish leg. Traders might find this a valuable setup for medium-term gains, especially as the pattern completes and buying momentum accelerates.
✅ Show your support by hitting the like button and
✅ Leaving a comment below! (What is your opinion about this Coin?)
Your feedback and engagement keep me inspired to share more insightful market analysis with you!

BTCUSD 15M – Supply Rejection After Pullback | Bearish ContinuatOverall structure is bearish (clear sequence of lower highs & lower lows).
The recent upside move is only a corrective pullback, not a trend reversal.
Price remains below key resistance zones, keeping sellers in control.
🧠 Key Concept (Marked Zones)
Minor Pullback Resistance (≈ 72,500 – 72,800):
Price reacted perfectly here → classic sell-the-rally zone.
Supply Zone (≈ 73,700 – 74,800):
Strong rejection expected if price reaches this area.
The impulsive drop from resistance confirms active supply.
📍 Key Levels
Resistance:
72,800 (intraday rejection)
73,700 – 74,800 (major supply)
Current Price: ~70,800
Downside Target:
70,300 (first target) 🎯
69,600 – 69,200 (liquidity zone / extended target)
📈 Trade Bias
Bias: Bearish continuation
Preferred Setup:
Sell on pullbacks into resistance
Or continuation sell below 70,300 after confirmation
Invalidation: Clean 15M close above 72,800
⚠️ What to Watch
If price fails to break 70,300, expect a short-term range.
Strong bullish acceptance above 72,800 would weaken the bearish idea.
🧾 Summary
Downtrend intact + pullback into supply + sharp rejection
➜ High-probability bearish continuation scenario

BitcoinBTCUSD
- Bearish Channel as an corrective pattern in Short Time Frame
- Fair Value Gap
- Order Block
- Support Level
- RSI - Divergence

Bitcoin BTC Hits Major Support: Why I Am Not Selling YetIs the Bitcoin sell-off going to grind to a halt? Or are we just catching our breath before the next leg down? In this session, we break down the aggressive price action that has pushed BTC into a high-confluence support zone and why patience is your most profitable tool right now. 📉
As we approach the weekly close, the market structure remains bearish, but entering a short at these lows carries significant expansion risk. I am walking you through my technical bias, explaining why I’m avoiding "chasing the move" and instead waiting for a high-probability pullback into the 61.8% Fibonacci retracement level.
What we cover in today’s analysis:
Market Structure: Identifying the recent impulse leg and key support levels.
Fibonacci Confluence: Why the 61.8 zone is the "Golden Mean" for this short setup.
Risk Management: Why the end-of-week liquidity makes new entries dangerous.
Execution Strategy: The specific price action confirmations I need to see before clicking sell. 📊
Whether you are a swing trader or a scalper, understanding this higher-timeframe context is vital for protecting your capital. Stay disciplined and wait for the setup to come to you. 🔥
RISK DISCLAIMER: Trading foreign exchange, cryptocurrencies, and indices on margin carries a high level of risk and may not be suitable for all investors. The content in this video is for educational purposes only and does not constitute financial advice. Past performance is not indicative of future results.

BTC : (Scalp Trade 71K+)Bitcoin giving a nice long wick with a rejection (showing and indicating) to us that there’s some present buying pressure within it and could give us a nice cool reversal towards the upside before continuing its downward trend, Prices to enter at (71 000) to (73 000) remember this is a scalp trade and always remember not to marry your positions when in profits (Trial Stop) and take partials

BTCUSD 15M – Bearish Continuation From ResistanceMarket Structure
Strong sell-off followed by weak consolidation
Price rejected from resistance / supply zone
No bullish displacement → sellers still in control
📐 Key Levels
Sell Zone / Entry: 75,400 – 75,500 (previous support → resistance)
Stop Loss: Above 76,550 – 76,580 (structure invalidation)
Target: 73,150 – 73,100 (liquidity + demand zone)
🧠 Trade Expectation
Possible pullback toward resistance for sell confirmation
Rejection from entry zone favors bearish continuation
Increased volatility expected after rejection
⚠️ Invalidation
Strong 15M close above 76,580 would invalidate the bearish setup and shift bias to neutral/bullish.

#BTC/USDT Let Bitcoin make a new ATH#BTC
The price is moving within a descending channel on the hourly timeframe. It has reached the lower boundary and is heading towards a breakout, with a retest of the upper boundary expected.
The Relative Strength Index (RSI) is showing a downward trend, approaching the lower boundary, and an upward bounce is anticipated.
There is a key support zone in green at 75,000, and the price has bounced from this level several times. Another bounce is expected.
The RSI is showing a trend towards consolidation above the 100-period moving average, which we are approaching, supporting the upward move.
Entry Price: 76,811
First Target: 77,949
Second Target: 79,330
Third Target: 81,102
Stop Loss: Below the green support zone.
Remember this simple thing: Money management.
For any questions, please leave a comment.
Thank you.

BTCUSD Bearish Continuation | Sell the PullbackMarket Structure
Overall bearish bias remains intact.
Price is respecting a descending trendline from previous highs.
Structure shows lower highs + lower lows, confirming sellers are still in control.
Pattern in Play
Price is moving inside a bearish descending channel.
Current move looks like a pullback toward resistance, not a trend reversal.
The red zig-zag you marked = distribution / rejection zone (very good read).
Key Levels
Resistance Zone (Sell Area):
77,121 – 79,959
Confluence of:
Channel top
Prior support turned resistance
Trendline resistance
Entry Zone:
Around 76,800 – 77,200
Best entries come after bearish confirmation (rejection candle / engulfing).
Downside Target:
72,377
Matches:
Channel low
Measured move (~-5.9%)
Liquidity sweep zone
Trade Idea Logic
📉 Sell the pullback, not the breakdown.
Wait for rejection at resistance, then continuation to the downside.
Risk–reward structure is favorable as drawn.
Invalidation
A strong H1 close above 80,000 would weaken the bearish setup.
Until then → trend-following shorts preferred.
Overall Bias
Bearish continuation ⬇️
Pullbacks = selling opportunities.

Bitcoin Feb, 2026The information and publications are not meant to be, and do not constitute, financial, investment, trading, or other types of advice or recommendations.

The King is resting its eyesLet us start with the elephant in the room. Bitcoin has been hovering around the $75,000 mark like it is waiting for a bus that is running late. Looking at the weekly timeframe, CRYPTOCAP:BTC is painting a classic consolidation picture.
It pushed up aggressively, took a breather, and is now sitting comfortably above the $70,000 support level. BINANCE:BTCUSDT
This is actually healthy behavior. In the crypto world, we often forget that prices cannot just go up in a straight line forever without blowing up. This sideways movement allows the market to cool off and build a base for the next move.
Think of it as a sprinter catching their breath before the final 100 meters. As long as we hold above that blue support zone around $70,000, the structure remains incredibly bullish.
The Crypto Fire

Eliana | BTCUSD – 15M – Post Liquidity Sweep RecoveryBITSTAMP:BTCUSD BITSTAMP:BTCUSD
After consolidating inside a range, BTC experienced an aggressive downside expansion that cleared weak lows. Buyers stepped in immediately at higher-timeframe demand, resulting in a sharp bounce. Current price action shows stabilization and compression, indicating the market is preparing for the next directional move.
Key Scenarios
✅ Bullish Case 🚀 →
Sustained holding above 75,200–75,400 support can fuel continuation toward range equilibrium and highs.
🎯 Target 1: 76,800 – 77,000
🎯 Target 2: 78,400 – 78,800
❌ Bearish Case 📉 →
Failure to hold 75,200 exposes price to another liquidity run lower.
🎯 Downside Target 1: 74,400
🎯 Downside Target 2: 73,000 (Major Demand Zone)
Current Levels to Watch
Resistance 🔴: 76,800 / 78,400 – 78,800
Support 🟢: 75,200 / 74,400 / 73,000
⚠️ Disclaimer: This analysis is for educational purposes only. It is not financial advice.
