BTC 4H CHART ROUTE MAPDear Traders,
BTC has shown strong gains this week and has confirmed a short-term bullish trend across multiple confluences.
Wait for the price to pull back to the entry zone around IFVG & BPR area close to $89K–$91K before looking for TP1, TP2, and TP3, with your stop-loss set at $83,500.
Always trade with proper risk and money management.
The Quantum Trading Mastery
Btcusdbullish

You will ask yourself "How did he know btc would crash to 80K"?Followers of my charts know that "strangely accurate" calls have been made throughout Btc's recent 3 months worth of price action. I anticipated the previous low at $107K and since September I have repeatedly expressed concerns about a dump to a lower low (see Sept-Oct Btc charts). In September, the "3 Red Week Down Rule" warned us that this lower low was coming (T1).
Once 107K was broken, I cautioned that if the next level down didn't hold (96K-103K), that Btc would go straight to 80K-85K. On Oct 23rd I wrote:
"Btc bounce incoming off support? If not, and support is broken... long way down to 84K.
Too soon for concern, but Btc is currently bottom feeding off my lowest support".
I later offered confluence with a confirmed WT at 84K,200, which confirmed (for me), a big bounce from this 80K-ish zone.
So far my bottom "ALL IN" zone held (T2- 80K-84K).
Btc is currently 92K -up 16%, since bouncing off my buy zone.
I don't point this out for my ego. This is confirmation to all the non-believers...TA works! Also, I keep my own win rate stats, as should everyone. I'm transparent about my trades and my win rates. How else would anyone know if they should follower an "influencer" if they don't have published charts (where you can keep track of their stats).
Once again, congrats to all that have made gains while following my charts.
"May the trends be with you"

BTC Trade Secured 2.4%Price broke structure to the upside on the 4h, came down to sweep SSL to then buy up to BSL. The next move will want to wait for a pull back to then continue towards 93k

BTC Trade Set Up Nov 24 2025Price has shifted to bullish structure making HH/HL on the 1h and engulfed a 4h bearish candle so i am looking to hold buys up to higher BSL levels to be swept

BITCOIN BIG HIGH BUY PROBABILITY SETUP SOON!!!🚨 BITCOIN HIGH PROBABILITY BUY SETUP 🚨
* Here We Can See Clearly The Next Potential Moves For BTCUSD Coming Hours/Days.
* Keep Your Eyes Close On Your Trading Positions.
* Happy PIP Hunting Traders.
FXKILLA.

Btc - This is what may happen nextJust a Btc thought experiment. It's good to anticipate price action so you know if and when we need to invalidate our trading idea.
Those that follow, may remember I sold all my crypto (at the top), when I was repeatedly saying the crypto market will soon have a lower low...because of the "3 Red Week Down Rule".
Now that Btc hit the lower low, I believe Btc is in for a bounce soon. Maybe Btc bounces now, and then lower to $84K. Or maybe one last flash down to $84K now. Idk, my cystal ball is still in the shop.
Either way, I believe Btc (and some alts) have or are the process of bottoming, and preparing for a bounce.
Btw I have been waiting for this $84K Btc "WT" target for months. Going back into the market in this region is a good idea (with proper risk management). Although to be honest, I have shifted my attention to stocks in recent weeks as you may have noticed. Recent price action in the crypto market, should explain why I stopped following it. But now it's time to pay attention, that Btc's recent low was within 5% of my $84K target.
May the trends be with you

Btc - NEXT LOW TARGET- My All in targetOn Oct 23rd I suggested that if Btc broke below $96K, it would drop to $84K. $96 just broke 4 days ago, and Btc already hit $89K. For those that were in doubt...$84K is starting to look pretty reasonable now.
Btw $84,200 is a WT target and I usually go in heavy on those. If the pattern holds true to form, then I anticipate a big bounce from around $84K, back up to at least $99K.
May the trends be with you

Bitcoin Poised for Recovery After Support Rebound Eyes on $105kBitcoin (BTC/USDT) on the 1H chart has bounced from the $99,500 support zone after breaking a short-term ascending trendline. The Ichimoku Cloud signals possible resistance near $102,400, with a bullish target set around $105,000–$107,500 if momentum continues. A clear breakout above $102K could confirm a short-term trend reversal toward higher highs.
🔍 BTC/USDT (1H) Technical Analysis — Key Points
1. Trend Structure:
Bitcoin broke below its ascending trendline from Nov 7–12, signaling short-term weakness.
The current move is a retest of the broken trendline, acting as new resistance.
2. Ichimoku Cloud:
Price is trading below the cloud, indicating a bearish short-term sentiment.
Kijun (baseline) near $102,400 is the immediate resistance level.
Future Cloud (Senkou Span A/B) shows potential flattening — early sign of possible reversal if price re-enters.
3. Support & Resistance Levels:
Major Support: $99,500 – $97,500 zone (buyers stepped in here).
Immediate Resistance: $101,700 – $102,400 zone.
Next Target Zone: $105,000 – $107,500 if breakout confirms.
4. Volume & Momentum:
Weak bearish momentum after the sell-off — potential for a relief rally.
A bullish confirmation needs strong candle close above $102,500 with volume.
5. Short-Term Outlook:
If Bitcoin stays above $99,500, bulls may push to reclaim $102K.
Failure to break above could lead to further downside toward $97,500.

Bitcoin Daily Analysis #12 — November 10, 2025
Bitcoin has triggered our entry setup 🔔
As I mentioned before, fear during FOMO candles means nothing — what truly matters is structure and confirmation.
It seems that Bitcoin has found support around the $100,000 zone and could be starting a new bullish leg 🚀
Any higher low above $104,000 will serve as a confirmation of an uptrend ✅
Disclaimer:
This content is for informational purposes only and does not constitute financial or investment advice. © DIBAPRISM
Larry D.Kohn

BTC Is Warming Up for Its Next Big Move — Don’t Miss This Setup Few thoughts about BTC:
when you trade crypto you have to look at 4h+ time frame, daily or weekly is the best to see clean picture.
Right now BTC just touched discount( 100359)
now i can see 3 possible scenarios
1 - small pull back next week and then pump 130-140k first target
2 - price will go a bit deeper to fill weekly FVG at ~90k
3 - CRYPTO SCAM AND WE ARE ALL DOOMED😱😱😱
until we didnt see BTC break below 70k , i am still bullish on crypto and buying some coins on spot for my portfolio, i am not heavy in crypto but 200-300$ a week is nice investment with potential x10-20 return is nice option

Bitcoin Daily Analysis – October 30, 2025🚀 Welcome to another Bitcoin analysis!
Yesterday, the interest rate was cut by one step, just as everyone expected — and that’s definitely a positive signal for Bitcoin. 💪💰
But why did we see a drop? 📉
The world is still anxious about the U.S.–China tariff situation, and those concerns intensified after Powell’s comments, suggesting the December rate cut isn’t guaranteed.
Right now, the market is in a fear phase 😨 — meaning both good and bad news can move prices sharply.
Stay calm and patient, and don’t let the candles scare you. 🕯️🧘♂️
Overall, conditions still favor a bullish continuation, and unless major negative news comes from the U.S. or China, we could soon start the final leg of this uptrend. 📈🔥
The $106,000–$102,000 zone is showing strong demand, making it a potential entry area — but always manage your risk and capital wisely. ⚖️
Remember: every decision in this part of the market should follow your predefined scenario — never trade emotionally or react impulsively. 🧠💼
Disclaimer:
This content is for informational purposes only and does not constitute financial or investment advice. © DIBAPRISM
Larry D.Kohn

BTC/USD: Wave 5 Launch or Wave Cycle End?BTC/USD: Wave 5 Launch or Wave Cycle End?
📈 Weekly Scenarios
Bullish scenario: Price holds above ~$110,000, breaks through ~$120,000 → wave (5) strengthens → possible rise to ~$135,000-140,000.
Consolidation: Price trades between ~$110,000 and ~$120,000 without a formed structure, the market is paused.
Bearish scenario: Break of support at ~$110,000 with volume → corrective wave A-B-C → possible decline to ~$100,000-105,000.
✅ Conclusion
On the weekly timeframe, BTC/USD is at a key turning point: either an upward impulse (wave (5)) or the beginning of a major correction.
Holding support at ~$110,000 is the basis for a bullish scenario.
A breakout of resistance at ~$120,000 is a signal for continued growth.
A breakout below ~$110,000 is a signal for a change in structure.

Bitcoin Analysis - Bulls vs ResistanceBitcoin triggers have been activated just as expected. Personally, I don’t think it’s a bad idea to hold current positions — we’ve got some solid entry points already.
📈 Bitcoin is showing a bullish trend, and as we approach the upcoming interest rate decision, momentum could build even more.
Above the $116,000 zone, we could see a long trigger, but personally, since I already have two open entries from lower levels, I won’t be adding new ones for now.
💡 If the interest rate is lowered, there’s a chance we’ll see a few red candles initially, but overall, it should be positive for the crypto market.
Right now, Bitcoin is facing a key resistance zone — breaking above it could confirm a bullish continuation on higher timeframes. 🚀
Disclaimer:
This content is for informational purposes only and does not constitute financial or investment advice. © DIBAPRISM
Larry D.Kohn

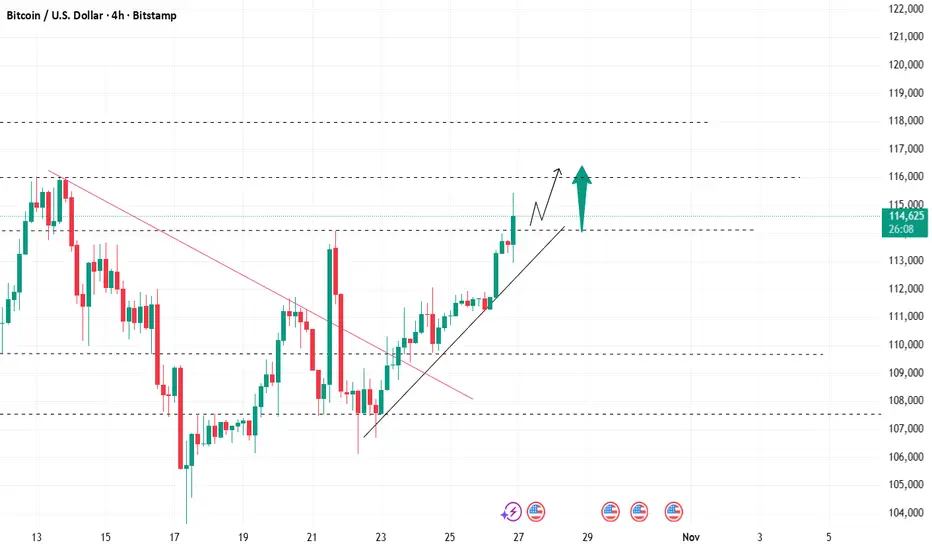
BTC breaks through resistance, go long at low levelAfter the weekend break, we’ve entered the final week of October. Bitcoin maintained its strong performance over the weekend, and the current price has rebounded to the 115.4K level again, setting a bullish tone for the new week’s market.
From the daily timeframe perspective, the market’s bullish momentum continues to unfold: the candlesticks show a steady upward trend with consecutive bullish candles, indicating strong continuity of the bullish trend. Since the rebound from the previous low, the price has risen in a stepped manner and has successfully broken through the resistance of the Bollinger Bands’ middle band in the short term, presenting a clear upward trend on the technical side.
Going forward, we need to focus on the breakout of the 120K key resistance zone. If this level is effectively held, the price is expected to refresh the recent high again based on the long-term trend analysis. As the upward trend remains intact, we can continue to adhere to the core strategy of "buying on dips" for our operations.
Considering the market rhythm on Monday morning, here’s a specific trading suggestion: for BTC, we can establish long positions within the range of 114K-113.5K, with the target looking at the 116K-118K level. After entering the position, we can set a stop-loss below the lower edge of the entry range to cope with short-term fluctuation risks.
Will Btc bounce off this support?Btc bounce incoming off support? If not, and support is broken... long way down to 85K.
Too soon for concern, but Btc is currently bottom feeding off my lowest support.
Followers of my charts would Know that "strangely accurate" calls have been made throughout Btc's recent months worth of price action. I anticipated this recent low and expressed my concens about this dump to a lower low. But I wish I knew how low and how long Btc stays in this lower range.
What I do know is that the "3 Red Week Down Rule" warned us that this lower low was coming. So now is a way better time to concider this asset, than at the recent top!
-Good luck

Btc is STILL following this Eth fractalIf Btc continues to follow this Eth fractal, one might anticipate a Btc bottom no less than 102K.
What are your thoughts?
May the trends be with you.

You will ask yourself "how did he know Btc would crash to 103K"?On Sept 23rd I suggested if Btc continues to follow this Eth fractal it would soon bottom at 102K (see chart below). Btc just crashed to 103K on Friday.
Fractals can act as maps for future price action. But they often deviate from the "expectation" at the worst time. I will follow this fractal until it stops working. Hope it has guided you well.
Between this Eth fractal (posted a month ago) and the "3 red week down rule" charts that I have been posting...it's safe to say we seen this week's (historic) dump coming . TA works!
I say this not to brag, but show the disbelievers that TA works (I encourage you to learn). And Also I keep track of my stats on my calls, to track my win ratios. You should too, how else would you know if it's worth following someone's predicitons.
May the trends to be with you.

You will ask yourself "how did he know Btc would do that?On Aug 9th I suggested that Btc could dump as low as 107,800. The actual low came within a small margin of that.
On Sept 2nd I suggested that the bottom was in and Btc would soon bounce to 1 of my 3 targets.
On Sept 11th, I also suggested that a lower low was probable (below 107K).
On Sept 17th, the top of the run was called and we saw the anticipated reversal.
I also anticipated the day (time frame), the reversal would occur.
TA works for both the X and Y axis (for both price and time).
I wrote "the bounce was coming to an end within 5 days". On day 6 Btc fell.
I honestly thought Btc would form it's lower low when I published the above charts. But instead we got that low probability pattern of a liquidity grab above the local high...THEN swipe the lows, to form a lower low afterwards. This pattern liquidated all the longs and the shorts, in what tunred out to be the biggest liquidation event in crypto history.
Either way, we got the anticipated lower low and we were spared a catastrophic dump..allowing us to be on the right side of the trade. It's safe to say this was not a surprise, but anticipated and therefore we profited.
TA works! Thank you "3 Red Week Down Rule". lol
Btw I have been suggesting (for weeks), that Btc would hit a lower low, based on the "3 Red Week Down Rule". While everyone on social media is blaming Friday's announcement on China tariffs, for cuasing this lower low.
'Show me the chart and I'll tell you the news"
-Bernard Baruch
Pattern's can be predictive! Learn them all.

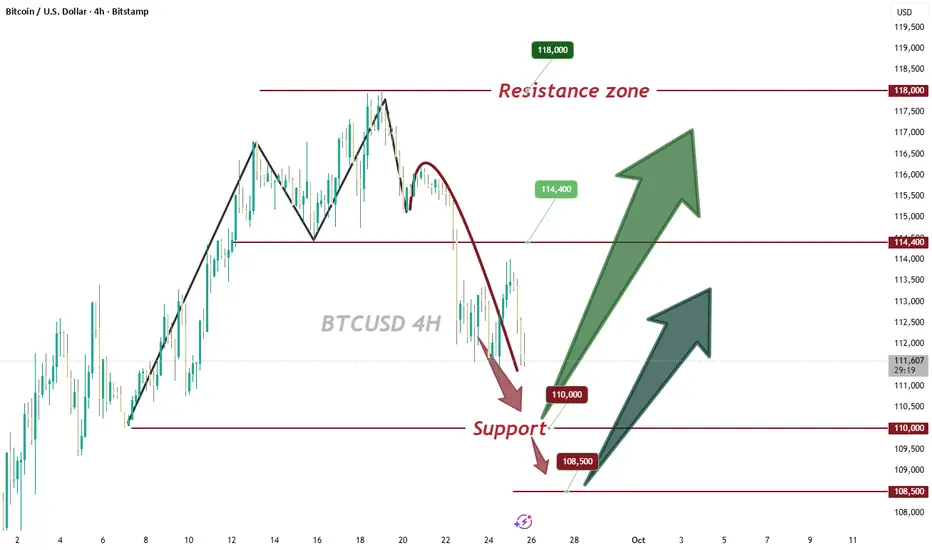
Bitcoin → Overall weak, focus on 113K supportBitcoin is currently trading at 114.2K. The market has now shown a clear downward trend. From a technical perspective, the bearish engulfing pattern appearing on the daily timeframe has formed a strong resonance with the bearish arrangement of the moving average system. This signal further confirms the market's bearish bias, and short-term rebound momentum is significantly insufficient.
In terms of the performance of key levels, although there is strong buying support at the 113K level on the daily timeframe, the current price is still suppressed by the short-term trend, and the effectiveness of this support level needs continuous observation. On the hourly timeframe, after forming a local high near 116K, the price entered a downward channel and is currently in a consolidation phase. No clear signal of stopping the decline has emerged yet, and the overall trend remains relatively weak.
Resistance Levels: 116K, 118
KSupport Levels: 113K, 109.6K
For detailed trading decisions, please follow my live updates. I publish my trading ideas and strategies daily. If you lack a plan or clear direction in cryptocurrency and are struggling to achieve consistent and stable profits, you can refer to and follow my updates as a reference and guide to help you avoid mistakes.

Is Btc STILL following this Eth Fractal? On Sept 9th I suggested Btc was following this Eth Fractal.
On Sept 12th I expressed concern for a lower low, and Btc seems to be heading lower now.
If Btc (on the 1 Day) is following this Eth (4 hr) fractal, then Btc may soon see a lower low (below 107). Alts may bleed harder.
I hope I'm wrong. But I am cautious for several reason, as also indicated in my other previously published charts.

Btc - Lower low incoming?Based on the "3 red week down rule" a lower low is expected (with high probability).
He's a simplified chart of what I am expecting in the short term.
May the trends be with you.

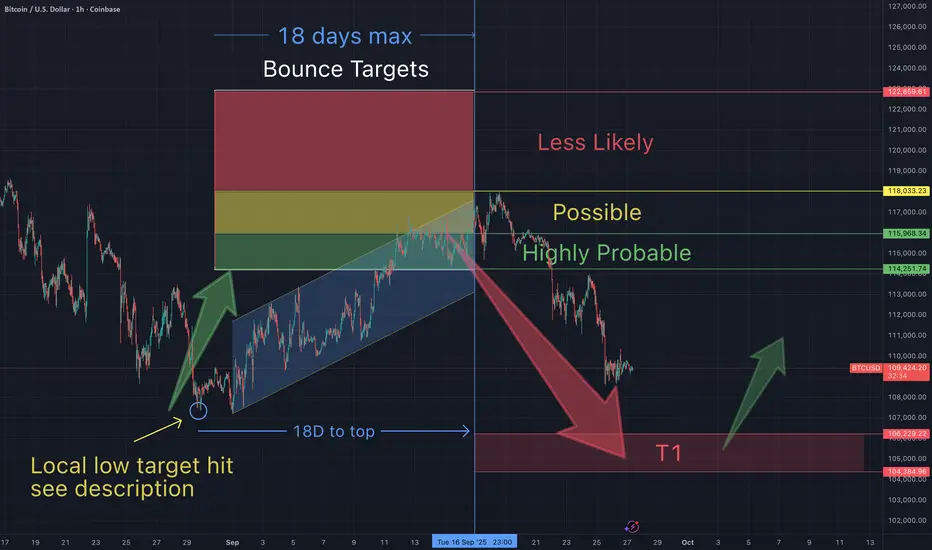
You will ask yourself, "how did he know Btc would do that"?On Aug 9th, I suggested Btc would bottom as low as 107,700, before a bounce.
On Sept 9th I suggested Btc had bottomed at my target, and would bounce to between $114K-118K (within 18 days)...the form a lower low. Day 19 began this current retrace.
Each of these predictions have come true with the exception of the lower low (below $107K). So congratulations to everyone who have been making gains based on my everything I have been charting.
The question remains, will the "3 red week down rule" and my statistical analysis of it's historical price action continue to play out? So far it looks that way. If so, there's another bounce incoming at my red T1.
PS I don't point out my accuracy to brag, but moreso I want to accomplish 2 things.
1-Prove that TA works - for all those non believers (and I encourage you to learn).
2-Keep track of my accuracy stats (and so should you...how else would we know who we should follow).
Supported at 110,000–111,000, we stay bullishAnother successful long entry 🚀! As we have repeatedly stated before, as long as BTC does not break below the 110000–111000 support range 🛡️, we will still maintain a bullish outlook 🐂
Buy @111000
TP 112000 - 11300 -113500
Accurate signals are updated every day 📈 If you encounter any problems during trading, these signals can serve as your reliable guide 🧭 Feel free to refer to them! I sincerely hope they'll be of great help to you 🌟 👇