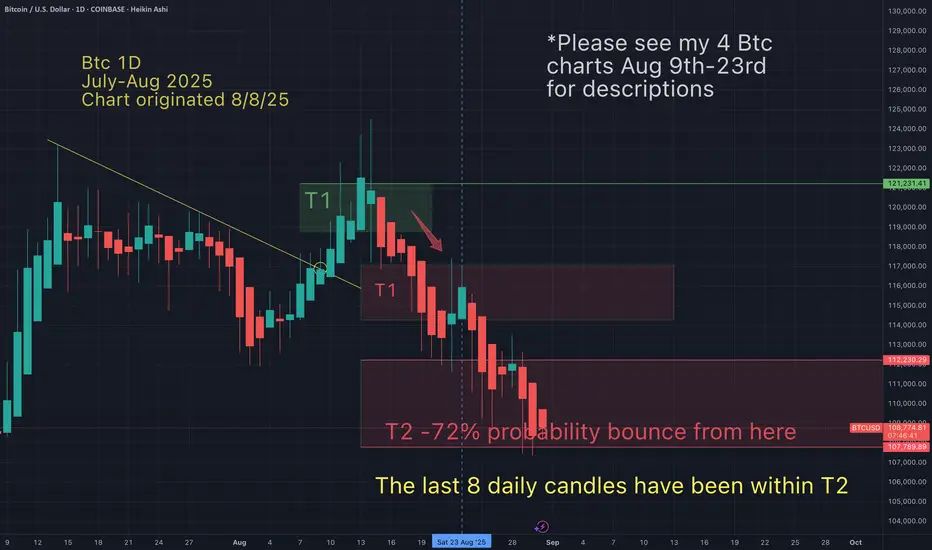
Btc price action unfolds exactly as anticipated-Bounce incoming?On Aug 9th I suggested the following:
As of today Btc has been bottoming at my T2 after following the anticipated price action suggested in the above chart. TA works!
May the trends be with you.
Btcusdbullish
Bitcoin Bounce Loading | Long @ 110k → 115k+
# 🚀 BTC Mean-Reversion Play | Long @ 110.35k | Targeting 115k+ 🎯🔥
### 📊 Market Bias
* **Short-term**: Tactical LONG (bounce from lower BB near 110k)
* **Medium-term**: Neutral → Bearish (below EMAs); Bullish only vs SMA200 (\~101k)
* **Actionable Bias**: Scalp/Swing long → flip bearish if <109k
---
### 💡 Trade Setup
* 🎯 **Instrument**: BTC
* 📈 **Direction**: LONG (mean-reversion scalp)
* 💵 **Entry**: Limit 110,350 (stagger optional: 110,500 / 110,150 / 110,000)
* 🛑 **Stop**: 109,300 (below lower BB + liquidity buffer)
* 🎯 **Targets**:
• T1 = 114,976 (EMA21, 40%)
• T2 = 116,499 (30%)
• T3 = 122,528 (30%)
* ⚖️ **RR**: \~4.4:1 to T1
* 📊 **Size**: Risk 1% equity | ≤3x leverage
* 💪 **Confidence**: 60%
---
### ⚡ Rationale & Risks
✅ Sitting on lower Bollinger Band + SMA200 = strong mean-reversion zone
✅ RSI near oversold → bounce probability
✅ Good asymmetric upside vs downside
⚠️ Momentum (MACD & EMAs) still bearish
⚠️ Daily close <109k = invalidation → potential SMA200 test (\~100.9k)
⚠️ Macro shocks (CPI, DXY, Fed) can break levels fast
---
### 📌 Trade Management Rules
* Move stop → breakeven after 50% of T1 hit
* Exit fully if **daily close <109k**
* Cut exposure if ETH/alts roll over or funding spikes
---
### 🧾 JSON Trade Details
```json
{
"instrument": "BTC",
"direction": "long",
"entry_price": 110350.00,
"stop_loss": 109300.00,
"take_profit": 114976.00,
"size": 2.0,
"confidence": 0.60,
"entry_timing": "market_open",
"signal_publish_time": "2025-08-26 08:22:18"
}
```
---
### 🔖 Tags
\#BTC #CryptoTrading #ScalpTrade #SwingTrade #MeanReversion #Bitcoin #DayTrading #RiskReward #TradingSignals #CryptoMarkets 🚀📈🔥


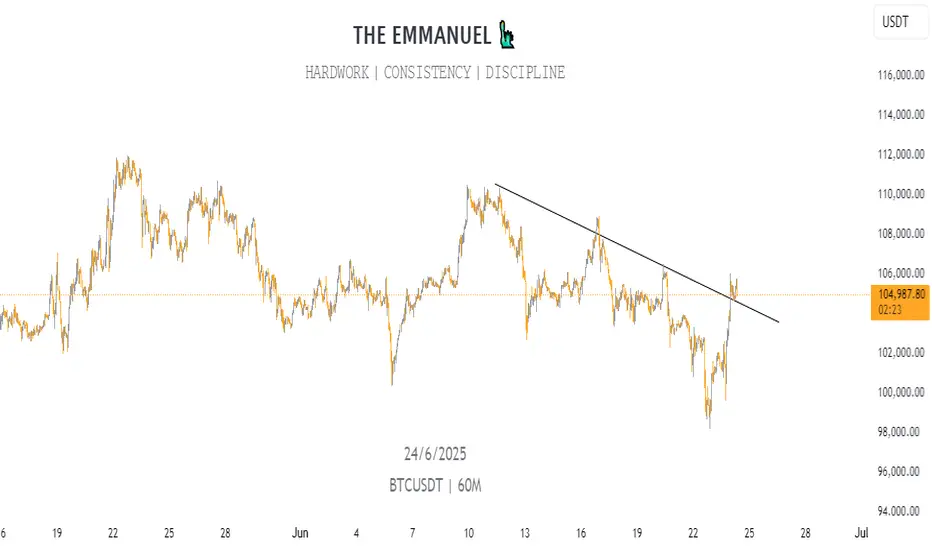
Is Btc finally bottoming (and alts)?Is Btc finally bottoming? If not today, then soon. There might be one more undercut of today's low (current low is $110,560). But since I dont want to miss the train before it leaves the station I'm getting on here at 110K. Could it hit 108K, sure. But that's only a 2% margin of error, which is acceptable. Of course there will be stops in place if Btc goes below 108K.
May the trends be with you.
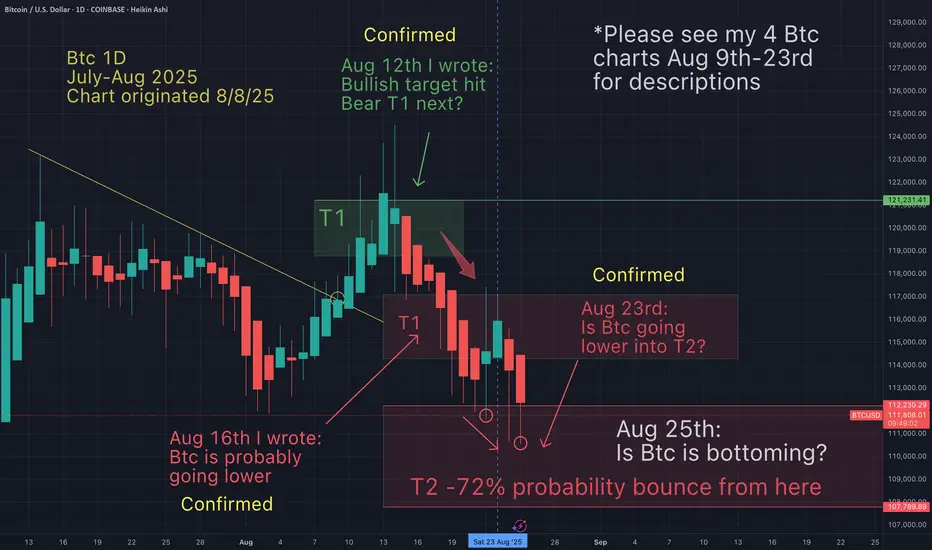
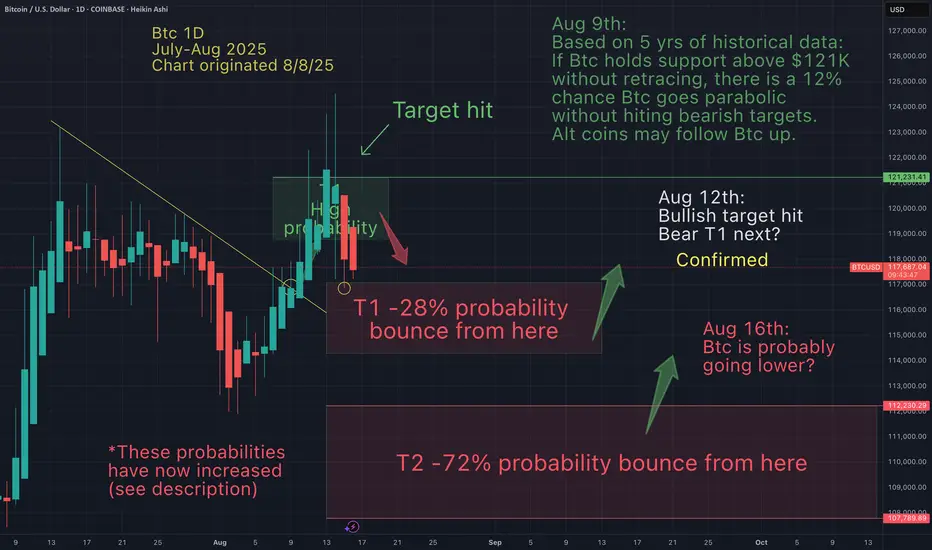
Is Btc going lower? Aug 9th- As Btc was approaching a break of the trendline, I anticipated the usual % "fakeout" and set my T1 (green box) accordingly. Asking the question, "Is Btc doing what it always does?"
Because if it did, then setting my bearish targets (and their probabilities), was a matter of simple calculations.
Aug 12h - As my green T1 was confirmed, I became confident we were in a very common bearish pattern and with the highest probability, my bearish T2 would be hit.
Aug 16th- Once I ruled out the 12% chance of a Btc parabolic move (without a retrace into either bearish target), I was able to recalculate the probabilities of my bear targets. These were udated as seen on the chart below. I wanted my followers to understand WHY I had increased the probailities in each of T1 and T2 targets.
Aug 23rd - As of today, my bear T2 target has been hit and the entire anticipated bearish pattern has been confirmed. I wanted to offer a bit of an explination on how I came to determine price action once Btc broke trend.
But the question remains, will Btc go lower into my T2 target ($108K - $112K)? I believe the answer is yes. And that would be my ideal buy zone for Btc and my favorite alt coins.
May the trends be with you.

You ask yourself "how did he know that Btc would do that" As anticipated Btc is about to hit my high probability bearish target (T2). Question is how much lower into this historical range will Btc go (108K-112K). What do you think?
Bitcoin: $120K Breakthrough – Getting Ready for $130K–$134K!Bitcoin: $120K Breakthrough – Getting Ready for $130K–$134K!
🚀 Bitcoin (BTC/USD) – Technical Review, August 2025
• Support: $110K–112K holds — above it, bulls retain initiative.
• Momentum resumes: BTC broke through $120K, thanks to $260 million inflow into Bitcoin via ETFs and potential Bullish IPO. Drive is maintained. Possible target is $130K–$134K.
• Technical outlook: Recovery above $115K after record highs in July. Breakout — will give way to $128K. Hidden risks — fall below $110K.
• Long-term targets: Technical measurement points to potential up to $146,400 if above $112K holds and top is broken. RSI remains favorable, volumes on exchanges are declining — signal of institutional outflow.
Bottom line: Bitcoin is confidently holding above the key $110-120K zone. A breakout of $120K is a starting point for a move to $130-$134K, and then to $146K. Watch for consolidation or pullback near current levels.
Tactics:
- Buy on dip: around $112-115K with targets of $130-134K.
- Breakout buy: if it consolidates above $120K, target $130-$134K, then $146K.
- Stop loss: under $110K.
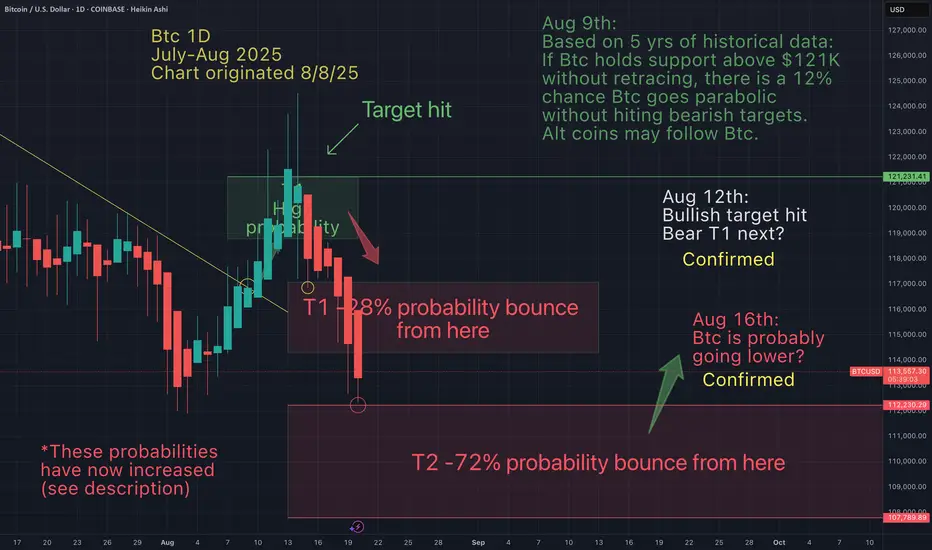
You will ask yourself "how did he know Btc would do that"?On Aug 9th I suggested Btc would pump from $112K to at least $121K (green box). That has now been confirmed. I also anticipated that Btc would retrace from there, to either T1 or T2 (Red boxes). That is now confimed and Btc may still go lower. See original chart below.
Simply determining support and reisitance is not enough! I must determine with greater certainty in which direction the asset going (at all times). Will it hit support first or reistance? This makes ALL the difference in trading. I have determined the diection from Aug 9th to go up... And then down from my T1 (green box)...and then up from one of my 2 red boxes.
Now that the 12% chance of a Btc pump without a retrace has been ruled out, the probabilities for my 2 bearish targets have increased accordingly. Now T1 (red) is 28% & T2 is 72%.
I have taken profit at the top and will buy back in at the next low. I am monitoring price action closely and anticpate buying into this next bottom.
May the trends be with you.
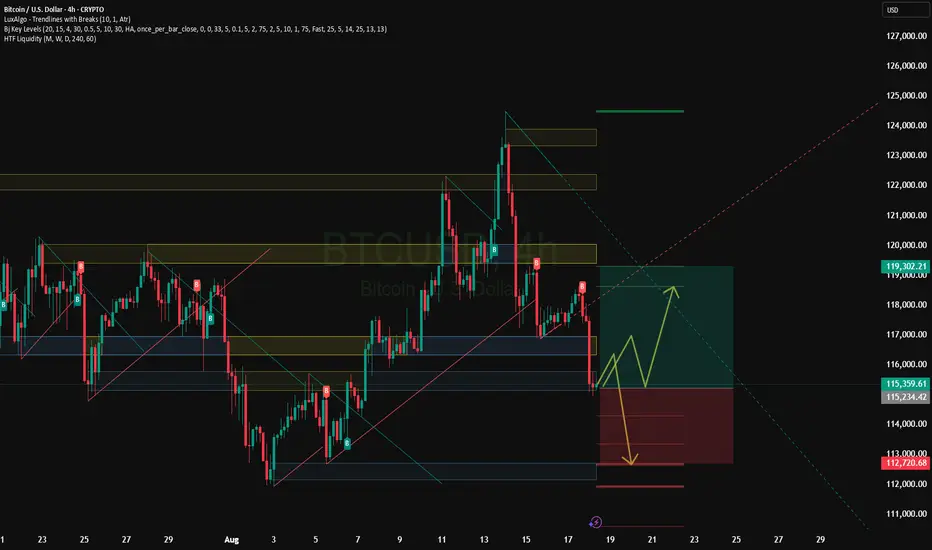
Btc anticpated downside - short term price action explainedHere is a 15 min chart to follow up on the daily chart below (chart originated Aug 9th)
Now that my uspide has hit (within 1% and within the expected timeframe)... I have outline the anticipated path down to my lower target (red) T1.
I will turn very bullish after my red target gets hit.
May the trends be with you.

Btc hit my upside target perfectly. Now retrace to downside T1?On Aug 9th, I suggested that Btc would break the downward trend and head up to my upside target (green T1). It did so the next day. I then anticipated a retrace to either T1 or T2 based on historical data (see chart below)
My upside target hit within 1%. So now...with the highest probability, Btc may now retrace into T1 (1st red box). There's always a chance it can go lower, but based on price action I expect a bounce at T1. We may not get T2 (even though there is a higher historical probability).
There is still that 12% chance Btc is just up only from here (with NO retrace into T1).
***Let me know what target you think will be hit (T1 or T2), or if you think up only from here.
May the trends be with you

BTC perfectly hits $120K, latest BTC analysis and operations#BTCUSD
After nearly a week of volatile consolidation, BTC once again touched around 120,000. I have already made it clear to everyone before that once BTC stabilizes above 116,500, it may first touch 118,000 and then challenge the macro resistance level of 120,000. I think anyone who had carefully reviewed the strategy and thought seriously about the ideas behind it would have made substantial profits. Currently, BTC maintains an overall upward trend, but may face the risk of an overbought pullback in the short term. Those with sufficient funds in their accounts can consider shorting with a light position. BTC may reach 118,000-117,000 and stabilize before rebounding.

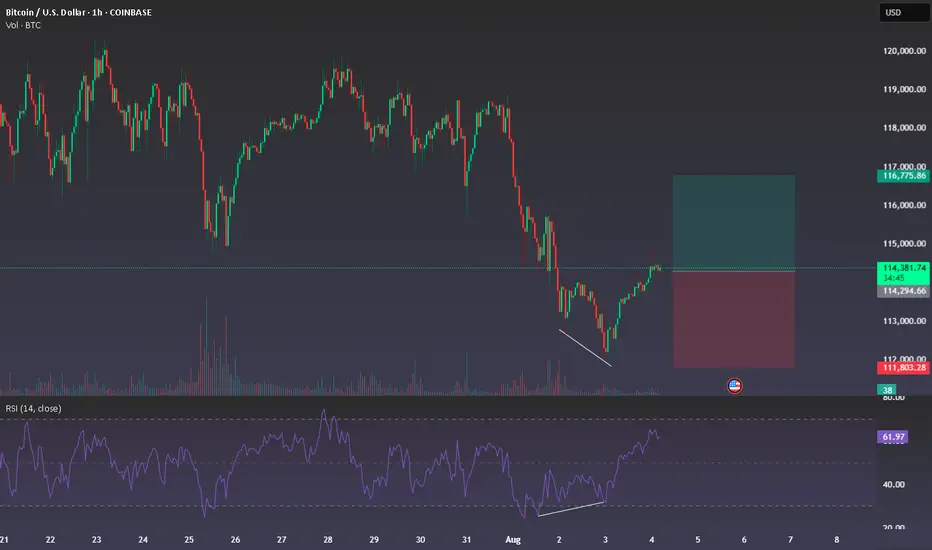
BTC Long – Bullish Divergence 1H Looking for long from 114300 zone
1H chart showing bullish divergence
also price broke short downtrend with nice momentum
Timeframe: 1H
Entry: 114300
Target (TP): 116850
Stop (SL): 111700
Only sharing my view, not any financial advise, thx
BTC/USDT Buy Setup – VSA & Demand Zone Reaction✅ Entry: Current price action near 117,297
🎯 Target: 119,078 (+1.22%)
🛑 Stop Loss (SL): 116,944 (below demand zone)
📊 Technical Insight (Volume Spread Analysis):
Stopping Volume at Lows:
The recent down move halted with a wide spread down-bar on high volume, followed by an immediate rejection. This indicates potential professional buying absorbing supply.
No Supply Confirmation:
After the stopping volume, several narrow spread candles on low volume formed, suggesting weak selling pressure and a lack of commitment from bears.
Bullish Reaction:
Price rebounded from the demand zone with increasing volume on up-bars, showing early signs of demand dominance.
The current consolidation just above the support is typical of absorption before a markup phase.
Risk-Reward Structure:
The setup offers a favorable 2.2:1 R:R ratio, with the stop placed just below the zone to avoid false breakouts while allowing the trade room to breathe.
📌 Trade Plan:
Bias remains bullish as long as price holds above 116,944.
A breakout above the minor resistance (117,828) with volume expansion would confirm the next leg up toward the 119,078 target.
If volume fails to support the move, reassess before committing additional capital.

Bitcoin at the Edge of the Fibonacci Gate - Silent Strain.⊣
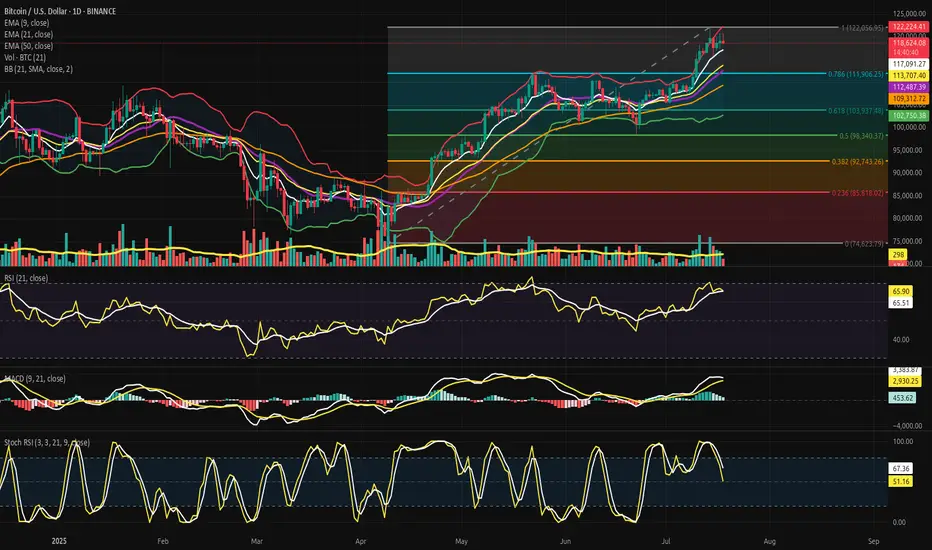
⟁ BTC/USD - BINANCE - (CHART: 1D) - (Jul 18, 2025).
◇ Analysis Price: $118,866.60.
⊣
⨀ I. Temporal Axis - Strategic Interval - (1D):
▦ EMA9 - (Exponential Moving Average - 9 Close):
∴ EMA9 is currently positioned at $119,077.81, closely tracking the current price, acting as dynamic micro-support;
∴ The slope of EMA9 remains upward, with price consistently closing above it in the past sessions;
∴ Compression candles are forming above this line, suggesting it is being defended as a tactical floor.
✴️ Conclusion: EMA9 is structurally supportive, signaling short-term bullish control beneath compression.
⊣
▦ EMA21 - (Exponential Moving Average - 21 Close):
∴ EMA21 is placed at $118,537.29 and holds a clear upward slope;
∴ Recent pullbacks have tested the region near EMA21 but failed to close beneath it;
∴ EMA21 is establishing itself as the primary mid-range buffer zone within this bullish phase.
✴️ Conclusion: EMA21 confirms intermediate momentum preservation and mid-term trend integrity.
⊢
▦ EMA50 - (Exponential Moving Average - 50 Close):
∴ EMA50 is located at $116,804.80 and remains untouched during the current rally phase;
∴ The distance between EMA21 and EMA50 is widening, confirming structural momentum;
∴ This line now functions as the lower tier of the bullish envelope - a defensive anchor.
✴️ Conclusion: EMA50 reflects resilient bullish understructure and rising support basin.
▦ Fibonacci Retracement - (ATH = $122,056.95 / Low = $74,623.79):
∴ Price is currently positioned just under the 0.786 level, a classic tension zone before ATH retests;
∴ The 0.618 level has already been claimed and held as support, showing strength through key retracements;
∴ The market is coiling between 0.786 and 1.000 in preparation for decisive expansion or rejection.
✴️ Conclusion: BTC sits within the golden gate - structurally pressurized near final resistance thresholds.
⊢
▦ Bollinger Bands:
∴ Bands are visibly contracting, forming a volatility funnel around the current price zone;
∴ The price is maintaining proximity to the upper band without closing beyond it;
∴ The base band remains far beneath ($116k zone), indicating untriggered potential.
✴️ Conclusion: Volatility is compressing structurally; directional resolution is imminent.
⊢
▦ Volume + EMA21:
∴ Volume bars have declined steadily during this upper-range consolidation;
∴ EMA21 on volume confirms weakening participation relative to early July moves;
∴ Absence of breakout-volume suggests either stealth accumulation or passive stalling.
✴️ Conclusion: Volume behavior is non-confirmatory - the structure floats without conviction.
⊢
▦ RSI - (21) + EMA9:
∴ RSI(21) currently prints 60.45, above its own EMA9 at 59.41, suggesting net upward pressure;
∴ The RSI slope remains neutral-to-positive without entering overbought;
∴ The absence of bearish divergence confirms internal momentum coherence.
✴️ Conclusion: RSI structure is clean, moderate, and aligned with sustainable trend energy.
⊢
▦ Stochastic RSI - (3,3,21,9):
∴ K = 78.78 | D = 71.55 - both above 70, nearing the overbought ceiling;
∴ The fast line (K) shows minor inflection but no confirmed cross;
∴ Momentum is elevated, but historical context shows price can remain extended.
✴️ Conclusion: Momentum is entering saturation zone - caution on short-term exhaustion.
⊢
▦ MACD - (9,21):
∴ MACD line (540.52) remains above the signal line (414.93) in sustained bullish crossover;
∴ The histogram has begun flattening, indicating reduced acceleration;
∴ There is no bearish cross yet, but momentum build is slowing.
✴️ Conclusion: MACD supports bullish continuation, but thrust intensity is decaying.
⊢
▦ OBV + EMA9:
∴ OBV reads 71.13M and is currently flat, with no new highs in accumulation;
∴ EMA9 on OBV closely hugs the raw OBV line, confirming stagnation;
∴ Prior upward surges in OBV are not being extended, showing tactical pause in conviction.
✴️ Conclusion: Liquidity expansion has halted; OBV structure is tactically neutral.
⊢
🜎 Strategic Insight - Technical Oracle:
∴ The BTC/USD structure is entering a compressed apex between structural momentum (EMA stack, RSI, MACD) and tactical exhaustion signals (Stochastic RSI, Bollinger Band constriction, flattening OBV);
∴ Price is stabilizing just beneath the ATH gate ($122,056), indicating a threshold scenario - where breakout and rejection probabilities are approaching parity;
∴ Volume decline reflects the absence of forced participation, and suggests that the next move will be event-triggered or liquidity-engineered. The current environment favors volatility re-expansion, not trend reversal;
✴️ This is a threshold phase: structurally bullish, tactically suspended, awaiting ignition.
⊢
∫ II. On-Chain Intelligence – (Source: CryptoQuant):
▦ Exchange Netflow Total + EMA9:
∴ Current Netflow: -938 Bitcoins - sustained negative flow over time indicates coins leaving exchanges;
∴ Persistent outflows reflect holding sentiment and reduced immediate sell pressure;
∴ Price action shows historical upside alignment when netflows remain negative across clusters.
✴️ Conclusion: Exchange behavior signals macro holding bias, not liquidation cycles.
⊢
▦ Binary CDD + EMA9:
∴ Binary CDD has spiked into high activity zones in the past week, showing awakened dormant coins;
∴ This metric historically precedes localized tops when synchronized with weak flows;
∴ However, no consistent clusters are forming - signals remain scattered.
✴️ Conclusion: Binary CDD reflects isolated movements, not systemic awakening or distribution.
⊢
▦ Exchange Whale Ratio + EMA9:
∴ Current ratio hovers at ~0.62 - elevated but not extreme;
∴ Sustained whale activity near 0.60+ can precede volatility events;
∴ Trendline is rising since May, showing gradual uptick in dominance from top senders.
✴️ Conclusion: Whale activity is tactically elevated, implying latent strategic intent.
⊢
▦ Supply-Adjusted Dormancy + EMA9:
∴ Dormancy values are near historical lows, indicating old coins are staying inactive;
∴ EMA9 confirms a downward trend in dormant supply movement;
∴ Long-term holders are not distributing at this level.
✴️ Conclusion: Structural dormancy supports holder conviction - no exit signals from old supply.
⊢
▦ Realized Cap + EMA9:
∴ Realized Cap is now exceeding $1T, rising consistently without parabolic spikes;
∴ EMA(9) and line are in lockstep - a healthy ascent;
∴ No acceleration = no blow-off = sustainable revaluation.
✴️ Conclusion: Value accumulation remains organic, not euphoric.
⊢
▦ MVRV Ratio + EMA9:
∴ MVRV sits at 2.36 - below historical overvaluation levels (>3.0);
∴ EMA(9) confirms gradual slope upward, consistent with price;
∴ Ratio is not overheated - risk/reward remains structurally favorable.
✴️ Conclusion: MVRV indicates non-euphoric regime - mid-phase of value appreciation.
⊢
▦ BTC vs GOLD vs S&P500 - (BGemetrix Comparative Graph):
∴ BTC continues to outperform both GOLD and SPX in long-term slope, even after corrections;
∴ Current phase shows GOLD flattening and SPX slightly lagging BTC in verticality;
∴ This divergence hints at BTC leading in speculative rotation while traditional assets stabilize.
✴️ Conclusion: BTC holds macro-dominance position, operating as the apex volatility proxy in current intermarket structure.
⊢
🜎 Strategic Insight - On-Chain Oracle:
∴ Despite short-term compression, the on-chain structure reveals no distribution threats;
∴ Holder conviction, realized valuation, and MVRV slope all suggest controlled structural appreciation, not mania;
∴ Whales are tactically present, but dormancy and exchange flows confirm no mass exit;
∴ This is an internally coherent, tactically patient regime.
✴️ Bitcoin is preparing, not peaking.
⊢
𓂀 Stoic-Structural Interpretation:
▦ Structurally Bullish - Tactically Suspended:
∴ All key EMA's (9/21/50) are stacked and rising; price remains elevated yet non-parabolic;
∴ Fibonacci apex is active, with price compressing beneath the ATH zone ($122,056), not retreating;
∴ On-chain intelligence confirms long-term conviction, with no distribution from whales or dormants.
✴️ Conclusion: The system retains structural strength; pressure is latent, not expired. The architecture is bullish, not euphoric.
⊢
▦ Tactical Range Caution:
∴ Stochastic RSI and MACD show early-stage exhaustion;
∴ Volume has declined into apex, favoring liquidity traps or volatility bursts;
∴ Whale Ratio elevation implies pre-positioning behavior, not public confirmation.
✴️ Conclusion: Tactical maneuvering is dominant. Breakout potential exists but is not trustable until confirmed by volume and displacement.
⊢
⧉
Cryptorvm Dominvs · ⚜️ MAGISTER ARCANVM ⚜️ · Vox Primordialis
⌬ - Wisdom begins in silence. Precision unfolds in strategy - ⌬
⧉
⊢
$BTC/USDT Eyes $121KCRYPTOCAP:BTC has broken out of the descending wedge and is holding above key support around $106K.
The structure looks bullish with a potential move toward $121K (+11.24%).
As long as the price stays above the breakout zone, momentum favors the bulls.
DYOR, NFA

$BTC/USDT daily chart $121K next.CRYPTOCAP:BTC just broke out of a descending wedge on the daily chart, a strong bullish signal.
It’s now holding well above key support and the 50-day moving average, showing buyers are in control.
If BTC stays above $106,400, we could see a move toward $121K next.
DYRO, NFA

$BTC Long Setup. CRYPTOCAP:BTC Long Setup
Price bounced from the key demand zone.
- Entry: CMP
- SL: $108,517
- TP: $110,030
DYOR, NFA

BTCUSD Trade Setup Idea on 1D Timeframe - Bullish MomentumBitcoin (BTCUSD) is currently trading at $109,348, showing strong bullish momentum on the 1H chart. The recent breakout from consolidation signals potential continuation, provided key resistance levels are breached and held.
Must Consider Analysis Timeframe : 1Day.
Strictly follow the trading rules for Entry..... only on Retracement.
SL on Previous or Close swing low.
🔍 Key Levels to Watch:
Bullish Continuation Confirmation: If price sustains above 112,150, we expect bullish momentum to accelerate.
Target 1 (TP1): 112,150 – Key breakout level that may act as support once reclaimed.
Target 2 (TP2 - Major): 121,128 – Long-term resistance and major profit-taking zone.
📊 Trade Logic:
A confirmed breakout and hold above 112,150 indicates strong buyer interest and could drive price toward 116,572 and 121,128.
The trend remains bullish as long as price holds above the breakout structure.
REMEMBER:- RESPECT THE LEVELS, LELEVLS RESPECT YOU THEN.
💡 Strategy: Monitor for retests and bullish candle confirmations above 112,150 to add or enter long positions with proper risk management.
! Disclaimer & Important Note:
This analysis is for educational and informational purposes only. It does not constitute financial advice or a recommendation to buy or sell any financial instrument. All trading involves risk. We are not responsible for any kind of loss incurred, whether financial, emotional, or otherwise. Always do your own research and consult with a licensed financial advisor before making any trading decisions.
Trading involves significant risk, and you should never invest more than you can afford to lose. Past performance is not indicative of future results.
The trade idea shared above reflects personal market interpretation and is subject to change based on new market conditions.
Posted by: THEPATELCRYPTO, 45Degree
Stay safe. Trade smart.
Follow for more ideas!
📍Posted by: THEPATELCRYPTO, 45Degree
📈 Stay safe. Trade smart.
🔔 Follow for more ideas!

Short BTC, it is about to retrace and test 100000 again!As BTC gradually fell back, the rebound did not stand above 110,000 in the short term, proving that there is strong selling pressure above, and the trend line formed by the technical high point 111,000 and the second high point 110,000 formed an important resistance area, which limited the rebound space of BTC and strengthened the demand for BTC's short-term retracement.
According to the current trend, the short-term oscillation bottom area of 106,000 may be broken at any time. Once it falls below the oscillation area, it may arouse a certain degree of profit-taking chips and stimulate BTC to accelerate its decline. I think BTC will at least test the 105,000-104,000 area again during the retracement, and may even test the 100,000 integer mark again.
Therefore, shorting BTC is still the preferred option for current short-term trading.
Consider shorting BTC in the 108,000-109,000 area, and the target area in the short term is 104,500-103,500. After breaking this area, the target can be extended to 101,000-100,000.
BINANCE:BTCUSDT BINANCE:BTCUSDT BITSTAMP:BTCUSD

NEW BTC HIGHS?BTC just broke a previous resistance zone. Previous data indicates a more upward push.
This may even lead to new highs.
BTC Volatility Range Shifts Upward: Focus on Shorting The volatility range is moving upward, rising from 101,500–105,000 to 104,000–107,000 📈. It’s advisable to focus on shorting at higher levels ⏬. Currently, BTC is still in a range-bound fluctuation—just control your trade position sizes properly, and there won’t be any major issues essentially 😊!
⚡⚡⚡ BTCUSD ⚡⚡⚡
🚀 Sell@107000 - 106000
🚀 TP 104500 - 103500
👇Accurate signals are updated every day 📈 If you encounter any problems during trading, these signals can serve as your reliable guide 🧭 Feel free to refer to them! I sincerely hope they'll be of great help to you 👇

BTCUSD BULLISH CHART PATTERNHere I Created This BTCUSD Chart Analysis
Pair : BTCUSD (BITCOIN)
Timeframe: 15 - Minutes
Pattern: Parallel Channel
Momentum: Bullish/ Buy
Entry Level : BUY 103200
Support zone : 104800
Target Will Be : 104200
Disclaimer : This signal is based on personal analysis for learning purposes. Trade at your own risk and always use proper risk management.

BTC/USD 4H Chart Setup – Bullish Breakout Targeting $104K1. Trend Direction
⬆️ Uptrend Detected
* Price is forming higher highs and higher lows
* Trading inside a bullish channel
* Breakout potential above the top trendline.
2. Key Zones
🟦 Support Zone: $95,252.31
* Labeled as RBS + RBR ZONE
* Strong buy area → previous resistance turned support
* Perfect area to catch a bounce
📏 Support Line & Trendline
* Trendline keeps price supported along the climb
* Acts as a launch pad for the next move.
3. EMA 70 (📉 Red Line)
* Current value: $93,636.88
* Price is above EMA, showing strong bullish pressure
* EMA acts as dynamic support.
4. Trade Setup
🎯 Target Point: $104,000
🟦 Target Zone: $103,918.60 – $104,747.91
🔥 Entry Zone: $95,252.31 (marked blue box)
⚠️ Stop Loss: $94,091.28
* Positioned safely below support
* Good Risk/Reward Ratio.
5. Extra Cues
📅 Economic event icons near May 3–6 → Potential volatility ahead
⚡ Pullback in progress → May offer a buying opportunity.
Conclusion
🚀 Bullish Setup!
* Watch for a bounce from the blue demand zone
* Targeting $104K breakout
* Strong support + momentum = solid long opportunity.
