Bitcoin (BTCUSDT) – Intraday Trend & Pattern AnalysisHi!
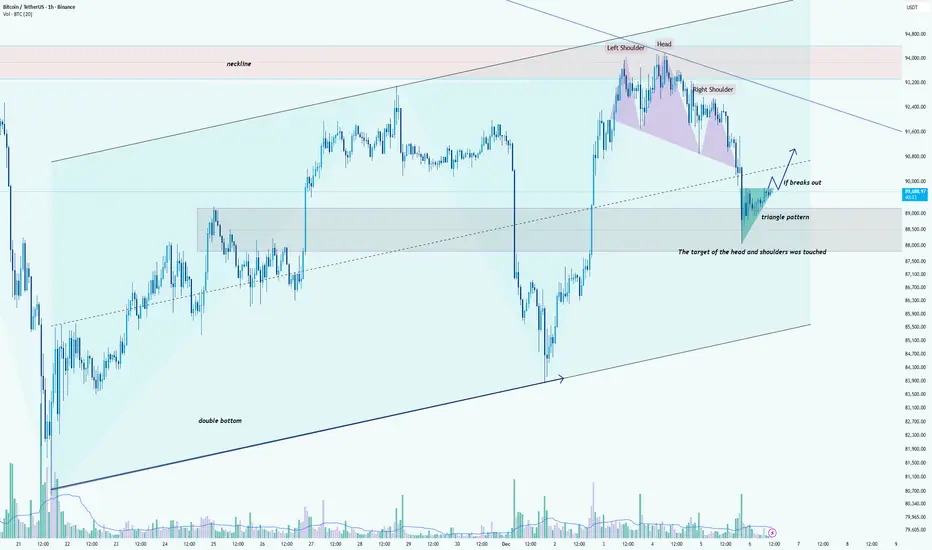
Bitcoin continues to trade within a broader ascending structure, supported by an established rising trendline that has guided price higher over the past weeks. After forming a double bottom near the lower boundary of this channel, BTC initiated a strong rally toward the major resistance zone around 95,000 USDT, where a clear head-and-shoulders reversal pattern appeared. The neckline later broke, and its measured target has already been fully achieved, confirming the pattern’s validity.
Following the completion of this decline, the price stabilized inside the previous consolidation zone and began forming a triangle pattern, signaling compression and potential trend continuation. BTC is now testing the upper boundary of this triangle. A confirmed breakout above the pattern could trigger a bullish continuation toward 90,500–91,200 USDT, aligning with the dashed trendline and short-term resistance levels.
Failure to break upward may lead to a retest of the triangle’s lower boundary or even the broader demand area around 88,000–88,500 USDT, which previously acted as a reaction zone.
Overall, as long as the price remains above the ascending channel’s main support, the medium-term structure favors buyers. A breakout from the triangle will be the key signal for renewed bullish momentum.
Btcusdbuy
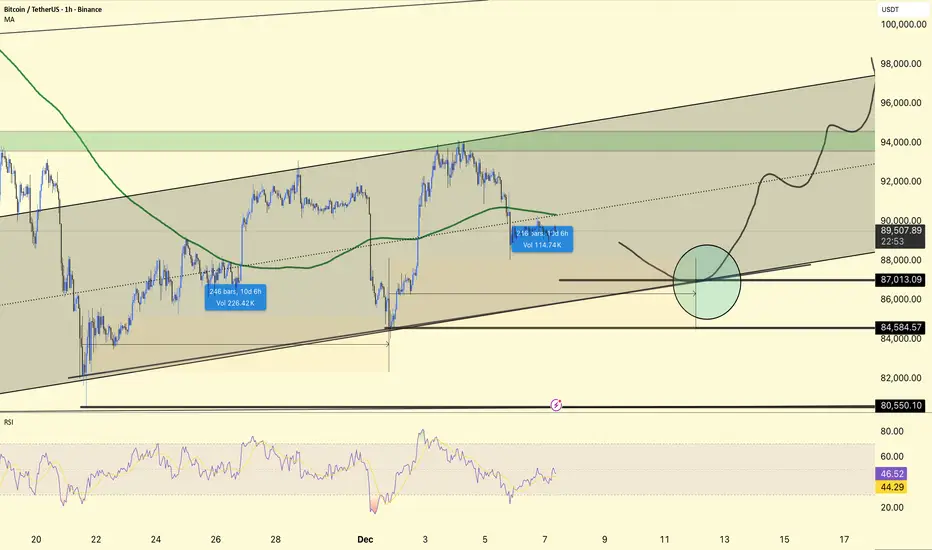
#BTC 4HOUR CHART UOPDATE !!BTCUSDT is still trading within an ascending channel, now pulling back towards the mid-lower portion of the structure after failing to sustain above 90k on the latest push.
The price has rolled over from the upper half of the channel and is heading towards the main confluence zone around 87,000–88,000, where the lower channel line, previous horizontal support, and your marked circle align.
84,584 and 80,550 remain the next downside reference supports; holding above 87k maintains the short-term bullish channel, while a break below 84,584 would increase the risk of a deeper correction towards 80k.
A decline into the 87k area, followed by basing and a continuation back towards 92k–94k, and if buyers defend the channel as drawn, possibly to the 96k–98k channel top.
The RSI is mid-range rather than overbought, so there is room for another leg down or a sharp bounce to test support; using 87k–84.5k as the main invalidation band for aggressive longs fits within the current 4H structure.
DYOR | NFA,
BTCUSD Technical Analysis (30m)This post provides an analytical breakdown of BTCUSD using the 30-minute timeframe (30m), leveraging our proprietary technical indicator: the Trend Break Target (TBT) Indicator.
Market Structure Shift and Indicator Activation
The current analysis focuses on a significant change in the market structure observed on the 30m chart. The TBT indicator was programmed to detect and react to specific conditions that signify a high-probability continuation or reversal.
Activation Signal: The indicator was activated and the price targets were subsequently generated following the closing of the specific candle indicated by the arrow on the chart. This close confirmed the necessary structural change (e.g., a break of resistance/support, or a specific pattern completion) required by the TBT's underlying logic. This market structure shift (MSS) provides the foundation for the calculated price objectives.
Calculated Price Targets (TBT Forecast)
Based on the activation of the Trend Break Target Indicator, the following potential price objectives have been calculated. These targets represent areas where price action is statistically likely to find resistance, profit-taking activity, or a high-probability exhaustion point for the current move.
🎯 Target 1 (T1): $90,400
Significance: This is the immediate and most probable objective, often representing a minimum measured move following the structure break.
🎯 Target 2 (T2): $91,450
Significance: A secondary, extended target that comes into play if bullish momentum persists and T1 is cleanly surpassed and held.
🎯 Target 3 (T3): $92,709
Significance: The final, ambitious target representing the full potential move calculated by the TBT model based on the initial structure shift. It acts as the high-end projection for the current impulsive wave.
Disclaimer
Note: This analysis is based on a proprietary indicator and should be used for informational and educational purposes only. Always manage your risk effectively, use appropriate stop-loss orders, and conduct your own due diligence before making any trading decisions. The crypto market is highly volatile, and actual price action may deviate from projected targets.

btc live tradeHello friends
Given the sharp upward movement we had, you can see that the sellers have made a high, which increases the possibility of a price correction, and we can witness a price increase in the price correction until the specified targets are reached.
This analysis is purely from a technical perspective and is not a buy or sell recommendation, so please observe risk and capital management.
*Trade safely with us*

GET READY FOR BITCOIN COMING BULL HIGH PROBABILITY SETUP SOON!!!🚨 BITCOIN HIGH PROBABILITY BUY SETUP 🚨
* Here We Can See Clearly The Next Potential Moves For BTCUSD Coming Hours/Days.
* Keep Your Eyes Close On Your Trading Positions.
* Happy PIP Hunting Traders.
FXKILLA.

#BTC/USDT is currently strongly bullish#BTC
The price is moving in a descending channel on the 1-hour timeframe. It has reached the lower boundary and is heading towards a breakout, with a retest of the upper boundary expected.
We are seeing a bearish trend in the Relative Strength Index (RSI), which has reached near the lower boundary, and an upward bounce is expected.
There is a key support zone in green at 88200, and the price has bounced from this level several times. Another bounce is expected.
We are seeing a trend towards stabilizing above the 100-period moving average, which we are approaching, supporting the upward trend.
Entry Price: 88900
First Target: 90000
Second Target: 91123
Third Target: 92300
Remember a simple principle: Money Management.
Place your stop-loss order below the green support zone.
For any questions, please leave a comment.
Thank you.

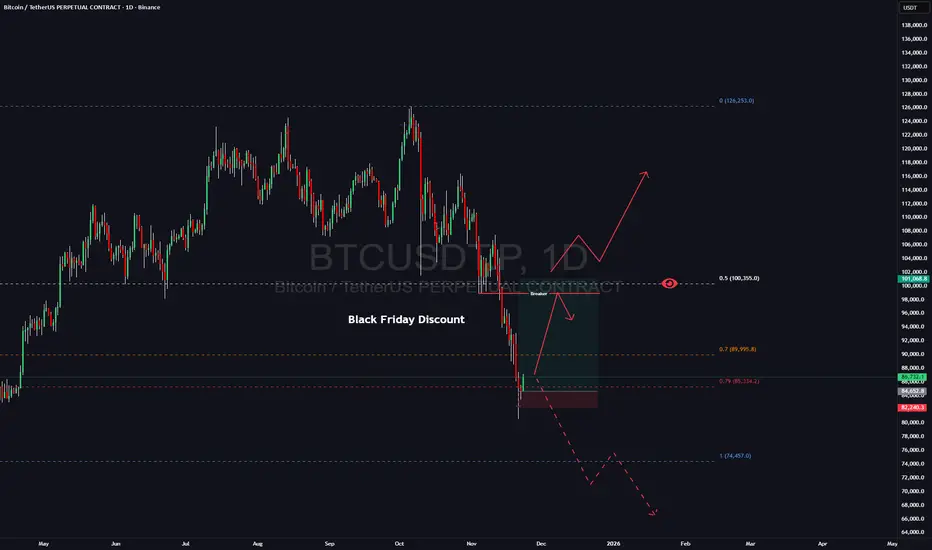
BTC Is Preparing Monster Move: My Bullish Roadmap to New High!A lot of people are already calling for the end of the BTC rally and welcoming a new bear market. Whether that’s true or not — the chart will show. I approach the market with a neutral mindset and let price action speak for itself.Plus dont forget we have Black Friday coming and probably crypto market decided to give you a nice discount)
From my perspective, Bitcoin has simply tapped the weekly discount zone. Historically, BTC often delivers a 20–30% corrective move, which is completely normal within a bullish cycle. And with Black Friday approaching, it seems the crypto market decided to offer its own “discount.”
I’ve taken a long position from this area, with my first target set at 94–96K, where I plan to secure the majority of my profits.
My stop is positioned around 82K — if the market goes against me, I’m fully comfortable with the risk.
I’ve also added some spot positions and will share detailed analysis on those in upcoming posts.
Once we reach the 94–96K zone, I’ll reassess the market. Price can shift in either direction from there, which is why that area is my main profit-taking zone while letting the remainder of the position run.
Follow me for further updates and trade breakdowns.
BTC 4H CHART ROUTE MAPDear Traders,
BTC has shown strong gains this week and has confirmed a short-term bullish trend across multiple confluences.
Wait for the price to pull back to the entry zone around IFVG & BPR area close to $89K–$91K before looking for TP1, TP2, and TP3, with your stop-loss set at $83,500.
Always trade with proper risk and money management.
The Quantum Trading Mastery

BITCOIN SIGNAL: THIS IS WHERE THE CRASH WILL STOP!!!? (watchout)Yello Paradisers! Enjoy the video!
We are discussing a lot of technical stuff—Elliott Wave theory. We are going through multiple time frames, and I'm updating you about the price action, development structure, and important levels, as well as what the highest probability next move is.
And Paradisers! Keep in mind to trade only with a proper professional trading strategy. Wait for confirmations. Play with tactics. This is the only way you can be long-term profitable.
Remember, don’t trade without confirmations. Wait for them before creating a trade. Be disciplined, patient, and emotionally controlled. Only trade the highest probability setups with the greatest risk to reward ratio. This will ensure that you become a long-term profitable professional trader.
Don't be a gambler. Don't try to get rich quick. Make sure that your trading is professionally based on proper strategies and trade tactics.

BITCOIN BUYBtcusd looking to scalp into a quick trade using a buy stop as bitcoin will have to return to its previous price point, as it cannot sell forever.

Will Bitcoin Price Under $95,000 Benefit From $2 Billion BuyingBitcoin is trading at $92,047, holding above the critical $91,521 support level while remaining trapped under the month-long downtrend. Recovering from this position requires a decisive breakout, which has yet to materialize despite recent attempts.
Invalidating the downtrend demands a flip of $95,000 into support. Given the ongoing accumulation and tightening exchange supply, such a move remains possible. Additional support from institutional buyers would further strengthen Bitcoin’s path toward $100,000, restoring bullish momentum.
If large holders remain sidelined, Bitcoin may continue to struggle. A failure to sustain support could send BTC back below $89,800 and toward $86,822. This would reinforcing bearish sentiment and delaying recovery attempts.

BTC Bullish Setup Identified – My Trade Plan📌 Bitcoin has successfully formed a bullish setup on the 1H time-frame. Based on current price behavior and structural support levels, I am entering this trade with a clear and disciplined plan.
🟩 Entry Zone
₹ 91,200 – 91,500
Price is currently respecting this demand zone, showing signs of absorption and potential upside reversal.
🔰 Stop Loss
₹ 90,000
Clean invalidation level below the support.
If this breaks, bullish structure is gone — so SL is fixed.
🎯 Target
₹ 93,500
This aligns with previous resistance and the next liquidity pool.
Once price reaches this zone, I’ll book profits.
⸻
📈 Summary
• Setup Type: Bullish Reversal
• Entry: 91,200–91,500
• SL: 90,000
• Target: 93,500
• Risk–Reward: Attractive & disciplined
⸻
BTC is preparing for a bounce — waiting for confirmation and executing with proper risk management. 🚀📊

BTC Trade Set Up Dec 4 2025Price remains bullish on but i am expecting a sweep of SSL and/or tap into 4h FVG before a continuation higher to supply and BSL

BTCUSD – Observing a Bullish Flag Structure on the 4H ChartBitcoin’s 4-hour chart is showing a period of consolidation following a strong upward movement. The recent rally created a steep impulse leg, and price is now moving within a compact range that resembles a bullish flag–type structure. This type of structure often appears when the market is taking a pause after increased momentum.
Several moving averages (EMA 7/21/50) are positioned below the current price, indicating that short-term trend conditions continue to lean on the supportive side. Price is holding above these EMAs while staying inside the consolidation zone.
If price continues to maintain support near this range, traders will often watch for a potential continuation scenario. On the other hand, if the market slips below the lower boundary, it may signal that the consolidation phase is extending or losing momentum.
This idea focuses on illustrating the pattern and highlighting how price is interacting with the EMAs, without suggesting any specific trading action.

BTC: The rebound is not over yet, buy on pullbackDuring the early session, BTC surged to the 94,100 resistance area before encountering selling pressure. The price then retraced to the 92,600 support zone, where it stabilized. This was followed by a modest recovery, and the market is currently consolidating in a high-level compression range with a slight downward bias.
From a technical perspective, the BTC daily chart shows two consecutive bullish candles breaking above the mid-Bollinger band, after which the price has entered a slower consolidation phase. The current small doji indicates that upside momentum has moderated; however, the broader trend still remains within an upward channel.
Short-term pullbacks continue to serve as a re-accumulation phase ahead of the next potential directional move. On the 1-hour timeframe, BTC displays a classic V-shaped reversal structure. Combined with alternating buy-sell pressure on lower timeframes — along with bulls swiftly reclaiming lost ground — this suggests strong buying interest at lower levels. Therefore, the trading bias仍 remains tilted to the long side.
Trading Strategy:
Consider long positions within 92,700–92,300
Upside target: around 94,500

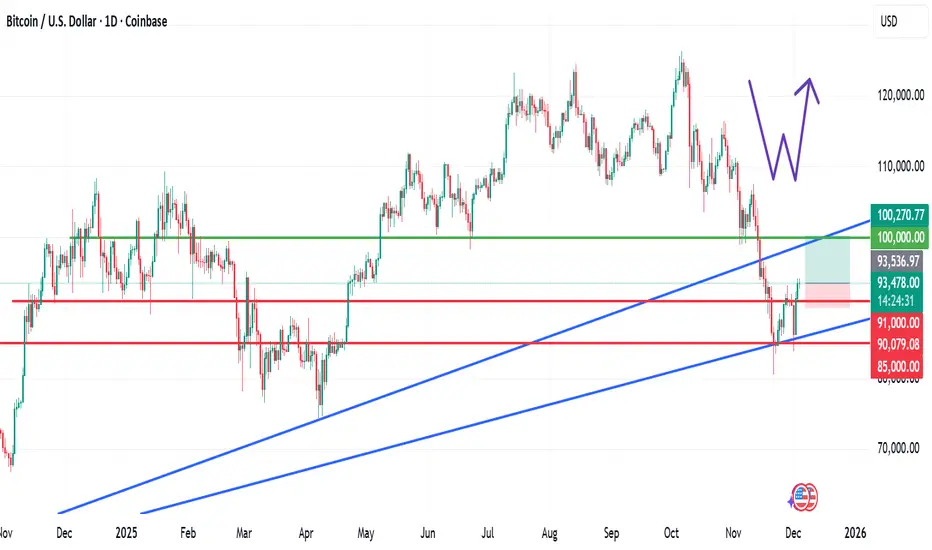
Bitcoin and the Double Bottom Reversal PatternBitcoin and the Double Bottom Reversal Pattern: Is This a Key Turning Point?
Following the previously outlined technical levels that played out successfully, Bitcoin has now formed a double bottom (W) reversal pattern, a widely recognised signal in technical analysis indicating potential bullish momentum.
Price action has also broken above the $91,000 level, which previously served as resistance and aligns with the neckline of the pattern.
A sustained hold above this zone may confirm the reversal structure and support further upside movement.
If the $91,000 support level remains intact, the next logical target based on pattern projection is the $100,000 zone and potentially beyond, depending on market sentiment and volume continuation.
Trade Plan
Entry 1: Current market price (aggressive positioning)
Entry 2: $92,000
Take Profit: $100,000 and above
Stop Loss: $89,900
Ensure your risk management remains balanced and aligned with your strategy.
If you found this analysis useful, feel free to like, share, and drop a comment below.
I am looking forward to engaging with you here on TradingView.
#BTC/USDT is currently strongly bullish#BTC
The price is moving in a descending channel on the 1-hour timeframe. It has reached the lower boundary and is heading towards breaking above it, with a retest of the upper boundary expected.
We have a downtrend on the RSI indicator, which has reached near the lower boundary, and an upward rebound is expected.
There is a key support zone in green at 92500. The price has bounced from this level multiple times and is expected to bounce again.
We have a trend towards consolidation above the 100-period moving average, as we are moving close to it, which supports the upward movement.
Entry price: 92990
First target: 93204
Second target: 93750
Third target: 94406
Don't forget a simple principle: money management.
Place your stop-loss below the support zone in green.
For any questions, please leave a comment.
Thank you.

BTCUSD - D11. Completed 5-Wave Decline
The downtrend from the triple-top region completed like this:
(1) bearish impulse
(2) corrective rally into BOS breaker block
(3) extended wave — largest impulse
(4) weak correction respecting trendline
(5) final capitulation into massive liquidity BUY zone (blue)
Your chart correctly marks the final liquidity sweep, which forms the foundation for reversal.
This 5-wave completion is the strongest indication that a trend reversal is starting on D1.
2. Liquidity Grab + ChoCH = Reversal Confirmation
At the bottom:
Price swept deep liquidity under the entire October–November structure.
Then formed a ChoCH (change of character) upward.
This is the D1 first sign of bullish strength.
Smart money accumulated in the blue zone → now initiating the markup phase.
3. Current Price Action – Ascending Structure Forming
Price is building:
A bullish wedge / re-accumulation structure
Multiple higher lows
Price breaking the internal descending trendline
This matches exactly the pattern drawn on your chart.
4. Expected Move (Based on Your Projection)
BTC is likely to follow a two-leg bullish cycle:
🔹 First Target Zone: 100,000 – 102,500 (Supply Zone)
This is the first major D1 supply, created during Wave (4) & internal bearish OB.
Expect:
A reaction
A short-term pullback
Possibly forming a higher low around 95,000–97,000

BTC 4H Chart Route MapDear Traders,
BTC has shown strong gains this week and has confirmed a short-term bullish trend across multiple confluences.
Wait for the price to pull back to the entry zone around IFVG & BPR area close to $89K–$91K before looking for TP1, TP2, and TP3, with your stop-loss set at $83,500.
Always trade with proper risk and money management.
The Quantum Trading Mastery

BITCOIN SIGNAL: SELL EVERYTHING NOW!!!!!!!? (big)Yello Paradisers! Enjoy the video!
And Paradisers! Keep in mind to trade only with a proper professional trading strategy. Wait for confirmations. Play with tactics. This is the only way you can be long-term profitable.
Remember, don’t trade without confirmations. Wait for them before creating a trade. Be disciplined, patient, and emotionally controlled. Only trade the highest probability setups with the greatest risk to reward ratio. This will ensure that you become a long-term profitable professional trader.
Don't be a gambler. Don't try to get rich quick. Make sure that your trading is professionally based on proper strategies and trade tactics.

BITCOIN SIGNAL: ONE MORE DUMP BEFORE PUMP??? (warning)Yello Paradisers! Enjoy the video!
And Paradisers! Keep in mind to trade only with a proper professional trading strategy. Wait for confirmations. Play with tactics. This is the only way you can be long-term profitable.
Remember, don’t trade without confirmations. Wait for them before creating a trade. Be disciplined, patient, and emotionally controlled. Only trade the highest probability setups with the greatest risk to reward ratio. This will ensure that you become a long-term profitable professional trader.
Don't be a gambler. Don't try to get rich quick. Make sure that your trading is professionally based on proper strategies and trade tactics.

BTC Trade Set Up Dec 3 2025Price broke structure to the upside on the 4h which shows buyers are now in control so i will look for 1h-15m bull structure or a tap into 4h demand to target high BSL, supply and daily FVG

BTCUSDTWe have a big downtrend.
By breakout from support and resistance we will have continued trend to next target.
Breakout 82k ready to 70k.
Breakout 93k ready to 100k and 115k.
CRYPTOCAP:BTC BITSTAMP:BTCUSD BINANCE:BTCUSDT
