#BTC Long toward $12100BTC is moving sideways as @unknown highlights current price near $109,942 aiming for a bullish breakout 📈 with targets around $123,313 noted on the chart.
Btcusdbuy

BTCUSD price await one time breakout below 109850 before selling#BTCUSD price await one time breakout below 109850 before selling.
Multiple rejection have happened between 110150 and 109850.
Sell from 109850, target 108900, stop loss 110531.
Above 110300 shows bullish continuation on 2 times breakout.

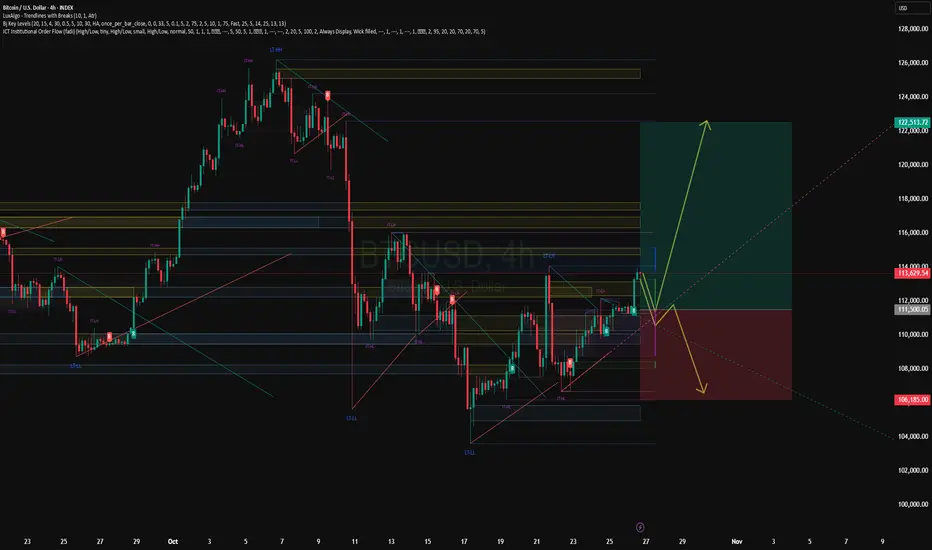
BITCOIN HIGH PROBABILITY SETUP SOON!!!🚨 BTC HIGH PROBABILITY SELL/BUY SETUPS 🚨
* Here We Can See Clearly The Next Potential Moves For BTCUSD Coming Hours/Days.
* Keep Your Eyes Close On Your Trading Positions.
* Happy PIP Hunting Traders.
FXKILLA.

$btc idea for weekend big range to play ! BTC has big range bounce off at 0.78 fib level
1- bullish : if we can take one level of higher low around 111.7K and change this structure there is change we move higher from here likely sunday pump
2-bearish: if we have slow price action over weekend with slow bleed get below 108.4K we might sweep low of range or touch 0.786 level once again
what you think happen first ?

Bitcoin - The manipulation!On the weekly Bitcoin chart, there’s a clear bearish rising wedge pattern, and right now it’s trading near the lower side of that wedge — getting ready for a downward weekly breakout.
But let me remind you of something important — this will likely be part of a psychological game played by market makers, so remember my words carefully:
- Bitcoin will break down from the wedge, giving a bearish signal, and many traders will enter short positions.
- It’ll even dip slightly below the 50 EMA, making everyone more confident in the bearish move.
- Then, it’ll reverse sharply upward, liquidating all the short positions.
Market makers always make you believe your plan is playing out perfectly — right before they turn against you and take your money.
So stay alert, place your buy orders slightly below the 50 EMA, and avoid using high leverage.
Best Regards:
Ceciliones🎯

BTC Retracement Setup After Liquidity Sweep at Key Resistance📊 Bitcoin 4H Analysis – Bullish Momentum Meets Key Liquidity Zone
Bitcoin continues to trade within a strong bullish trend on the 4-hour timeframe. Price has now tapped into a major resistance zone — the liquidity sitting above a previous external range high. This reaction suggests we may see a corrective move before the next leg higher. 🔁💡
I’ll be waiting for price to retrace back into equilibrium of the current bullish price swing, where premium turns to discount, to look for a high-probability long setup. ✅🎯
⚠️ Not financial advice — for educational purposes only.

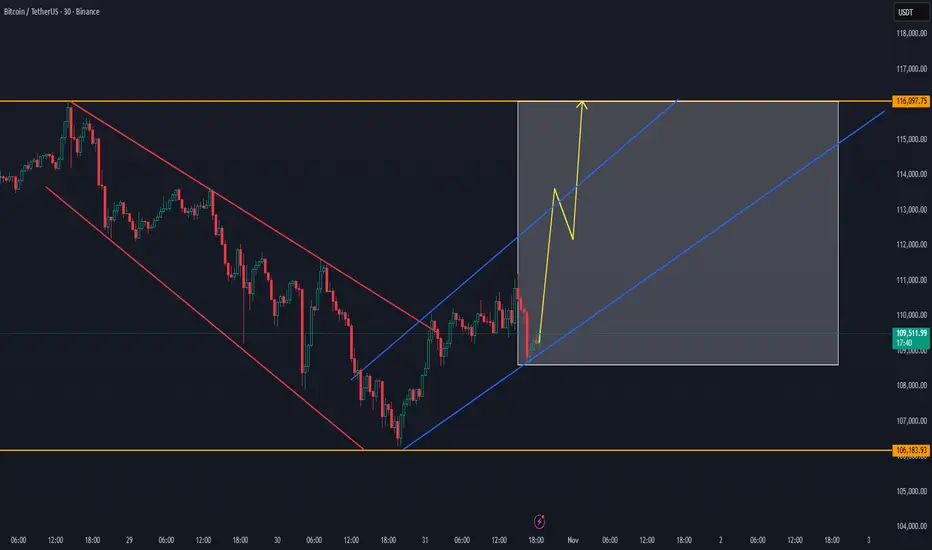
BTC Weekend Setup — Possible Volume Push Toward 116KBTC Weekend Setup — Possible Volume Push Toward 116K 🔥
Coinbase effect + China can play an important role for the breakout of 116K+
Bitcoin has broken out of its descending channel, reclaiming structure and showing early signs of strength.
Momentum is gradually building within the new ascending trend, suggesting that the weekend could bring a volume expansion targeting the 116K zone.
📈 Technical Outlook:
BTC successfully flipped the 106K–108K area into support.
The new uptrend channel is forming higher lows and showing a steady recovery pace.
Volume remains low but is expected to increase into the weekend, often a period of volatility and directional moves.
🎯 Targets:
First resistance: $112K–$113K
Main target zone: $115K–$116K
If volume confirms, a push to 116K could complete this short-term recovery cycle.
⚠️ Risk note:
Failure to hold above $108.5K could slow momentum, bringing price back to retest lower trendline support.
💬 Summary:
BTC is positioned for a potential weekend volume push, with a clear channel structure guiding price toward the 116K resistance zone. Momentum is cautiously bullish — watching for confirmation through weekend trading activity.
BITCOIN SIGNAL: HERE IS THE NEXT MOVE!!!! (damn)Yello Paradisers! Enjoy the video!
And Paradisers! Keep in mind to trade only with a proper professional trading strategy. Wait for confirmations. Play with tactics. This is the only way you can be long-term profitable.
Remember, don’t trade without confirmations. Wait for them before creating a trade. Be disciplined, patient, and emotionally controlled. Only trade the highest probability setups with the greatest risk to reward ratio. This will ensure that you become a long-term profitable professional trader.
Don't be a gambler. Don't try to get rich quick. Make sure that your trading is professionally based on proper strategies and trade tactics.

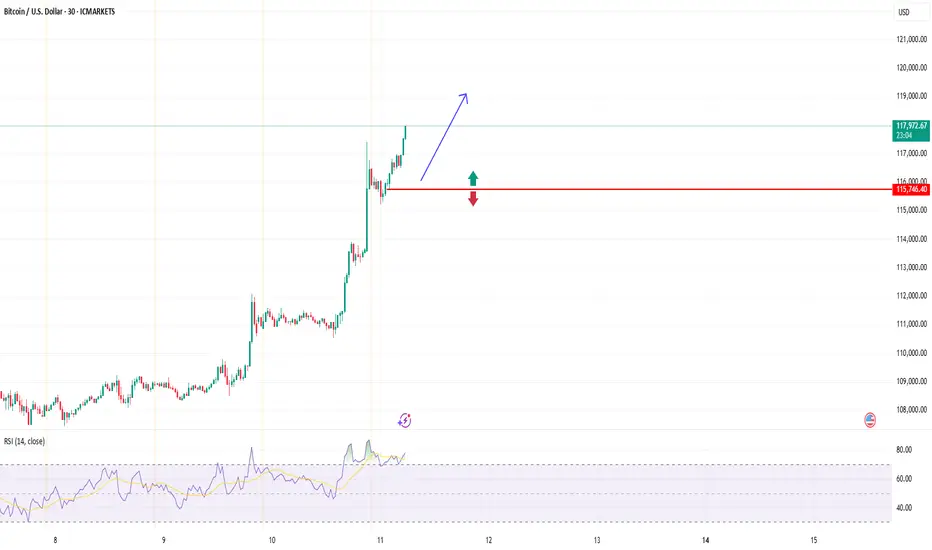
BTCUSD (Bitcoin): Forex Technical AnalysisDate: 11 July 2025
Momentum: Up
First Scenario : long positions above 115,706.14 with targets at 117,269.52, 117,904.51 and 118,513.05
Second Scenario : short positions below 115,706.14 with targets at 114,544.35, 113,774.89 and 113,053.39
Comment: RSI - Bullish.
Supports and resistances :
118,513.05 **
117,904.51 *
117,269.52
116,747.25 - Last price
114,544.35
113,774.89 *
113,053.39 **
Bitcoin 4H trade Idea It seems like BTC has done bottom here after FOMC FOMO long liquidation..
Entry & Exit points are given.
NFA DYOR

Market volatility, why I dare to be bullish on BTC#BTCUSD BITSTAMP:BTCUSD BINANCE:BTCUSDT
The BTC market has been declining since yesterday's US session, with a sharp drop following Powell's hawkish comments, hitting a low of around 106,500. Institutional trading activity has decreased in the short term, suggesting a deliberate wait-and-see approach, anticipating further price corrections before re-entering the market. Therefore, do not blindly participate in trading in the short term.
The current BTC market may seem bustling, but it is actually rife with undercurrents. A new direction will only be established when sentiment reaches its peak and volatility subsides. Perhaps the next real starting point will not be in the current clamor, but after the cheers of retail investors subside. Pay attention to the performance of the downward channel support level of 160,000-104,500. If it pulls back to this range, you can consider establishing a small long position.

BTC Showing Early Signs of a Possible New UptrendBTC Showing Early Signs of a Possible New Uptrend 🚀
The key is to follow the trend. BTC can return from this point back up 109K
Bitcoin has bounced from the lower range near $107K, holding support after several strong rejections to the downside.
The current structure suggests that momentum could be shifting upward, as the market forms a potential new base for recovery.
There is a good chance that the secure whale trend could use 107K as support for entering on a later time frame to a new cycle
📈 Current outlook:
Support has been confirmed around $107K–$108K, where buyers stepped in with volume.
Short-term resistance remains at $111.6K–$113.3K — a breakout above could confirm a trend reversal.
The price is now trading in the mid-range, building strength for a possible push higher.
📊 Observation:
If BTC manages to reclaim and hold above $113K, the next leg up toward $116K could begin, signaling the start of a new uptrend cycle.
Failure to hold this recovery base would risk another test of the $107K zone.
💬 Summary:
BTC has shown strong recovery signs after defending support — momentum now points toward a possible new uptrend if it sustains above key resistance levels.

BTCUSD (Bitcoin) has broken powerful support = Time to sell!BTCUSD (bitcoin) has been in a new bearish trend for the last few weeks and has just recently broken a major support level which is shown (white line drawn) .. it has also broken the support level of an upward channel (the 2 red trendlines) ... The next very likely outcome for bitcoin is for it to hit and test the next support level all the way to the downside.

BTC/USD: Wave 5 Launch or Wave Cycle End?BTC/USD: Wave 5 Launch or Wave Cycle End?
📈 Weekly Scenarios
Bullish scenario: Price holds above ~$110,000, breaks through ~$120,000 → wave (5) strengthens → possible rise to ~$135,000-140,000.
Consolidation: Price trades between ~$110,000 and ~$120,000 without a formed structure, the market is paused.
Bearish scenario: Break of support at ~$110,000 with volume → corrective wave A-B-C → possible decline to ~$100,000-105,000.
✅ Conclusion
On the weekly timeframe, BTC/USD is at a key turning point: either an upward impulse (wave (5)) or the beginning of a major correction.
Holding support at ~$110,000 is the basis for a bullish scenario.
A breakout of resistance at ~$120,000 is a signal for continued growth.
A breakout below ~$110,000 is a signal for a change in structure.

BITCOIN SIGNAL: SECRET PATTERN ABOUT TO BREAKOUT (massive)!!!!!!Yello Paradisers! Enjoy the video!
And Paradisers! Keep in mind to trade only with a proper professional trading strategy. Wait for confirmations. Play with tactics. This is the only way you can be long-term profitable.
Remember, don’t trade without confirmations. Wait for them before creating a trade. Be disciplined, patient, and emotionally controlled. Only trade the highest probability setups with the greatest risk to reward ratio. This will ensure that you become a long-term profitable professional trader.
Don't be a gambler. Don't try to get rich quick. Make sure that your trading is professionally based on proper strategies and trade tactics .

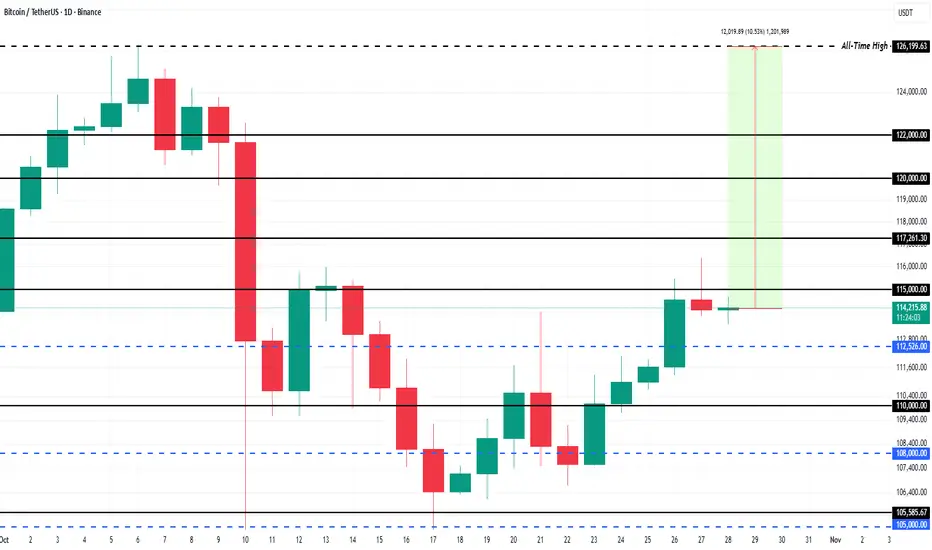
What To Expect From Bitcoin Price In November 2025At the time of writing, Bitcoin trades at $114,518, sitting just below the key $115,000 resistance level. With investor sentiment turning increasingly positive, BTC could soon push through this barrier. A confirmed breakout would likely trigger renewed momentum, driving prices toward higher resistance levels in November.
Bitcoin’s near-term target remains its all-time high (ATH) of $126,199, which requires a 10.2% rise from current levels. To achieve this, BTC must first clear strong resistance zones at $117,261 and $120,000, where heavy supply from profit-takers could temporarily slow progress.
However, if Bitcoin fails to sustain momentum above $115,000, short-term weakness could reemerge. A dip toward $110,000 remains possible if buyers lose conviction. Any move below this support would invalidate the bullish outlook.
Bitcoin trading ideas and strategiesOn the daily chart, Bitcoin's four-day winning streak came to an end this morning. The candlestick chart showed a long upper candlestick with a hammer candlestick pattern. However, the price ultimately closed above the 60-day moving average, maintaining its key support level.
The Bollinger Bands are continuing to narrow, and volatility is gradually narrowing amidst the current bull-bear tussle. The KDJ indicator's fast line is showing signs of slowing at high levels, suggesting a short-term correction. The MACD lines maintain a golden cross pattern and diverge upward, with continued volume growth. Funding is providing some support for bulls, who remain in the driver's seat.
Trading Strategy: Go long between 113,000 and 113.5,000, with a target around 116,000.

BTC/USD Breaks Descending Channel – Targeting $116K After BullisAsset: Bitcoin (BTC/USD)
Exchange: Bitstamp
Timeframe: 30-minute
Current Price: $108,168
Trend: Breakout from descending channel; potential bullish reversal forming.
🔍 Key Chart Features:
Descending Channel (Yellow Trend Lines)
Bitcoin was trading inside a well-defined downward-sloping channel.
Multiple touchpoints confirm the validity of the pattern.
The price has now broken out above the upper trendline, suggesting a shift in momentum.
Buy Zone (Purple Rectangle, ~$105,600 – $106,300)
Marked as “ZONE BUY.”
This acted as a strong support zone where price bounced.
Aligns with previous reaction lows.
Breakout Confirmation
The breakout from the channel, followed by a higher low within the buy zone, confirms bullish sentiment.
Immediate rally of +1.85% (1,970 points) adds weight to the breakout.
Target Projection: $116,052
Based on measured move (channel height or breakout projection).
Represents a potential +9.5% upside from breakout region.
Shown with a large blue arrow indicating bullish target zone.
🧠 Interpretation:
Current Market Structure:
A trend reversal is likely underway after prolonged selling pressure.
Bullish Setup:
Rejection from the buy zone with a sharp move up.
Break of channel trendline + confirmation pullback = classic reversal pattern.
Upside Target:
$116,052, if momentum holds and support zones remain protected.
Risk Management:
Invalidation level: Below $105,600 (bottom of the buy zone).
Consider trailing stop-loss as price rises.
✅ Summary Strategy:
Entry Zone: ~$106,000 (within Buy Zone or breakout retest)
Stop-Loss: Below $105,600 (buy zone base)
Target: ~$116,052
Reward/Risk: Attractive (approx. 9.5% potential upside vs ~1.5% risk)

BTC has a bright future and is bullish with no regretsThanks to the positive news of the easing of Sino-US trade tensions over the weekend, BTC has gradually recovered from the severe consolidation it has experienced repeatedly since the brutal crash on October 10. This modest recovery appears to confirm the continuation of its upward trajectory.
From the perspective of technical indicators, the MACD golden cross continues to increase in volume and is always above the signal line, further strengthening the bullish sentiment of BTC. At the same time, from the 4H chart, the Bollinger Bands have expanded significantly as prices have risen, indicating that short-term volatility has increased. The fact that BTC prices have remained largely near the upper Bollinger Band suggests that, at this point, the market is more likely to continue its upward trend than to reverse.
However, it is worth noting that the small cycle is trending downward, and the divergence between RSI and price suggests that there may be profit-taking in the short term. Therefore, in the short term, BTC may face a small pullback to retest support before rising.
Pay attention to 114000-113000 below. If it retreats here, you can consider going long on BTC with a light position, with the target at 115000-117000.

BITCOIN SIGNAL: SHOCKER TARGET REVEALED!!! (warning) Yello Paradisers! Enjoy the video!
And Paradisers! Keep in mind to trade only with a proper professional trading strategy. Wait for confirmations. Play with tactics. This is the only way you can be long-term profitable.
Remember, don’t trade without confirmations. Wait for them before creating a trade. Be disciplined, patient, and emotionally controlled. Only trade the highest probability setups with the greatest risk to reward ratio. This will ensure that you become a long-term profitable professional trader.
Don't be a gambler. Don't try to get rich quick. Make sure that your trading is professionally based on proper strategies and trade tactics.

BTCUSDT TradeI when trading in IG:BITCOIN try come to breakeven in big candle for again entry buy or sell.
But you need fix target or trailing stop on new swing in profit.
Please have risk management.

BTC/USD: Final wave before breakout or correction signal?BTC/USD: Final wave before breakout or correction signal?
📊 Monthly Technical Analysis — Bitcoin (BTC/USD)
Using support/resistance levels and wave analysis
🌀 Wave Context
According to the Elliott Wave Principle model, Bitcoin may be either in the final impulse wave (5) or at the start of an A-B-C corrective structure.
Wave (4) is expected to have ended near the $100,000-$110,000 zone. If wave (5) starts, it could signal a significant upward move. Otherwise, a breakout of support could signal a correction.
📈 Monthly Scenarios
Bullish scenario: BTC holds above $110,000 → breakout to $120,000 → start of wave (5) → move to $135,000+.
Consolidation: The price moves sideways between ~$110,000 and ~$120,000, accumulating strength before a new move.
Bearish scenario: Breakout of support at ~$110,000 with volume → correction to ~$100,000 or lower.
✅Conclusion
On the monthly timeframe, BTC/USD is at a crossroads: it is either entering a powerful uptrend or a significant correction is beginning.
The ~$110,000 level is a key marker for the continuation of the bullish structure.
A breakout above $120,000 is a signal for growth.
A breakout below $110,000 is a signal for caution.
Monitor price movement relative to these levels and confirmation of the wave structure before making trading decisions.
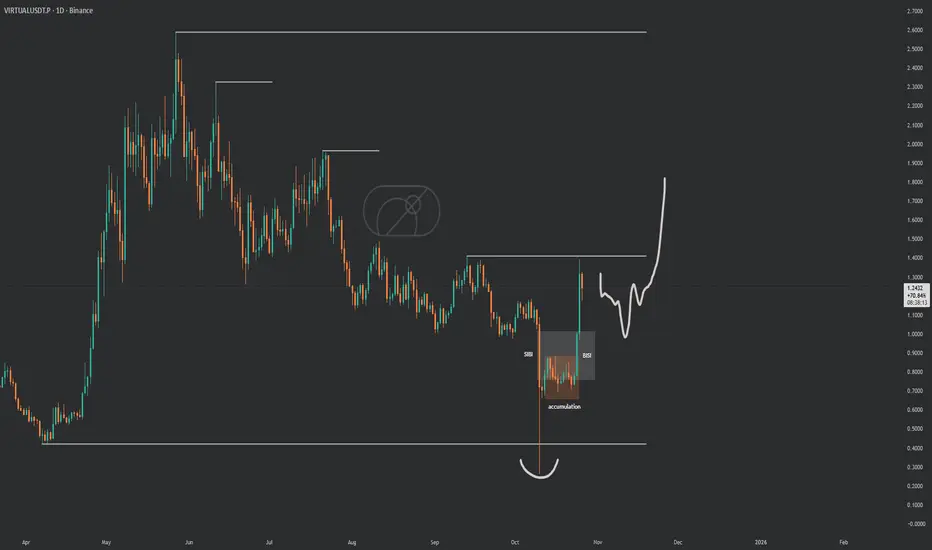
$VIRTUAL got that clean range clean price actionSPARKS:VIRTUAL got that clean range clean price action straight textbook accumulation. Lot of coins looking just like this, coiling up for the first real upside blast !If it dips to hand us $1, that's the golden entry.
new month watch list : SEED_WANDERIN_JIMZIP900:ASTER AMEX:XPL SPARKS:VIRTUAL