BITCOIN SIGNAL: THIS IS WHAT WILL HAPPEN NEXT!!!(smash it) Yello Paradisers! Enjoy the video!!
And Paradisers! Keep in mind to trade only with a proper professional trading strategy. Wait for confirmations. Play with tactics. This is the only way you can be long-term profitable.
Remember, don’t trade without confirmations. Wait for them before creating a trade. Be disciplined, patient, and emotionally controlled. Only trade the highest probability setups with the greatest risk to reward ratio. This will ensure that you become a long-term profitable professional trader.
Don't be a gambler. Don't try to get rich quick. Make sure that your trading is professionally based on proper strategies and trade tactics.
Btcusdbuy

BTC BUY Possible !Entered @12400$
BTC/USD Wave Update:
If a correction happens !
Bitcoin is completing wave (4) correction within the 113,200–112,700 support zone. If this level holds, a bullish wave (5) rally toward 116,500–117,000 is expected. A break below 112,700 invalidates the setup. Overall short-term trend remains bullish with minor retracement before continuation. COINBASE:BTCUSD

BTC 1DBTC is not in a good shape totally but it would be bullish until the shown date in my opinion ( 10/17)
possible path/prices is visible on chart

BITCOIN - WEEKLY UPDATE:🚨 #Bitcoin - Weekly Update: Macro Bullish, But Caution Ahead!
Macro Trend:
Remains bullish on weekly/Monthly 📈 (see my previous outlook).
Technical View:
Bullish above $100K. Following my long-term strategy, a deeper correction is likely toward $94K–$90K, or even $88K.
A successful test here? Start of a new ATH run! 🔥
Despite a bullish recovery, market indecision & fear is huge after the recent #alts liquidations wave + massive crash. 😱
H4: Bearish 📉
Retest at $115.8K seems done (as mentioned in my previous view).
Daily:
Bearish, But Strong Supports
We're still above key levels.
Notably:🔹 $101K–$102K (previous key bull reaction zone) = 50% Fib of the major trend.
To Watch:
The upper downtrend on H1 - critical for shifts!
My Personal Opinion:
🔹 Sideways phase likely between $109K–$115.8K. Next major move could come from a breakout.
🔹 If bulls fail to defend $116K, we could see another dip to $93K–$94K.
Bull rebound ahead or more downside?
What's your opinion? 👇

#BTC/USDT Bullish Momentum: Will It Break Through Resistance?
#BTC
The price is moving in a descending channel on the 1-hour frame and is expected to break and continue upward.
We have a trend to stabilize above the 100 moving average once again.
We have a downtrend on the RSI indicator that supports the upward move with a breakout.
We have a major support area in green that pushed the price higher at 109860.
Entry price: 112045.
First target: 113534.
Second target: 115471.
Third target: 117400.
To manage risk, don't forget stop loss and capital management.
When you reach the first target, save some profits and then change your stop order to an entry order.
For inquiries, please comment.
Thank you.

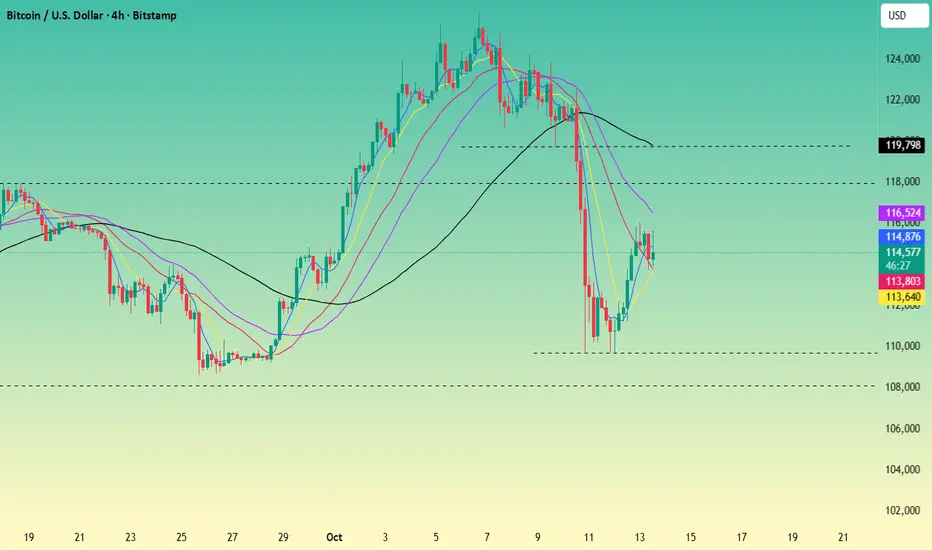
Bitcoin → Overall weak, focus on 113K supportBitcoin is currently trading at 114.2K. The market has now shown a clear downward trend. From a technical perspective, the bearish engulfing pattern appearing on the daily timeframe has formed a strong resonance with the bearish arrangement of the moving average system. This signal further confirms the market's bearish bias, and short-term rebound momentum is significantly insufficient.
In terms of the performance of key levels, although there is strong buying support at the 113K level on the daily timeframe, the current price is still suppressed by the short-term trend, and the effectiveness of this support level needs continuous observation. On the hourly timeframe, after forming a local high near 116K, the price entered a downward channel and is currently in a consolidation phase. No clear signal of stopping the decline has emerged yet, and the overall trend remains relatively weak.
Resistance Levels: 116K, 118
KSupport Levels: 113K, 109.6K
For detailed trading decisions, please follow my live updates. I publish my trading ideas and strategies daily. If you lack a plan or clear direction in cryptocurrency and are struggling to achieve consistent and stable profits, you can refer to and follow my updates as a reference and guide to help you avoid mistakes.

WHO WRE EXPECTING THAT BITCOIN WILL MOVE UP 118K...?Chart Overview
The chart shows Bitcoin trading between a strong support zone near $108,000–$112,000 and a resistance zone around $122,000–$123,000. After a sharp decline (“Falling Down”), BTC rebounded with a clear “Bullish Back” movement before facing resistance again.
Key Observations
1. Support Zone (108K–112K USD):
BTC has tested this zone multiple times, confirming strong buyer interest.
The recent bounce suggests accumulation pressure is building.
2. Resistance Zone (122K–123K USD):
Price faced rejection from this level previously.
A break and close above this resistance would confirm a bullish continuation pattern.
3. Pattern Formation:
A potential rounded bottom / cup shape appears to be forming, indicating bullish reversal potential.
The “eye” and “arrow” symbol in the chart highlight market observation before a possible breakout attempt.
4. Short-Term Outlook:
Expect sideways consolidation between 112K–118K USD before a possible bullish leg higher.
The next target levels on breakout: 120K, then 122.5K.
Support retest below 112K could delay recovery.
Bullish Scenario
Price holds above 115K and pushes past 118K, signaling momentum for a breakout.
Confirmation above 122.5K could open room toward 125K–128K.

BITCOIN COME BACK TO 125.000 Lets Gooo Hey ,
After A Big Crash In Crypto We Follow Now Our Technical Analysis And Market Structure And We Have A Find A Bullish Bitcoin Setup For Longterm Holding
Buy Reason : QM
Buy Zone : 112.937 to 112.091
Target Old High : BSL
Hope You Gpt The Trade And Understand It

Bitcoin → Bullish if it holds above 113K.As US President Trump announced the easing of the "tariff issue", cryptocurrencies rose. Bitcoin previously stabilized at the bottom of the 108-112 range and rebounded to a high of 116K. It is currently fluctuating at 114.2K. In the short term, we should pay attention to the support of 112k-113k. As long as this position is maintained, the rebound momentum can continue.
BITCOIN SIGNAL: ROUND 2 OF CRASH INCOMING!!!? (watch out) Yello Paradisers! Enjoy the video!
And Paradisers! Keep in mind to trade only with a proper professional trading strategy. Wait for confirmations. Play with tactics. This is the only way you can be long-term profitable.
Remember, don’t trade without confirmations. Wait for them before creating a trade. Be disciplined, patient, and emotionally controlled. Only trade the highest probability setups with the greatest risk to reward ratio. This will ensure that you become a long-term profitable professional trader.
Don't be a gambler. Don't try to get rich quick. Make sure that your trading is professionally based on proper strategies and trade tactics.

BITCOIN Growth Ahead!
HI,Traders !
#BITCOIN is trading along the
Rising support and is already
Making a bullish rebound so
As we are bullish biased due
To the strong uptrend we
Will be expecting a further
Bullish move up on BITCOIN !
Comment and subscribe to help us grow !

Bitcoin Price Nears $115,000 as Investors Refrain From SellingBitcoin is currently trading around $114,553, just below the critical $115,000 resistance level. It briefly surpassed this mark during the intra-day high but failed to maintain momentum, indicating ongoing selling pressure near this threshold.
In the short term, Bitcoin’s outlook remains cautiously bullish, supported by strong holder sentiment. A successful reclaim of $115,000 could pave the way toward $117,261 and eventually $120,000. However, a full recovery would require a sustained push back to $122,000.
But, if the bearish pressure from traders outweighs investor restraint, Bitcoin could slip below $112,500. This could result in the crypto king testing the $110,000 support level and invalidating the bullish outlook.

Sweep all liquidity, BTC recoversBTCUSD – Daily Analysis
The recent market move confirmed our earlier sell call at the 126K top, which played out perfectly as price reversed sharply from that resistance zone. This level aligned with the 1.618 Fibonacci extension and the upper trendline — a strong confluence area that signaled exhaustion.
Currently, BTC is rebounding from the support zone around 110K–111K, showing short-term recovery momentum. However, unless price breaks decisively above 121K, the structure still favors a potential retest toward 110K before any larger bullish continuation.
→ Key Levels:
• Resistance: 121K / 126K
• Support: 110K / 107K
• Trend: Short-term corrective uptrend within a broader range
✅ Successfully caught the 126K top — next focus on reaction around 121K zone.

Bitcoin BTC Breaks Structure | Watching for Discount Entry LongBitcoin has experienced a fairly aggressive retracement recently, but we’re now starting to see bullish momentum returning and a clear shift in structure to the upside 🚀.
💡 My plan is to look for a retracement into the 50% equilibrium level of the current swing range — from low to high — as this could provide a potential discount entry zone for a long opportunity 🏹.
If price pulls back and respects that equilibrium level before breaking structure bullish again, it could set up a strong continuation trade. If not, we patiently step aside and wait for confirmation — discipline over impulse.
⚠️ Disclaimer: This content is for educational purposes only and not financial advice.

BTC: Oscillate and ConsolidateAlthough BTC rose in oscillations today, it encountered resistance near 112,500 and failed to break through after several attempts. This position has gathered a certain number of trapped orders and active sell orders, forming a short - term resistance range. If the bulls can gather enough strength to break through the 112,500 with increased volume, the upward space will be opened, and the price may further challenge the resistance levels of 115,000 or even 120,000.
However, due to the sharp decline in the early stage, the market sentiment is still relatively fragile, and investors are generally cautious. From a technical point of view, Bitcoin is likely to continue to oscillate and consolidate in the range of 108,000 - 115,000 today, and the long and short sides compete around key levels.

BITCOIN !!!Hello friends
Given the good decline we had, a good opportunity was provided to buy at good prices with capital and risk management and in steps and move to the specified goals.
There was good liquidity at the bottom that was collected, now we can expect a good growth.
*Trade safely with us*

BTCUSDTBitcoin is trying to put good volume above this line and pull itself up. I think you can look for a long position.

BTC:Flash crashToday Bitcoin suffered a "flash crash", plummeting by over 13% in the early hours and falling below the $110,000 mark, which triggered forced liquidations for more than 1.6 million traders.
The core market situation can be summarized as leverage-driven cascading liquidations led by policy negatives. While short-term volatility has intensified, long-term key factors remain unchanged. Before the crash, Bitcoin’s leverage ratio soared to 50x, and high-leverage trading was prevalent among retail investors. Price fluctuations triggered forced liquidations, amplifying the decline.
We judge that the 103,000 level and the psychological threshold of 110,000 serve as crucial short-term support levels. If the price breaks below 100,000, a deeper correction may be triggered.
The Federal Reserve’s October interest rate decision, the progress of the U.S. government shutdown, and the follow-up developments of Trump’s trade policies will become core variables in the next phase.

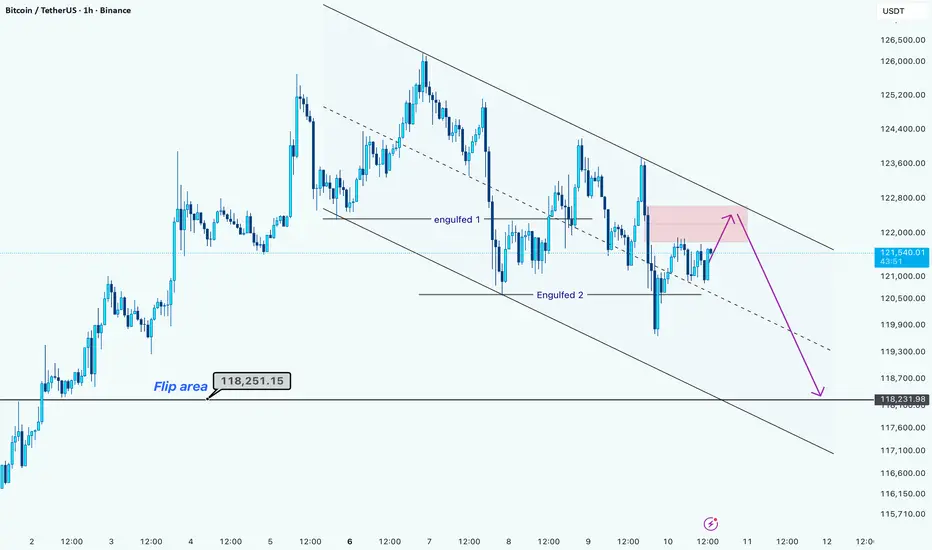
Bitcoin Facing Channel Resistance: Another Drop Ahead?Hello guys!
BTC is currently moving within a descending channel, showing consistent lower highs and lower lows, confirming a short-term bearish structure. The price continues to respect this channel, and until a clear breakout occurs, the downward bias remains intact.
Key Observations:
Two bearish engulfing (Engulfed 1 & Engulfed 2) have marked strong rejections from the upper boundary, reinforcing seller dominance at higher levels.
After the second engulfing, the price rebounded slightly, forming a minor pullback within the channel.
The upper boundary around $122,200–$122,500 is acting as dynamic resistance, aligning with the trendline.
Short-Term Expectation:
BTC could potentially push once more toward the upper boundary of the channel (around $122,200), where sellers may re-enter.
If the resistance holds, a continuation toward the $118,200–$118,300 support zone is expected, which aligns with the lower boundary of the channel and previous reaction levels.
Levels to Watch:
Resistance: $122,200 – $122,500
Support: $118,200 – $118,300
Breakout confirmation: A clean close above $122,500 could invalidate the bearish setup and open the way for a short-term bullish correction.
Bias: Bearish below $122,500
The amazing BTC and the secret of 152 & 52 weeks.🤔Here's an intriguing take on BTC and the potential significance of the 152 (Bulls) & 52 (Bears) week cycles:
🔑 BTC: Unlocking the Secrets of the 152 (Bulls) & 52 (Bears) Weeks 🗝️
Throughout BTC's history, a fascinating pattern has emerged – the alternation between 152-week bull cycles and 52-week bear cycles. 📈📉
This cyclical behavior has been observed multiple times, leading to the tantalizing question: Will history repeat itself once again? 🔄
My answer: Yes, I think the stars are aligning for another cosmic dance between the bulls and bears. 🐂🐻
If this pattern holds true, we are potentially witnessing a new 152-week bull run started in 7 Nov 2022 till the top around 6 October 2025, followed by a 52-week bear hibernation, and the cycle continues. ∞
However, as with all things crypto, nothing is set in stone, and the market is known for its unpredictability. 📊🔮
Nonetheless, for those who believe in the power of historical cycles, the 152 (Bulls) & 52 (Bears) weeks could serve as a fascinating guide, offering insights into potential market movements. 🧭
It is not a financial idea.
PLZ DYOR.
Good Luck.

BITCOIN - The Rhythm of the CycleBitcoin moves in rhythm - not random, not reckless, but harmonic.
Each rise and retrace plays like a melody from its own history,
and once again, the chart hums that familiar tune.
After tapping 126K , price retraced, tested 120K support ,
and bounced clean - a sign the rhythm’s still intact.
The ATH–SR zone (120K–124K) now acts as the pivot,
where momentum builds for what could be another November encore.
Above this range, the next notes play at 138K, 147K, and possibly 160K+
if the tempo flows like Nov ’24–Dec ’24, now Oct ’25–Nov ’25.
But if this beat breaks, 108K remains the base of the rhythm.
CRYPTO:BTCUSD doesn’t just move in price - it moves in patterns.
Listen to the rhythm, not the noise.
- Klaus | NFX Hub 💚
---------------------------
Even in critical times - it’s okay to play a little...

BTC MARKET UPDATE
🔥 **$117K-$115K Zone:** Critical hold – Strong demand area! Expect bounce-back to $127K+.It's essential for BTC to defend this level to maintain bullish momentum
⚠️ DYOR | NFA
This pullback came after a strong rally driven by institutional ETF inflows, dovish Fed signals, and seasonal "Uptober" momentum, but it's now consolidating near key support levels. The market sentiment is mixed: bullish on longer-term fundamentals but cautious short-term due to overbought conditions and profit-taking.

BITCOIN SIGNAL: NEXT TARGET REVEALED!! (scary) Yello Paradisers! Enjoy the video!
And Paradisers! Keep in mind to trade only with a proper professional trading strategy. Wait for confirmations. Play with tactics. This is the only way you can be long-term profitable.
Remember, don’t trade without confirmations. Wait for them before creating a trade. Be disciplined, patient, and emotionally controlled. Only trade the highest probability setups with the greatest risk to reward ratio. This will ensure that you become a long-term profitable professional trader.
Don't be a gambler. Don't try to get rich quick. Make sure that your trading is professionally based on proper strategies and trade tactics.
