BTCUSDT (4H) chart update !!BTC is holding above the rising trendline and trying to stabilize.
The 88,000–89,000 zone is acting as strong support, where previous bounces occurred.
As long as this support holds, upside targets remain 94,000 → 98,000 → 102,000.
A 4H close below 89K could open room for a pullback toward 85K–84K.
The overall structure remains bullish consolidation. 🚀
DYOR | NFA
Btcusdbuy

BITCOIN SIGNAL: ARE BEARS PREPARING TO CRASH BTC??????!!!Yello Paradisers! Enjoy the video!
And Paradisers! Keep in mind to trade only with a proper professional trading strategy. Wait for confirmations. Play with tactics. This is the only way you can be long-term profitable.
Remember, don’t trade without confirmations. Wait for them before creating a trade. Be disciplined, patient, and emotionally controlled. Only trade the highest probability setups with the greatest risk to reward ratio. This will ensure that you become a long-term profitable professional trader.
Don't be a gambler. Don't try to get rich quick. Make sure that your trading is professionally based on proper strategies and trade tactics.

BTC Still bullish BTC Buy Setup , entry
• Daily turned bullish
• H4 bullish – new HH, pullback to low 89K and H1 turn bullish above 90500k
• Looking for break above 93K once H1 turns bullish
• Trail toward 100K

BTC Trade Set Up Dec 12 2025Price is making HH now i will want to see it sweep SSL to then make internal 15m-5m bullish structure to continue higher to BSL

BTC Trade Plan (December 12, 2025)BTC Trade Plan (December 12, 2025)
(D1 Neutral / H4 Buy dips / H1 Locally bullish / M15 Trend)
⬛️ 1. Higher Timeframe Context (D1 and H4)
• D1 bias: neutral
• D1 range (approx): 89,000 – 94,000
• Key D1 zones:
• Supply: 93,000-94,000 tested highs
• Demand: 89,000-91,000 supports
• H4 bias: buy dips
• H4 zones of interest:
• H4 Sell Zone 1: – supply cluster/rejection
• H4 Buy Zone 1: – demand area/gap fill potential
Active setups are trend-aligned relative to D1/H4.
⬛️ 2. Preferred Setups by Horizon
🔳 2.1 Swing Setup (D1/H4)
• Idea: trend-aligned long on dips (neutral structure support).
• Time horizon: multi-day.
• Context: stable macro, neutral derivatives.
🔲 2.2 Intraday Setup (H1 focus)
• Idea: buy dips toward supports.
• Time horizon: intraday.
• Context: H4 demand zones, local bullish.
▫️ 2.3 Scalp Setup (M15 focus)
• Idea: scalp minor trends upside.
• Time horizon: minutes–hours.
• Risk: higher-risk in expansion regime.
▪️ 2.4 Arbitrage/Pairs Concept (if relevant)
• Idea: BTC dominance high, neutral vs ETH/sector.
🟩 3.1 Long Setup (Trend-Aligned)
• Execution timeframe: H1
• Trigger timeframe: M15
• Entry zone:
• Context: H4 demand, LVN support.
• Pattern tags:
Trigger conditions:
• Liquidity sweep or SFP at/under key low, then reclaim (liquidity_sweep_reclaim).
• Evidence of liquidation_spike_reversal and absorption_at_level.
• ML-Predictive (15m): upside probability ≥ downside.
• On-chain and regulatory risk not at “extreme”.
🟥 3.2 Short Setup (Counter-Trend)
• Execution timeframe: H1
• Trigger timeframe: M15
• Entry zone:
• Context: H4 supply + put-biased skew.
• Pattern tags (from pattern_library):
Trigger conditions (non-exhaustive example):
• Price trades into the H4 sell zone and forms required pattern combination (e.g., double_sweep_high + vwap_rejection).
• Orderflow: evidence of absorption_at_level and delta_divergence_high.
• ML-Predictive (15m): downside probability ≥ upside.
• Event/Regulatory risk is not “extreme” and uncertainty is not “high”.
🔴 4. Stops (Invalidation Levels)
Long setups:
• Stop: 88,000.
• Logic: break of H4/H1 key low/demand invalidation; idea is wrong below this level.
Short setups:
• Stop: 95,000.
• Logic: break of H4/H1 structural high or OB invalidation; idea is wrong above this level.
🟢 5. Targets
Long:
• TP1: 93,000 – local HVN/VWAP or M15/H1 level.
• TP2: 94,000 – H4 supply/OB retest.
• TP3 (optional): 95,000 – extended D1 objective (HVN).
Short:
• TP1: 91,000 – intraday HVN or VWAP retest (H1).
• TP2: 89,000 – H4 demand / LVN void.
• TP3 (optional): lower – extended D1 objective (gap fill).
⬛️ 6. Position Sizing
• Baseline risk:
• Trend-aligned setups: typically 1.0 (relative unit).
• Counter-trend setups: ≤ 0.5 (relative unit).
• Adjust up/down using:
• high volatility_context, normal onchain_risk_profile.risk_level, normal sentiment_state.sentiment_risk, normal anomaly_state.manipulation_risk, overall_event_risk normal, uncertainty.level medium, trade_readiness.status ok_to_trade.
Final recommended relative risk per setup: 0.8 for trend long, 0.4 for counter-trend short.
⬛️ 7. Risk Flags
• Thin liquidity and high slippage risk
• Macro headwinds (DXY flat, NQ flat)
• Elevated regulatory risk (bank competition news)
⬛️ 8. Flip Conditions
• For long bias → bearish flip:
• Close below 89,000 with sell delta, failed demand.
• For short bias → bullish flip:
• H4 close above 94,000 with rising OI, positive delta, and acceptance above the OB cluster.
⬛️ 9. Alternative Scenario
Reject highs with range_high_rejection, short direction entry 93,000-94,000, stop 95,000, targets 89,000-88,000, differs as bear continuation vs base range grind.
⬛️ 10. Model Self-Critique
• Main assumptions: stable macro, neutral derivatives/on-chain.
• Main vulnerabilities: regulatory shifts, large whale flows.
• Behavioural risk notes: do not average into losers, do not increase leverage beyond a safe threshold.
⬛️ 11. Uncertainty and Constraints
• Uncertainty level: medium.
• Avoid high leverage, require strict pattern confirmation before entry, limit the number of trades.

Bitcoin: Steps to GrowthIn recent days, Bitcoin has been shaping a picture of gradual ascent after a period of uncertainty. The movement consists of alternating short impulses and pauses, creating the impression of energy accumulation for further development.
The chart shows that the market is holding the price in the upper part of the range, while downward fluctuations lack sufficient strength to change the overall direction. This configuration indicates that buyers maintain the initiative, even if growth is unfolding step by step.
As a result, Bitcoin is showing signs of forming an upward wave, where further movement will depend on the market’s ability to consolidate above current levels and confirm the strength of the impulse.

GET READY FOR BITCOIN HIGH PROBABILITY LONG SETUP SOON!!!🚨BTC HIGH PROBABILITY BUY SETUP 🚨
* Here We Can See Clearly The Next Potential Moves For BTCUSD Coming Hours/Days.
* Keep Your Eyes Close On Your Trading Positions.
* Happy PIP Hunting Traders.
FXKILLA.

Looking For BTC TO Make a new HighBTC Buy Setup (Post-FOMC)
• Daily turned bullish
• H4 bullish – new HH, pullback holding 92K
• Looking for break above 93K once H1 turns bullish
• Trail toward 100K
• Market reacting positively after today’s FOMC

BTC Trade Secures 3800 pipsPrice swept external BSL which i expected price to pushdown to lower SSL which played out perfectly now i will want to see bullish structure from where its at or to come down lower to sweep SSL before continuing higher

BITCOIN SIGNAL: FOMC MEETING WILL PUSH BTC TO HERE!!!? (warning)Yello Paradisers! Enjoy the video!
We are discussing a lot of technical stuff—Elliott Wave theory. We are going through multiple time frames, and I'm updating you about the price action, development structure, and important levels, as well as what the highest probability next move is.
And Paradisers! Keep in mind to trade only with a proper professional trading strategy. Wait for confirmations. Play with tactics. This is the only way you can be long-term profitable.
Remember, don’t trade without confirmations. Wait for them before creating a trade. Be disciplined, patient, and emotionally controlled. Only trade the highest probability setups with the greatest risk to reward ratio. This will ensure that you become a long-term profitable professional trader.
Don't be a gambler. Don't try to get rich quick. Make sure that your trading is professionally based on proper strategies and trade tactics.

CAN BTC HIT MY TARGET 10,000$ ? BULLISH CHANNEL BTCUSDGreetings 👋
Bullish Setup On Btcusd
A Strong Bullish Channel On BTC On High Time Frame Daily We Are Expecting A Target Of Btc Is 10,000$ Letss Gooo
94,000 / 95,000 Market Rejects Many Time But Now its Want To Break And Keep Moving Up Side To Hit Our Target 🎯

BTC/USD – Bearish Reversal Setup with Defined TargetsBitcoin is showing signs of weakness after rejecting the upper resistance near $94,652. Price is currently trading below the mid-range zone, and if bearish momentum continues, we could see a move toward the lower support levels.
Entry Zone: Around $92,218 – $92,329
Invalidation Level: Above $94,652 (setup fails if price breaks this level)
Targets:
Target 1: $90,028
Target 2: $88,297
Target 3: $86,513
This analysis is based on resistance rejection and trendline support structure. Always apply risk management and position sizing.
DISCLAIMER : I AM NOT A FINANCIAL ADVISOR EDUCATIONAL PURPOSE ONLY

Bitcoin: Consolidation as a Starting PointBitcoin (BTCUSD) is gradually showing signs of revival after a period of consolidation. The upward movement is becoming more pronounced, while pullbacks remain moderate, reflecting buyer interest and the market’s readiness to develop a new wave.
The chart reveals a sequence of advances that form the foundation for trend continuation. The structure indicates energy accumulation and a gradual strengthening of the bullish impulse.
Fundamental factors also support the asset: interest in cryptocurrencies remains, and expectations of further adoption of digital solutions reinforce buyer positions.
As a result, BTCUSD is in the zone of forming a new scenario, where the next breakout of key levels will be the decisive moment for the direction of further movement.

btc live tradeHello friends
Given the sharp upward movement we had, you can see that the sellers have made a high, which increases the possibility of a price correction, and we can witness a price increase in the price correction until the specified targets are reached.
This analysis is purely from a technical perspective and is not a buy or sell recommendation, so please observe risk and capital management.
*Trade safely with us*

“Bitcoin / U.S. Dollar” (BTC/USD) on the 4‑hour timeframe from B1. Price Movement: The candlestick pattern indicates an ascending trend channel (blue lines) with a recent breakout above the upper channel line (circled area), suggesting bullish momentum.
2. Target Point: A red horizontal line marks a target at 95,919.5, implying the expected upside if the bullish move continues.
3. Support Zone: A red shaded rectangle highlights a demand zone between 85,755.8 and 88,210.8, acting as a key support level.
4. Green Rectangle: Represents a potential profit zone extending from approximately 88,210.8 to the target 95,919.5, indicating an expected price surge.
5. Current Price: BTC/USD is trading around 92,089 (as of 02:50:26), sitting above the support and aiming for the target.
6. Analysis Implication: The setup suggests a bullish continuation after the breakout, with traders likely watching for sustained movement above the channel to confirm the upward run toward the target, while keeping an eye on the support zone for any reversal🚀📈

BTC updates📌 Bitcoin Technical Analysis
🔻 Support Levels:
• 90,850 – First key support; holding above this level keeps short-term bullish structure intact.
• 88,650 – Major support; a breakdown could increase selling pressure.
• 85,907 – Strong support zone; losing this level would significantly weaken the bullish trend.
🔺 Short-Term Resistance:
• 93,539 – Immediate resistance; a breakout above this level may open the way for higher targets.

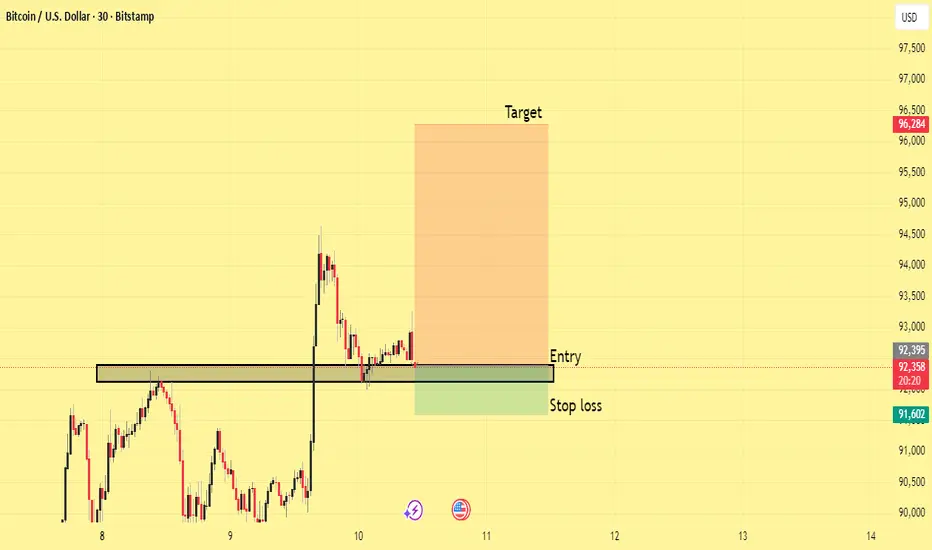
BTCUSD Long Setup: Demand Zone Retest with High R:R PotentialThis setup highlights a potential long opportunity on BTCUSD following a clean retest of a key demand zone. After a sharp impulse move upward, price pulled back into a previously established support block, confirming it as a valid re-accumulation area. The market respected this zone with multiple rejections, signaling buyer interest.
The entry is positioned directly on the retest of the demand zone, aligning with structure and maintaining a favorable risk-reward profile. The stop loss is placed safely below the zone to account for volatility and prevent premature invalidation. The target aims for a continuation toward the next liquidity pocket above, reflecting the expectation that buyers will reclaim control and push price higher.
This idea leverages market structure, zone retest, and momentum recovery to outline a disciplined, high-probability long setup
Ascending triangle formation indicates a bullish outlook for BTC#BTCUSD BITSTAMP:BTCUSD BINANCE:BTCUSDT
From the 4H chart, BTC's short-term trend has formed an ascending triangle pattern, which is a typical bullish pattern. Short-term resistance is located at 93500-94500, a break above this level would likely lead to further gains. The key support level to watch is 88000-87500. If the price retraces to this range, we can consider going long on BTC.
Selena | BTC/USD – Trend Channel + Strong Demand ReactionBITSTAMP:BTCUSD
Bitcoin is trading inside a rising parallel channel, with price recently reacting cleanly from the strong demand zone at 90,200–90,700, aligning with channel support. Liquidity was taken below the lows, signalling possible continuation to the upside.
🔼 Bullish Scenario
If BTC holds above 90,200, we may see upside continuation:
🎯 Target 1 → 94,200 – BSL zone
🎯 Target 2 → 96,800 – 97,900 top resistance zone
🎯 Target 3 (Breakout case) → 98,500+
A sweep of intra-day liquidity followed by bullish BOS can provide confirmation.
🔽 Bearish Risk / Invalidation
Break & close below 89,900 could open deeper flow into liquidity below:
⚠️ Downside levels → 88,000 → 86,500 → 81,000 support base
⚠️ This chart is for educational purposes only — not financial advice.

BTC Bullish Setup Identified – My Trade Plan📌 Bitcoin has successfully formed a bullish setup on the 1H time-frame. Based on current price behavior and structural support levels, I am entering this trade with a clear and disciplined plan.
🟩 Entry Zone
₹ 91,200 – 91,500
Price is currently respecting this demand zone, showing signs of absorption and potential upside reversal.
🔰 Stop Loss
₹ 90,000
Clean invalidation level below the support.
If this breaks, bullish structure is gone — so SL is fixed.
🎯 Target
₹ 93,500
This aligns with previous resistance and the next liquidity pool.
Once price reaches this zone, I’ll book profits.
⸻
📈 Summary
• Setup Type: Bullish Reversal
• Entry: 91,200–91,500
• SL: 90,000
• Target: 93,500
• Risk–Reward: Attractive & disciplined
⸻
BTC is preparing for a bounce — waiting for confirmation and executing with proper risk management. 🚀📊

Bitcoin Price Prediction: Recovery To $100,000 Could Be Tainted Bitcoin’s price is at $90,399 at the time of writing, sitting just below a downtrend that has persisted for one and a half months. BTC is attempting to flip $90,400 into a support level, which would mark the first step toward reversing the trend.
If macro conditions align and rate cuts revive broader market optimism, BTC could rebound sharply. A clean bounce from $90,400 may drive a retest of $95,000, and breaking that resistance would open a clear path toward the long-anticipated $100,000 level.
However, if short-term holders sell into strength, Bitcoin may struggle to maintain upward pressure. A rejection from $95,000 or failure to break the downtrend could send BTC back toward $86,822, invalidating the bullish scenario.

“BTCUSD 1H — Range Support Buy Targeting Range High Liquidity1. Market Structure (1H BTCUSD)
Overall structure: Still range-bound / corrective, not a clean trend.
Price is trading inside a rising channel but momentum has weakened.
We recently rejected from the upper mid-range, not from the absolute highs — that matters.
Interpretation:
This is consolidation after a strong move, not distribution yet — but buyers are no longer aggressive.
---
2. Key Zones (Very Important)
🔴 Demand / Support Zone (Red Box)
Roughly 85,000 – 86,800
Multiple reactions here → high-quality demand
Liquidity + prior structure low + channel support
If price enters this zone and holds:
→ High-probability bounce / long setup
If this zone breaks cleanly (1H close below):
→ Structure fails → expect accelerated sell-off
---
⚫ Resistanc…
“BTCUSD 1H — Range Support Buy Targeting Range High Liquidity”

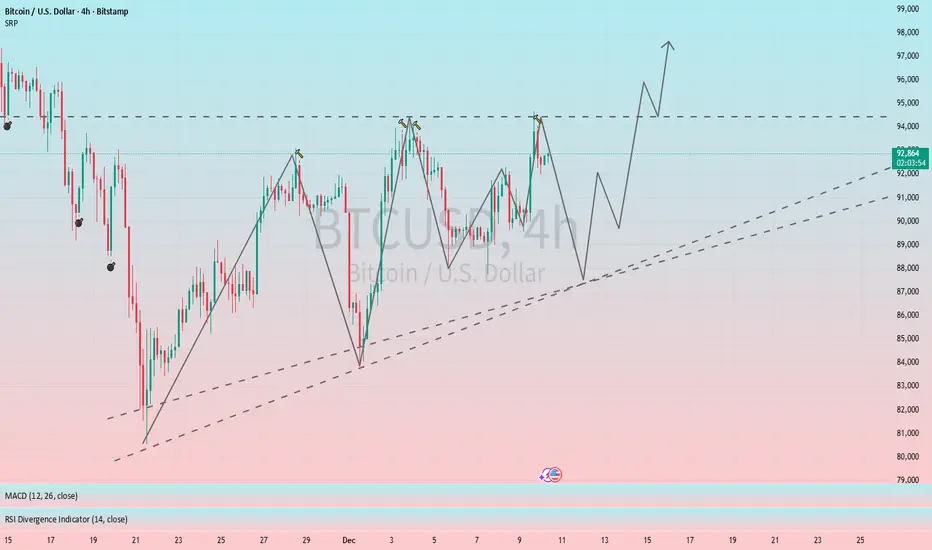
Bitcoin: Critical Levels Ahead, $106k or $65kHi guys!
The current BTC structure displays a textbook Three Drives Pattern, followed by visible momentum weakness. After the first, second, and third drives completed, price failed to create higher highs, confirming exhaustion. This aligns with the RSI divergence, which began forming during the second and third drives.
Price has now pulled back into a key decision zone. Two scenarios stand out:
Bullish Scenario
If BTC breaks and sustains above 94,393 USD, it would signal renewed strength. This could trigger a continuation toward the upper supply zone around 105,000–110,000 USD, where previous rejection occurred.
Bearish Scenario
Failure to break higher and instead falling below 82,000–83,000 USD opens the path toward deeper retracement. A breakdown confirms the distribution phase after the three drives, exposing the broader support area near 74,500 USD and potentially down to 65,445 USD, which aligns with historical demand.
Disclaimer: As part of ThinkMarkets’ Influencer Program, I am sponsored to share and publish their charts in my analysis.
