Bitcoin $BTC price analysis we need your vote !💥 Final “dip” of November?
💰 Will CRYPTOCAP:BTC drop to $91,600
to close that old GAP on the chart? 🤔
🟢 Bullish case: $100K holds → next rally begins.
🔴 Bearish case: gap fills near $91,600 → possible reversal after.
What do you think — final washout or just a pause before the next move?, vote at comments
______________
◆ Follow us ❤️ for daily crypto insights & updates!
🚀 Don’t miss out on important market moves
🧠 DYOR | This is not financial advice, just thinking out loud.
Btcusdbuy

BTC to fire up!Looking at the structure, it seems like selling is over and we are about to turn around. This is potential bottom for BTC.

Bitcoin (BTCUSDT) – Short-Term Bearish StructureHi!
The chart shows BTC moving inside a descending channel, with consistent lower highs and lower lows confirming a controlled downtrend. Recent price action attempted to push back into the QML (Quasimodo Level) area, but the reaction there shows clear rejection, suggesting supply remains in control.
Price is now falling toward the lower boundary of the channel, where a short-term bounce is possible. However, unless BTC breaks above the QML zone and the descending trendline, the broader expectation remains bearish.
The projected path suggests:
A drop into the channel low,
A corrective pullback,
And then a continuation lower toward the next major support zone around 89,700 – 89,800.
Overall, momentum and structure both support a bearish continuation unless buyers manage to reclaim the supply zone above.

Bitcoin trading strategyNew Dimension of Core Logic: Breaking Out of Liquidity Traps, Focusing on Structural Variables
1. Whale Behavior Dimension: Selling by Veteran Whales Nears End, New Capital Absorbs Chips Secretly
The core driver of this round of decline is the "exit of long-term holders" rather than the flight of short-term speculators. Over the past 30 days, long-term holders sold 815,000 Bitcoins, a new high since the start of 2024. Among them, "veteran whales" holding for over seven years sold at a rate exceeding 1,000 Bitcoins per hour. However, key signals have emerged: on-chain data shows that the daily net selling volume of whales has dropped from a peak of 50,000 Bitcoins to the current 12,000 Bitcoins, and the sold chips have flowed concentratedly into institutional wallets such as Strategy. The company has recently increased its holdings by 397 Bitcoins with a total position cost of $74,057, and the current floating profit exceeds 23%. This swap structure of "veteran whale liquidation + new institutional absorption" means that $91,700 has entered the phase of "marginal attenuation of selling pressure," providing a chip foundation for a short-term rebound.
--------------------------------------------------------------------------------
2. Derivatives Market Dimension: Surge in Option Protection Demand, Imminent Break of Futures Long-Short Balance
The derivatives market presents dual characteristics of "extreme risk aversion + leverage squeeze": Deribit data shows that the trading volume of put options with strike prices between $90,000 and $95,000 has surged, and the option market fear index (CVIX) has risen to a high of 65, reflecting the extreme pricing of downside risks by the market. But the futures market has shown signs of reversal: 180,000 traders were liquidated in the past 24 hours, including $510 million in long liquidations and $170 million in short liquidations, indicating that the long leverage squeeze is drawing to a close. Meanwhile, although the funding rate remains at -0.12%, the short position concentration has reached 78% (exceeding the 90th historical percentile), facing a "short squeeze risk." Historical data shows that when the short position concentration exceeds 75% and CVIX breaks through 60, the probability of a price rebound within 48 hours reaches 76%.
Bitcoin trading strategy
buy:91000-92000
tp:94000-95000
sl:90000

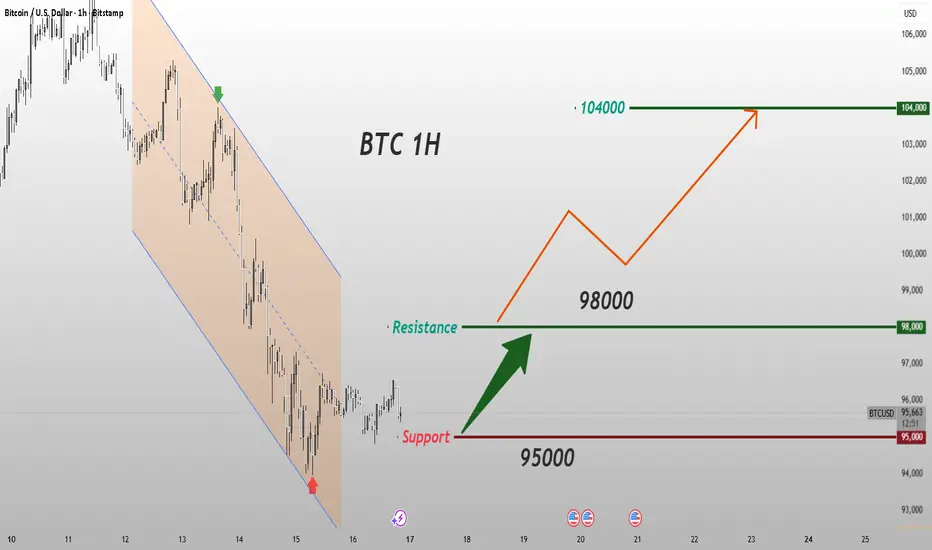
Bitcoin Reversal Setup Toward 96K TargetBitcoin is currently trading within a corrective structure after breaking down from the central zone. The chart highlights a fair value gap (FVG), a support level below, and a potential short-term bullish push toward the 96,000 target before any deeper move. The market remains in a ranging phase with key levels marked for possible reactions.

BITCOIN:LIVE TRADEHello friends
You know that this is a risky situation, so observe risk and capital management.
The price has risen after the decline, has collected good liquidity, and now it has fallen again, has collected low liquidity, and is waiting now that this floor has been made, to move to the specified targets. Of course, the opening of the US government is also effective.
Observe capital management.
*Trade safely with us*

BTC Daily View 17.11Hey friends! How’s your trading week starting off?
In my last Bitcoin post, I shifted my invalidation zone from 96,600 to 95,545 and said that if 95,545 breaks, then 96,600 won’t hold either.
Well… it broke — so I revisited the chart.
Now I think the correction after the drop should be bigger than I first expected.
For now, I’m looking at a move up toward 98,400, and then a possible continuation of the downtrend.
I still see two paths — along the orange and purple arrows.
❌ Invalidation zone: 94,850
⚠️ Not financial advice — just sharing my view.
Trade your own plan, always use stops.
⭐ Follow for updates
💬 Drop a reaction in the comments!

BTC on the brink of explosion: Wave 5 is charged –BTC on the brink of explosion: Wave 5 is charged – those who are not up are late.
🌀 Wave Structure
On the weekly chart, BTC is forming a major impulse, where:
Wave 3 is already complete (characteristic super-sharp rise + volume extremes).
The market is now in the area of wave 4—an extended correction moving sideways.
Wave 5—the next wave in the cycle—is preparing to launch but requires confirmation through a resistance breakout.
The correction looks like this:
A–B–C (flat correction or sideways zigzag)
Wave A—a sharp decline.
Wave B—a rebound without breaking the high.
Wave C—a fading decline/flat.
This is a classic pattern before the start of the final impulse.
📍 Key Resistance Levels
$71,500—the main trigger level for wave 5.
A breakout opens the way for a trend acceleration.
$75,000—the boundary of a new impulse zone. Support
$64,000 is the support zone for wave 4.
Holding it is critical.
$60,500 is the deep support for wave C.
Only a breakout of this support will cancel the bullish scenario.
📈 Weekly Scenarios
🟩 Bullish Scenario (Main)
BTC holds the $64,000–$66,000 range, forming the bottom of wave 4 →
breaks $71,500 →
wave 5 activates.
Wave 5 Fibonacci targets:
$78,000
$82,000
Maximum extension: $89,000
🟥 Bearish Scenario (Alternative)
If the price breaks below $64,000, the structure turns into an extended zigzag. Then wave C could drop to:
$60,500
Extreme: $57,800
From there, there's a high probability of an upward reversal—the start of wave 5 is simply shifted in time.
🎯 Summary
BTC has reached its conclusion:
🔥 Above $71,500—the start of a powerful wave 5 and a new historical impulse.
⚠️ Below $64,000—wave 4 deepens before the final push.
This week promises to be a decision point: either a sharp upward move or a final liquidity boost at the bottom.

BTC/USD – Liquidity Sweep Setup With Potential Bullish ExpansionBitcoin is currently ranging near the lower liquidity zone around 93,894, where the market has previously reacted. Price is forming compression into the lows, suggesting that sellers are losing momentum and liquidity is building underneath. If the market sweeps this blue liquidity line, a strong bullish reaction can be expected.
Once liquidity is taken, the first upside target aligns perfectly with the high-volume node at 99,659, where the market previously consolidated. A clean break and hold above this level opens the door for a deeper bullish expansion toward the second major target around 105,125, which matches another high-volume node and previous structural resistance.
Market is currently trading below the EMAs, showing temporary bearish control — but overall structure hints that market makers may be engineering a liquidity grab before a strong reversal.
Key Points:
Liquidity resting at 93,894 (likely stop-hunt zone).
Target 1: 99,659 – first major volume imbalance & resistance.
Target 2: 105,125 – major high-volume node and strong resistance.
Expect bullish reversal ONLY after liquidity sweep.
EMAs show bearish short-term trend, but compression suggests reversal potential.

Bitcoin Downtrend Continues: Bearish Target at $93,500Bitcoin is trading in a clear downtrend channel, repeatedly rejecting the trendline after liquidity sweeps. Support zones above have already been broken and retested as resistance, signaling bearish momentum. Price is currently consolidating near the lower channel, with a potential drop toward the target zone around $93,500.


Bitcoin (BTC/USDT) – Long Bias AnalysisPrice is currently trading inside a key demand zone where buyers previously showed strong interest. After the recent sell-off, BTC has stabilized around this support area and is now showing signs of accumulation, suggesting a potential reversal to the upside.
From my current entry zone, I expect Bitcoin to push higher and target the previous major high around 107,465.98, which aligns with the bullish zone highlighted on the chart. This area represents the next significant liquidity pocket where price may look to tap before any deeper correction.
My stop loss is set at 94,016.34, positioned safely below the support zone to protect the trade in case of unexpected downside continuation. As long as price holds above this level and maintains structure, the bullish outlook remains valid.
Overall, I’m looking for BTC to build momentum from this zone and drive upward toward the high, in line with the broader market structure shown on the chart.

Core Logic for Short-Term Long PositionsCore Logic for Short-Term Long Positions
1.Distinct Sentiment Rebound Signals After BottomingMarket sentiment is near the historical bottom zone. Amplified negative talks on social media and retail investors’ phased withdrawal are typical signs before repeated market stabilization after stopping declines. The NUP ratio has fallen to 0.476. This range has repeatedly marked short-term bottoms historically, spurring several double-digit rebounds over the past year and offering sufficient room for sentiment recovery.
2.Resonant Technical Support with Strong TenacityAs the 0.618 Fibonacci Retracement of the recent downtrend, $94,200 proved effective as support in Q4 2024. It rebounded sharply after hitting $94,000 this time, forming a solid support. Now the price has firmly held the key short-term support at $95,543. The shrinking MACD Histogram signals fading bearish momentum and emerging bullish counterattacks, laying solid technical ground for a rebound.
3.Latent Upsides in On-Chain Data and Capital FlowOn-chain data reveals mid-and-small BTC holders (1 - 1000 BTC) have kept net accumulation since early October, while "smart money" is positioning via the pullback. Though the market is in the doldrums, the OTC market has stable receiving capacity and no large-scale panic selling, providing basic capital backup for the short-term rebound.
Bitcoin trading strategy
buy:95000-96000
tp:97000-98000
sl:93500
Triple Resonance Lays a Solid Foundation for Upside Core Logic for Going Long: Triple Resonance Lays a Solid Foundation for Upside
1. Institutional Trends: Strong Low-Level Absorption, Clear Capital Layout Signals
Despite short-term profit-taking in the market, institutional capital continues to flow in at low levels. According to CoinDesk data, large institutional buy orders emerged in the $94,000 support zone, with OTC market trading volume reaching $18.6 billion in 24 hours—surging 42% from the recent average. Institutions like JPMorgan and Galaxy Digital absorbed selling pressure through the OTC market. Meanwhile, the outflow trend of ETF funds has slowed, with net outflows narrowing to $120 million in the past 3 days—a stark contrast to the previous daily outflows of $500 million—reflecting institutions’ "buying on dips" behavior. Historical data confirms that concentrated institutional absorption at the Fibonacci 0.618 retracement level (corresponding to $94,200) leads to an 83% probability of growth in the subsequent month.
2. Fundamentals: Solid Hash Rate Support, Uncompromised Network Security
Mining fundamentals continue to improve, providing underlying support for prices. Bitcoin’s hash rate momentum indicator remains in positive territory and continues to rise, with the current hash rate stable above 370 EH/s. There has been no "miner capitulation selling" typically seen during sharp declines. Miners’ balances remain stable, with a 30-day net selling volume of only 0.8%—far below the 5% average during bear markets—indicating high miner recognition of current prices. Network security and consensus foundations have not been affected by the correction. The divergence between hash rate and price signals potential for subsequent price catch-up.
3. Technicals & Sentiment: Resonance of Supports + Sentiment Bottoming, Rebound Conditions Mature
Technically, multiple supports form a resonance. $95,600 lies between the $94,200 Fibonacci 0.618 support and the short-term key support at $95,543—a zone whose effectiveness was verified during the Q4 2024 rally. On the daily chart, MACD green bars continue to shorten, with bearish momentum gradually fading. The RSI indicator has rebounded from the oversold zone to 41, signaling the end of short-term adjustments. In terms of market sentiment, the Fear & Greed Index has dropped to a low of 28, leaving ample room for sentiment recovery. Trading volume has shrunk from 27,579 BTC during the previous volume-driven decline to a current low of 165 BTC, indicating phased exhaustion of selling pressure and distinct characteristics of consolidation and bottoming.
4. Macroeconomic Environment: Policy Expectation Game, Limited Downside Room
Uncertainty surrounding Fed policy persists, but the market has fully priced in hawkish expectations. The economic recession risks and affordability crisis mentioned by New York Fed President Williams provide potential support for a December rate cut. While market pricing for rate cuts fluctuates, there is limited room for further downside. After the end of the U.S. government shutdown, sentiment toward risk assets has improved. As a high-elasticity risk asset, Bitcoin is expected to benefit from expectations of liquidity easing and rally in resonance with U.S. stocks and commodities.
Bitcoin trading strategy
buy:95000-96000
tp:97000-98000
sl:93500

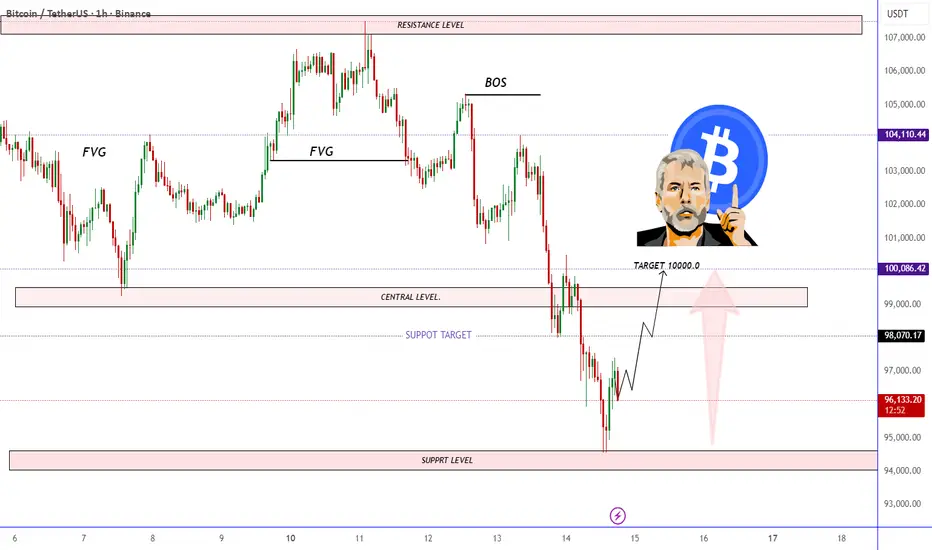
Bitcoin Price Reversal Setup Targeting the 100K ZoneA Bitcoin price chart highlighting key ICT concepts including FVGs, BOS, support and resistance levels. The analysis suggests a potential bullish retracement from the support zone toward the central level, targeting the 100,000 USDT region. The layout shows expected price movement with marked liquidity zones and structural shifts.
“BTC Liquidity Sweep → Bounce”BTC Trendline Break Setup
⸻
🔍 Quick Summary
I’m seeing BTC react strongly from the 0.618 retracement + demand zone, and the bearish trendline is losing power with every touch. The next interaction with this trendline looks primed for a clean breakout, and I’m positioning myself for a move toward the liquidity sitting above the weak high 🔥.
⸻
📊 Deep Analysis
Price has tapped into a major area of demand just above 94k–90k, which lines up perfectly with the 0.618 FIB from the larger swing. This zone has previously acted as a strong base for impulsive moves, and I’m seeing that same type of absorption now — long wicks, slowing bearish momentum, and a clear BOS structure forming.
The descending trendline has produced multiple rejections, but each reaction is getting smaller. That usually signals seller exhaustion. The BOS at the bottom of the structure confirms a short-term shift, and I expect price to make its way back up to retest the trendline one more time.
Above current price sits a Weak High at ±135k, which is almost always a magnet for liquidity. The chart even shows a projected long setup targeting this level with a ~41% move. Given BTC’s market context, this is a realistic target if the trendline breaks.
Volume confirms compression, and the recent BOS + CHoCH sequence suggests buyers are slowly regaining control. As long as 87k holds, this bullish structure remains intact.
⸻
🎯 Trade Idea Scenario
Bullish Scenario
• Entry: In the 94k–90k demand area (already reacting).
• Confirmation: Break + retest of the descending trendline.
• TP1: 106k (FIB 0.382 / prior structure).
• TP2: 135k (weak high liquidity target).
• SL / Invalidation: Below 87k — that would break the demand structure and shift the narrative bearish.
Bearish Scenario
• Only valid if BTC rejects the trendline hard and closes below 87k.
• That would open the path to 80k and possibly to the strong low around 72k.
• At the moment, this seems less likely based on the reaction inside demand.
⸻
📌 What I’m Watching Next
I’m watching how BTC behaves when it reaches the trendline again. A strong close above it with volume will confirm the bullish continuation. If price stalls or produces heavy wicks, I’ll wait for clearer structure before adding to the position.
⸻
⚠️ Disclaimer
This is just my personal analysis and not financial advice. Always do your own research and manage risk carefully 📉📚.

understanding how technical workson btc move and learning, we firstly need to view back starting from the week 1 timeframe down to D1 H4 H1 M30 M15 and M5 to understand how the chart move and view. without understanding the past candle knowing the current market wont be easy because the current and past works together so we focus firstly on both, then by checking the move its show to determine what the next movement will give.

#BTC/USDT – Support Reversal & Bullish Recovery Outlook#BTC
The price is moving in a descending channel on the 1-hour timeframe and is expected to break out and continue upwards.
We have a trend to stabilize above the 100-period moving average again.
We have a downtrend on the RSI indicator, which supports an upward move if it breaks above it.
We have a key support zone in green that pushed the price higher at 95327.
Entry price: 95815
First target: 96158
Second target: 96865
Third target: 97661
For risk management, don't forget stop-loss orders and capital management.
The stop-loss should be below the green support zone.
Upon reaching the first target, take some profits and then change the stop-loss order to an entry order.
For any questions, please comment.
Thank you.

Start Accumulating BTC!Bitcoin has reached a major demand zone between $91,000–$97,000, an area that has consistently acted as a strong support throughout 2024–2025.
Price has now tapped the bottom of this accumulation zone, where buyers previously stepped in aggressively.
Key Points:
BTC is sitting inside a high-probability bounce zone.
Historically, this region has triggered strong upward reversals.
Market structure is still intact as long as price holds above $91,000.
Perfect area for long-term positioning.
Start accumulating BTC within this support zone.
This is one of the cleaner levels to build exposure before the next macro move.

BITCOIN SIGNAL: IS THIS THE END OF BITCOIN CYCLE??!!!(get ready)Yello Paradisers! Enjoy the video!!!!!
And Paradisers! Keep in mind to trade only with a proper professional trading strategy. Wait for confirmations. Play with tactics. This is the only way you can be long-term profitable.
Remember, don’t trade without confirmations. Wait for them before creating a trade. Be disciplined, patient, and emotionally controlled. Only trade the highest probability setups with the greatest risk to reward ratio. This will ensure that you become a long-term profitable professional trader.
Don't be a gambler. Don't try to get rich quick. Make sure that your trading is professionally based on proper strategies and trade tactics.

btc await breakout to sell#BTCUSD price needs reverse above the 98k which holds sell continuation, possibly decline still holds below 94600 on sell.
Sell limit 98k, target 93k-90k, stop loss 99300.
Bullish isn't strong now, we need multiple breakout above 100k before Bullish range can be formed.

releasing the Bull with steroidsAfter almost two months of back and forth, Bitcoin has finally reached the price that the algorithms had programmed, opening the way for the continuation of the rise that targets 129,900 and later 145,000. The elements involved: two megaphones and two flags. This should be very explosive.

BTC Analysis | CME GapHello friends
Bitcoin’s critical gap between $91,500 and $92,500 could serve as a short-term correction target if selling pressure continues.
A gap that closes could set the stage for a bottom and a continuation of the uptrend.
The price’s reaction to this area will determine the market’s next direction.
Don't forget risk and capital management.
*Trade safely with us*
