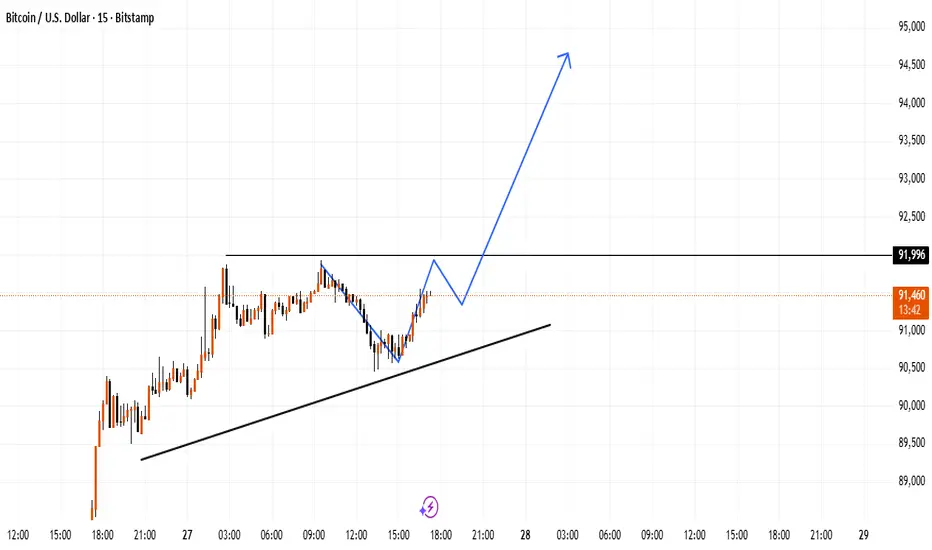
BTC Price Watching Key Barrier and Rising SupportThe chart highlights a rising support line guiding recent movement, while a horizontal zone near the top acts as a key barrier.
If price continues respecting the upward structure, momentum may build once this upper level is cleared with strength.
Btcusdbuy
Bitcoin Analysis October 2025Bitcoin faced correction after last flash crash where bitcoin had 10% pullback, and it now has nice rally to the upside. Fixed volume range showed accumulation of buying orders. I expect price to push to the previous high on the left.

BTCUSDT (bitcoin) toward $91k?Hi!
BTC has finally broken its major descending trendline, signaling a shift in market sentiment after a long period of selling pressure. Following that break, price formed a clear inverse head and shoulders pattern, showing that buyers stepped in aggressively after the final liquidity sweep at the Head. Since then, BTC has been moving inside a well-defined ascending channel, consistently printing higher highs and higher lows, which confirms bullish momentum.
As long as price respects the lower boundary of this channel, the upside structure remains intact. The next significant resistance sits at 92,500–93,000, which also aligns with the previous breakdown zone you highlighted. This area is likely to attract sellers, making it a logical target for the current move.
Overall, the chart supports continued upside toward 93K, unless price breaks below channel support, which would weaken the bullish reversal setup.

BTCUSD: Wave Pendulum on the Verge of ReversalBTCUSD: Wave Pendulum on the Verge of Reversal
BTCUSD Wave Overview (H4/D1)
According to its wave structure, Bitcoin is completing its corrective phase and preparing to form a new impulse. Current dynamics indicate a possible end to the sideways movement and a transition to the final wave of a larger cycle.
Primary scenario: A downward impulse sequence is expected to develop after the correction is complete. Alternative scenario: If the market consolidates above recent highs, it could continue to rise, delaying the start of a new downward wave.
Idea for traders: watch for confirmation of the structure on lower timeframes and enter only after clear reversal signals appear.

BTC Consolidation Near Support With Potential Breakout SetupBitcoin is trading inside a descending channel and has recently formed support near the lower boundary of the structure. Price is currently attempting to recover toward the mid-range zone.
A sustained break above the highlighted resistance area may indicate further bullish continuation, while the downside remains limited as long as price stays above the recent support.
Market structure will become clearer once BTC chooses a direction beyond these levels.

BTCUSD – Potential CHOCH Before Bullish Continuation |SMCAThe Bitcoin market continues to maintain a strong uptrend structure. Previously, price formed a Double Top, followed by a Change of Character (CHOCH) that led to the creation of a new Higher High — confirming bullish strength.
Currently, the market has printed another Double Top, suggesting the potential for another CHOCH or short-term retracement. A move toward the Bullish Order Block (BU-OB) could provide a point of interest before the next leg higher and continuation of the overall bullish trend.
💬 Share your thoughts below — what do you think the next move will be?
👍 Don’t forget to like and follow for more structured Smart Money Concept analyses.

BTC Trade Secured 2.4%Price broke structure to the upside on the 4h, came down to sweep SSL to then buy up to BSL. The next move will want to wait for a pull back to then continue towards 93k

BTC: Bullish Trend, 900000 Breakout AheadFollowing Black Friday’s plunge, BTC’s uptrend is now confirmed—holding firmly above 85000 and awaiting a direct breakout above 90000
Buy 86500 - 87500
TP 88500 - 89000
Accurate signals updated daily. They serve as a reliable guide for trading issues – feel free to refer to them. Hope they help!

mrmoney limited BITCOIN trading ideabitcoin is in a strong bullish momentum since it tapped into our monthly demand zone giving us a overall bullish moves

HUGE SPIKE ON BITCOIN - BTCUSDBitcoin has triggered a spike and opened a trade, just as I had seen it and thought it would play out due to its price and recent highs

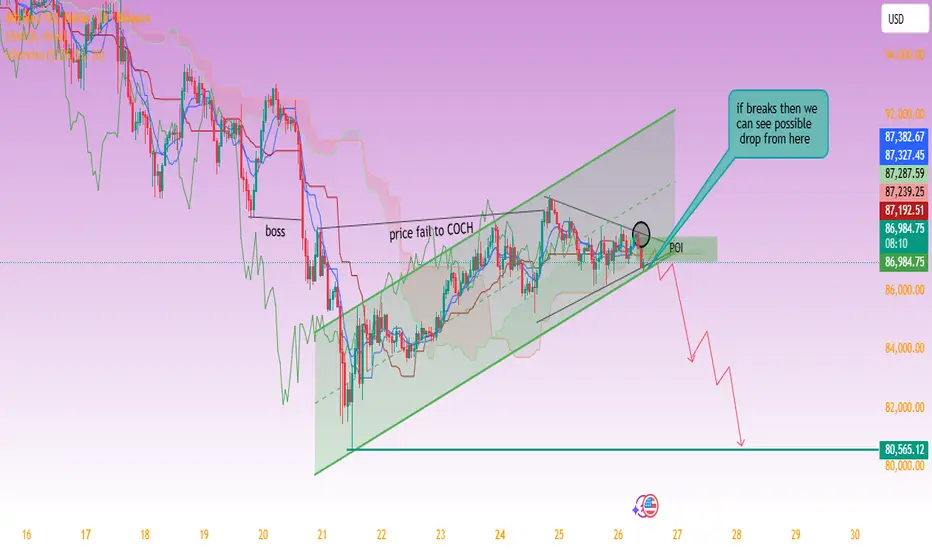
BTC Rising Channel Breakdown Setup – Bearish Continuation Possib1. Rising Channel (Bearish Structure)
Price has been climbing inside a rising wedge / ascending channel, which is typically a distribution pattern during a downtrend.
2. Price Failed to COCH (Change of Character)
You labeled “price fail to COCH” — this means buyers failed to flip the trend into bullish structure.
This is bearish confirmation.
3. BOS (Break of Structure) earlier
There was a clear BOS on the left side — confirming macro bearish flow.
4. Compression into the Channel
Price is moving slowly upward with weak momentum, forming a squeezing structure.
5. POI (Point of Interest) at the bottom trendline
You marked a zone under the trendline.
A break into this zone is where momentum shifts from bullish to bearish.
6. If Trendline Breaks → Expect a Drop
Your chart shows an arrow downwards toward 80,565 as the main downside target.
This aligns well with:
Trendline support
Ichimoku cloud weakness
Rising channel breakdown pattern
Prior liquidity levels
📉 TRADE PLAN (Bearish Setup)
This plan follows the logic of the chart you provided.
🔻 Trade Type: Short Position (Sell)
Because price is at the end of a rising wedge and showing weakness.
✨ ENTRY (Sell Entry):
86,750 – 86,600
After a confirmed break and candle close below the ascending trendline + POI.
✔ Wait for a clean break and retest of the POI/trendline.
🛑 STOP LOSS:
87,350 – 87,450
Place the stop above:
The small circle you highlighted
Last minor swing high
Ichimoku resistance
This keeps maximum SL tight and structure-based.
Risk: ~600–800 points
🎯 TAKE PROFIT (Exit Levels):
TP1 – Safe Target (Liquidity Grab)
84,800 – 85,000
TP2 – Mid Target (Channel Origin)
82,500 – 83,000
TP3 – Main Target (Your Chart Target)
80,565 – 80,000
This matches your projected drop.
📐 Risk–Reward Ratio (Approx):
If using:
Entry = 86,650
SL = 87,400
TP3 = 80,565
➡ RR ≈ 1 : 8+ (excellent)
Bitcoin (BTC/USD) Faces Key Test After Heavy ETF Outflows Bitcoin (BTC/USD) trades near $87,108 after one of its hardest months of the year. November’s drop erased more than 20% and sent price far below the $126,000 peak. This correction exposed the sensitivity of the new ETF-driven market structure. Traders now debate whether the trend weakens toward $73K, or if the bounce from $82K signals a recovery wave forming.
ETF Outflows Accelerate as Sentiment Turns Cautious
BlackRock’s iShares Bitcoin Trust saw $2.2 billion in outflows this month—its worst performance since launch. Short-term ETF holders rushed to exit after BTC fell more than 40% from the October high. Analysts like Jay Hatfield describe these flows as “gambling capital,” reacting fast to volatility.
Macro uncertainty adds fuel. Traders monitor consumer sentiment, inflation, and retail sales. Odds for a December rate cut sit above 80%, yet markets remain unsure. This pushes some investors toward gold and defensive assets.
Leverage ETFs Expand as Global Demand Grows
Europe prepares for 3x long and 3x short Bitcoin ETFs, set to list on SIX Swiss Exchange. The U.S. may soon see 5x leveraged crypto ETFs, while other regions adopt 2x and on-chain leveraged products. These tools attract active traders but raise concerns. October’s $19 billion liquidation wave showed how leverage can intensify downturns.
ETF Flow Instability Creates Sharp BTC Swings
November ETF outflows totaled $3.5 billion, with daily flows flipping rapidly. Citi Research estimates that every $1B in ETF outflows pulls BTC lower by 3.4%. November’s chart aligns closely with this model, making support levels critical.
Technical Outlook: Watching $82K and the $73K–$75K Zone
Bitcoin broke its multi-week ascending trendline, now resistance near $100K.
Support: $82K, $73K–$75K, below $70K
Resistance: $96K, $100K, broken trendline
Holding above $82K keeps a rebound alive. Losing $73K–$75K risks a slide under $70K and a deeper shift.

BITCOIN:LIVE TRADEHello friends
considering the decline we had, the sellers made a bottom and the buyers came in. The sellers again broke the previous bottom with strength and made a bottom, and the buyers came in and raised the price and succeeded in hitting a higher ceiling.
And in the pullback, the open price is supported and here we can enter a buy transaction considering the support of buyers and hitting a higher ceiling, of course with risk and capital management and be careful not to make emotional decisions.
*Trade safely with us*

BTC/USDT Building an Early Base, High Chance to Retest 93K-108+BTC/USDT — Building an Early Base, High Chance to Retest 93K → 108K+
Bitcoin is forming a stabilization zone between 80K and 93K, which could mark the start of a deeper recovery phase. The recent bounce off the lower boundary suggests that buyers may be re-entering, setting up a potential long-term trend shift.
Key Technical Points:
📉 Support Zone: The lower range around 80.6K has held, showing strong demand at these levels.
🔁 Current Structuring: BTC’s price action shows a gradual range build — this isn’t just a short-term bounce, but a possible formation of a base.
🎯 First Upside Target: A clean breakout above 93K would signal renewed strength and is likely to trigger further buying.
🚀 Extended Target Potential: If momentum confirms and volume supports the move, BTC could aim for the 100K+ region. This would align with a multi-wave recovery to reestablish higher long-term structure.
Trade Outlook:
Holders: This could be a key accumulation setup — building on strength around the base may pay off if the breakout runs.
Short-term traders: Watch for a breakout above 93K with volume as your trigger for re-entry or scaling in.
Risk: If BTC fails to reclaim 93K decisively, a retest of the 80K base is still possible.
Summary:
There’s a realistic and structurally sound scenario where BTC could recover from this base and push toward 93K, with a strong shot at going 100K+ if the breakout materializes. Conditions are setting up for a potential multi-wave uptrend, but confirmation will be critical.

BitcoinBTCUSD
- Change of Characteristics
- Completed " 1234 " Impulsive Waves
- Break of Structure
- Fair Value Gap
- Resistance Level

BITCOIN SIGNAL: BUY NOW!!!!!!!? (trap) Yello Paradisers! Enjoy the video!
And Paradisers! Keep in mind to trade only with a proper professional trading strategy. Wait for confirmations. Play with tactics. This is the only way you can be long-term profitable.
Remember, don’t trade without confirmations. Wait for them before creating a trade. Be disciplined, patient, and emotionally controlled. Only trade the highest probability setups with the greatest risk to reward ratio. This will ensure that you become a long-term profitable professional trader.
Don't be a gambler. Don't try to get rich quick. Make sure that your trading is professionally based on proper strategies and trade tactics.

BTC’s 85k-87k Range: 80k Risk or 100k Rebound Next WeekBTC plummeted to around 80,000 last Black Friday, now ranging between 85,000 and 87,000. A breakdown below 85,000 risks breaching the 80,000 support; holding above confirms a rebound, with a potential retest of 100,000 next week
Sell 88000 - 87500
TP 86500 - 86000 - 85000
Accurate signals updated daily. They serve as a reliable guide for trading issues – feel free to refer to them. Hope they help!

BTC Trade Set Up Nov 24 2025Price has shifted to bullish structure making HH/HL on the 1h and engulfed a 4h bearish candle so i am looking to hold buys up to higher BSL levels to be swept

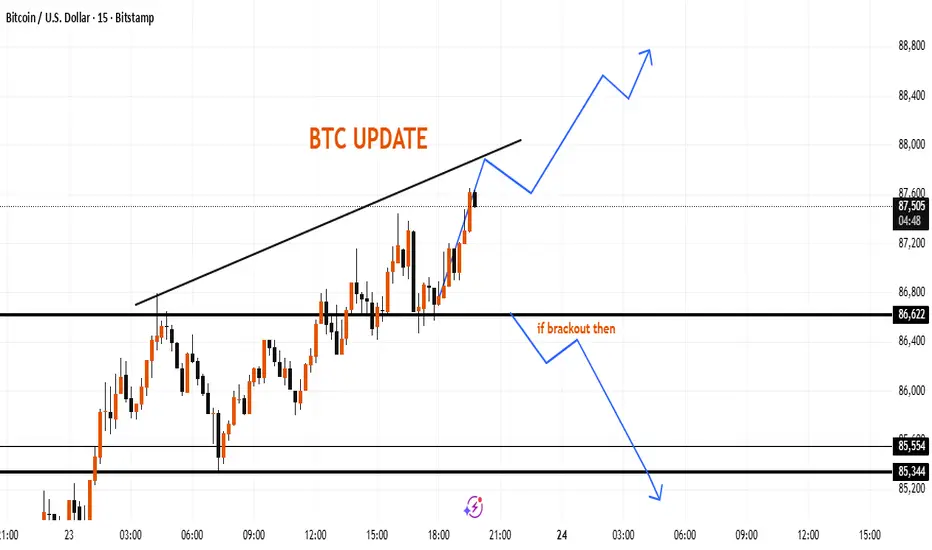
BTC Intraday Structure UpdateBitcoin is currently moving within an ascending structure, approaching a trendline that has acted as a reaction zone in recent candles. If price holds above the 87,500 area, the chart suggests the potential for continued upward momentum toward higher intraday levels.
If the market slips below the 86,620 zone, it may indicate a shift toward lower support areas around 85,550–85,340, where the chart previously showed reactions.
This update highlights the key zones to watch based on recent movement and overall short-term structure.
$BTC planCRYPTOCAP:BTC depending on weekly close I will go long or short. Reclaim trendline and I will go long. Stay below and I will short it.


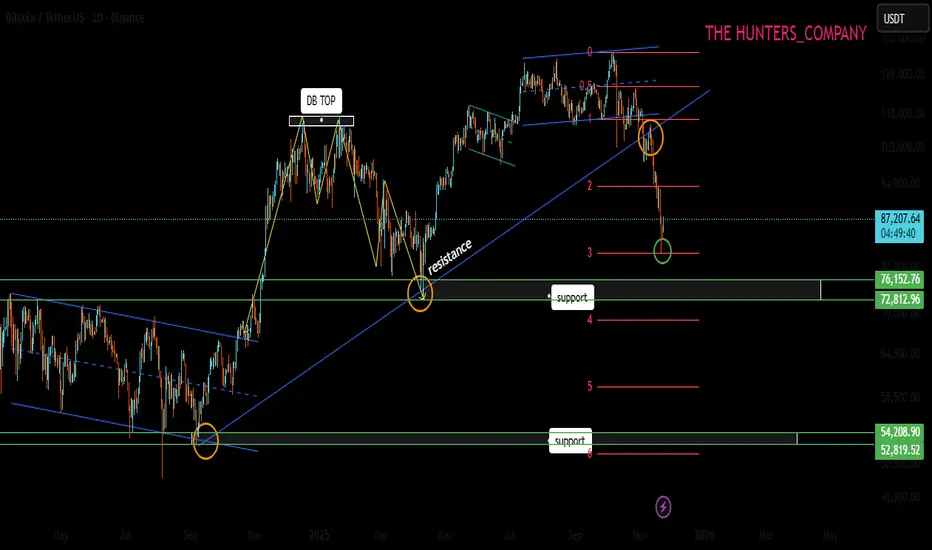
BITCOIN : Where is the price floor (full analysis)Hello friends
Well, the fall in Bitcoin has really scared the market these days, and that's why we had a sharp fall, as it turned out.
Well, if we examine the past price, you will see that there has always been an upward trend and sometimes we have had price corrections, and this is completely normal.
Before this drop, Bitcoin formed a double top pattern and the price corrected, and was again supported by the area indicated by buyers, and the price hit a higher ceiling.
But at the price ceiling, we witnessed weakness in buyers and, more importantly, a rounding of the price, which caused a heavy drop to 80,000. Now, after this sharp drop, the price is unlikely to go straight back up and make a new ceiling.
Now, after this strong spike by sellers, we can expect a descending range or channel.
What do we need to climb to?
Well, obviously the price needs to recover and buyers need to provide good support for the price, and first of all we see a range or channel, and then if they can break the channel or range, buyers can hope for a new ceiling. Otherwise, the price pivots we identified are the most important supports that the price can reach over time.
So, can we say that the rise is over?
No, nothing can be said with certainty. Maybe the price will bottom out at 70,000 to 80,000 and buyers will come in.
But in order to minimize the risk, we must move forward with the market and according to market behavior, not predict...
For this reason, it is not possible to say at this time that the price will go to a new ceiling from here because we do not see any buyers!!!
What is the solution?
Well, let's be logical: when the price goes down and Bitcoin becomes cheaper, better opportunities for buying are available to us, and we should take advantage of this situation and not enter the price ceiling emotionally and suffer losses.
Finally,
We need to see what the buyers' reaction is and if they want to support, then we can enter safely, not now that the Sharp price is falling.\
Be sure to observe risk capital management and do not get excited.
*Trade safely with us*
[WEEKLY] ANFIBO | Bitcoin BTCUSD - Downtrend? [11.24 - 11.28]Hi traders, Anfibo’s here!
BTCUSD – Technical Outlook
Overall Picture:
Last week, BITSTAMP:BTCUSD dipped into the 80,000 USD support zone, a key area that has previously acted as a structural demand region during corrective phases. The market reacted well, showing a notable bounce—though not yet strong enough to confirm a full trend reversal. Current price action remains in a broad corrective structure, and until BTC reclaims major broken levels, we treat all upward movements as retracements within a larger correction. The next week will be crucial, with clear opportunities both for strategic dip-buying and trend-continuation selling depending on how price behaves around major zones.
Weekly Trading Plan:
>>> BUY ZONE:
ENTRY: 83,000 – 85,000
SL: 80,000
TP: 96,000 → 98,000 → 102,000
(Looking to buy the retest of the previously broken structure around 98k. This is a classic “reclaim & retest” setup if momentum continues to recover.)
>>> SELL ZONE:
ENTRY: 98,000 - 102,000 (retest of breakdown)
SL: 106,000
TP: 87,000 → 80,000 → 77,000 → 72,000 → ...
(These levels align with the deeper correction targets. I will only execute these sells if BTC shows clear rejection signals, matching the purple-arrow projection.)
Risk Management:
Keep position size moderate until BTC confirms a clear trend direction.
Prioritize setups with clean invalidation points such as the 98k retest and the 76–71k demand range.
Avoid chasing price mid-range; trade only from well-defined boundaries.
Always secure partial profits once the market moves in your favor to reduce emotional pressure.
Conclusion:
BTC is showing signs of stabilizing after the bounce from 80k, but the market remains in a broad corrective phase. The plan for the upcoming week is straightforward: look to buy corrective pullbacks into the 98k retest, while also preparing to sell deeper breakdowns toward the 76–71k zone if bearish confirmation appears. Flexibility is essential—trade the chart, not the prediction.
HAVE A POWERFUL WEEK, GUYS!
