BTC slightly recovered at the beginning of the weekBTC/USD Technical Analysis – Clear and Simple Explanation for Clients
Bitcoin is currently trading around 106,000, showing a short-term bullish correction within a larger downtrend channel. The overall market structure remains bearish, but the current upward move is a retracement toward a strong resistance zone.
🔹 Key Resistance Zone: 109,500 – 111,000
This area combines several important confluences:
The downtrend line from previous highs.
The Fibonacci 0.382–0.5 retracement zone of the last bearish swing.
The EMA 200 (red line), which has acted as a strong dynamic resistance before.
Once the price reaches this zone, there is a high chance of a bearish rejection, as sellers will likely take control again.
🔹 Main Scenario:
Short-term: Price may continue rising toward 109,000–111,000.
Medium-term: If rejection occurs, we expect a new downward move targeting the next key support around 95,000–94,800 (Fibonacci 1.618 extension + previous demand zone).
Long-term: This support could become a strong buy zone for a potential trend reversal.
📊 Summary for Clients:
Current trend: Bearish channel, short-term pullback.
Resistance zone: 109,500–111,000 (possible sell area).
Support zone: 95,000–94,800 (potential buy area).
Outlook: Expect short-term rise, then possible drop before a bigger rebound.
👉 In simple terms: Bitcoin is making a temporary recovery, but the main downtrend is not over yet. Watch for a sell reaction around 109k–111k, and a possible strong bounce from 95k support later.
Btcusdbuy

#BTC/USDT Strong Surge: Heading Towards 104074 USD !#BTC
The price is moving in a descending channel on the 1-hour timeframe and is expected to break out and continue upwards.
We have a trend to stabilize above the 100-period moving average again.
We have a downtrend on the RSI indicator, which supports an upward move if it breaks above it.
We have a key support zone in green that pushed the price higher at 101236.
Entry price: 101985
First target: 102528
Second target: 103208
Third target: 104074
For risk management, don't forget your stop-loss and money management.
The stop-loss should be below the green support zone.
Upon reaching the first target, take some profits and then change your stop-loss order to an entry order.
For any questions, please comment.
Thank you.

BTCUSD: Stabilize above 105,000BTC rose to break through and stabilizing above 105,000 today, surpassing last week's short-term resistance level. Next, we will focus on whether the key resistance level at 108,000 can be broken.
We predict that Bitcoin's movement today will fluctuate within the range of 104,000-108,000. If it can sustain a breakthrough above 108,000, we expect an upward trend to emerge this week.
Buy 103,000 - 103,500
SL 102,500
TP 104,500 - 105,000 - 105,500
Sell 105,500 - 106,000
SL 106,500
TP 104,500 - 104,000 - 103,500

BTCUSD: The resistance level at 105,000 remains firmBTC rebounded above 104,000 on Friday but then came under pressure and pulled back. It traded in a narrow range between 101,400 and 104,000 throughout Saturday, which also confirms the accuracy of our prediction about the resistance level at 105,000. Bitcoin can only see sustained gains if it breaks through 105,000 and stands firmly above 108,000.

BTCUSD: Consolidation is the main theme todayYesterday, BTC saw intense battles around the psychological threshold of 100,000. During the session, it once broke below the key support at 99,500, then rebounded to around 104,000.
Today, it pulled back to around 102,000 at the opening of the Asian session and began to consolidate again.
On the upside, the 105,000-105,500 zone forms a crucial resistance range. Only a daily close firmly above this level can confirm the reversal of the short-term downtrend. For today's short-term support, we still focus on 100,000. If it breaks below 100,000, we need to pay key attention to the supporting role of 98,000.
Buy 100,500 - 101,000
SL 100,000
TP 102,000 - 102,500 - 103,000
Sell 103,000 - 103,500
SL 104,000
TP 101,500 - 101,000 - 100,500

$BTC - Critical Support at $100K | Trendline RetestCRYPTOCAP:BTC is sitting at one of the most important levels we’ve seen this year — the $100,000 psychological support zone.
After a multi-month consolidation and a sharp retest of the bullish ascending trendline that has held firm since mid-2024, Bitcoin is once again testing the structure that has defined the uptrend for over a year.
This level will determine whether the next move is a rebound back toward $109K–$126K, or a deeper pullback toward the $92K–$95K horizontal channel below.
🧭 Technical Overview
Support: $100K (key trendline) → $95K → $92K
Resistance: $109,358 → $120K → $126,296
Trend Structure: Rising wedge channel intact since 2024
Momentum: RSI hovering near neutral; previous rebounds from this trendline have led to 20–30% rallies
Volume: Declining on recent pullback — suggesting correction, not reversal
So far, every retest of this yellow ascending support has resulted in higher highs. If this pattern holds, the next target zone is between $126K–$139K, aligning with the November seasonal cycle projection.
📅 Projection Targets
November 8, 2025: $139,000 (as tracked on @Stocktwits Calendar)
January 1, 2027: $145,000 long-term extension target
This would align with the macro halving-cycle rhythm — consolidation, mid-cycle shakeout, and renewed acceleration into the next demand phase.
💬 My Take:
If CRYPTOCAP:BTC holds this $100K base and confirms a rebound above $104K, I expect renewed momentum across majors — with CRYPTOCAP:ETH , CRYPTOCAP:SOL , and CRYPTOCAP:XRP likely following.
Failure to hold $100K could open the door to a flush toward $92K before resumption, but bulls have defended this channel repeatedly for nearly 18 months.

BITCOIN HIGH PROBABILITY SETUP SOON!!!🚨 BTCUSD HIGH PROBABILITY BUY SETUP 🚨
* Here We Can See Clearly The Next Potential Moves For BTC Coming Hours/Days.
* Keep Your Eyes Close On Your Trading Positions.
* Happy PIP Hunting Traders.
FXKILLA.

BTC Is Warming Up for Its Next Big Move — Don’t Miss This Setup Few thoughts about BTC:
when you trade crypto you have to look at 4h+ time frame, daily or weekly is the best to see clean picture.
Right now BTC just touched discount( 100359)
now i can see 3 possible scenarios
1 - small pull back next week and then pump 130-140k first target
2 - price will go a bit deeper to fill weekly FVG at ~90k
3 - CRYPTO SCAM AND WE ARE ALL DOOMED😱😱😱
until we didnt see BTC break below 70k , i am still bullish on crypto and buying some coins on spot for my portfolio, i am not heavy in crypto but 200-300$ a week is nice investment with potential x10-20 return is nice option

BITCOIN SIGNAL: PUMP INCOMING???? (trap alert) Yello Paradisers! Enjoy the video!
And Paradisers! Keep in mind to trade only with a proper professional trading strategy. Wait for confirmations. Play with tactics. This is the only way you can be long-term profitable.
Remember, don’t trade without confirmations. Wait for them before creating a trade. Be disciplined, patient, and emotionally controlled. Only trade the highest probability setups with the greatest risk to reward ratio. This will ensure that you become a long-term profitable professional trader.
Don't be a gambler. Don't try to get rich quick. Make sure that your trading is professionally based on proper strategies and trade tactics.

Bitcoin ETFs $2 Billion Outflow Could Push BTC Into CapitulationAt the time of writing, Bitcoin trades at $101,274, hovering just above the $100,000 psychological support. A breach below this level could trigger panic among retail traders.
If ETF outflows and bearish sentiment persist, Bitcoin could fall below $100,000 and test the $98,000 support. This decline could extend further, sending the crypto king towards $95,000 or lower.
However, should low prices attract fresh capital inflows, BTC may rebound toward $105,000 and aim for $110,000. Reclaiming this resistance would signal renewed market strength and invalidate the prevailing bearish outlook.

BITCOIN HIGH PROBABILITY SETUP SOON!!!🚨 BTCUSD HIGH PROBABILITY BUY SETUP 🚨
* Here We Can See Clearly The Next Potential Moves For BTC Coming Hours/Days.
* Keep Your Eyes Close On Your Trading Positions.
* Happy PIP Hunting Traders.
FXKILLA.

Bitcoin below 200‑day: Buy the dip or more downside?Bitcoin slid with US risk assets, and a clean break below its 200‑day average puts the 100K support in play right now.
October’s Challenger report showed the biggest monthly job cuts in over two decades, souring sentiment and knocking cryptos alongside equities as traders reassessed near‑term Fed risks.
Weak risk tone plus key technical breaks drove a second wave of selling after the early‑October crypto drawdown, keeping focus on whether 100K holds for Bitcoin.
Key drivers:
Macro shock: October layoffs surged to a 20‑year high, fuelling risk‑off and trimming rate‑cut confidence into year‑end.
BTC technical break: price slipped under the 200‑day, and 50‑day momentum is fading; 100K is the first line of defence, then 92–94K if it fails.
Moving averages are lagging: watch daily closes around these levels rather than one intraday pierce; breadth below long MAs warns of weak trend strength.
Trade the levels, not the noise: defend 100K on BTC for bounce attempts. A daily close below turns focus to 92–94K on BTC before stronger supports.
This content is not directed to residents of the EU or UK. Any opinions, news, research, analyses, prices or other information contained on this website is provided as general market commentary and does not constitute investment advice. ThinkMarkets will not accept liability for any loss or damage including, without limitation, to any loss of profit which may arise directly or indirectly from use of or reliance on such information.

Today's Bitcoin Trading StrategyCurrently, the price of Bitcoin stands at $101,300, which is at a four-dimensional resonance point of "macro easing + institutional entry + technical breakthrough + regulatory clarity". The signal for the super cycle's initiation has been fully confirmed. Unlike previous bull markets, this round of rise is led by institutional funds, featuring stronger sustainability and a higher valuation ceiling . The core of operation lies in "firm allocation + dynamic portfolio adjustment": Institutional investors should seize the opportunity of the correction to establish core positions, while swing traders can follow the breakthrough signals to go long accordingly. At the same time, through strict stop-loss discipline and staged profit-taking strategies, they can lock in the certain gains brought by the super cycle. It is necessary to closely track the ETF capital flow and the dynamics of the Federal Reserve's policies. In the liquidity feast, the "asset revaluation" of Bitcoin has just begun.
Today's Bitcoin Trading Strategy
buy:100000~101000
tp:102000~103000
sl:99000

Bitcoin buying opportuniyFound a level of interest for a potential buying opp on Bitcoin on the 1 hour chart.
I do expect if price hits 101.984$ for buyers to step in and take price back to 102.972$ offering a 1.22 risk to reward ratio

BITCOIN SIGNAL: NEXT WAVE IS INCOMING!!! (soon)Yello Paradisers, enjoy the video!
And Paradisers! Keep in mind to trade only with a proper professional trading strategy. Wait for confirmations. Play with tactics. This is the only way you can be long-term profitable.
Remember, don’t trade without confirmations. Wait for them before creating a trade. Be disciplined, patient, and emotionally controlled. Only trade the highest probability setups with the greatest risk to reward ratio. This will ensure that you become a long-term profitable professional trader.
Don't be a gambler. Don't try to get rich quick. Make sure that your trading is professionally based on proper strategies and trade tactics.

Bitcoin Rebounds Toward 103,500 Target ZoneBitcoin (BTC/USDT) on the 1-hour chart shows a rebound from the support zone around 99,900, forming a bullish move toward the target area at 103,500. A break above the mid-resistance zone could confirm further upside momentum.

Bitcoin Losses Hit 9-Month High Of $24 Billion Amid 8% Price DroBitcoin is trading at $101,729 at the time of writing, sitting just above the critical $100,000 support. Earlier, BTC slipped below this level, forming an intra-day low of $98,966 before rebounding slightly.
The recent 8% drop has validated a head-and-shoulders pattern, which projects a potential 13.6% decline targeting $89,948. However, if investors begin buying at lower levels, Bitcoin could bounce from $100,000 and retest $105,000 or higher.
Conversely, continued selling pressure and weak market conditions could send BTC below $100,000 again. A breach under $98,000 may lead to further losses toward $95,000 or lower, undermining any short-term recovery hopes.

Bitcoin at Make-or-Break Zone. History Says Bounce Incoming!IG:BITCOIN is currently trading above the 50 EMA on the 1W chart, a level that has historically acted as a strong dynamic support during previous bullish cycles.
Each time CRYPTOCAP:BTC has touched the 50 EMA in the past (as highlighted on the chart), it has triggered a strong rebound leading to significant upside moves. Currently, the price is consolidating near both the support zone and the 50 EMA, suggesting that the market is once again at a critical juncture.
If IG:BITCOIN manages to hold this zone and bounce, we could see the next bullish leg pushing towards $150K. However, a clean break below the 50 EMA and support area could indicate a short-term downtrend or deeper correction before resuming the uptrend.
Traders should stay patient and prepared for all possible scenarios. Risk management remains key at these levels.Plan your entries and stops accordingly.

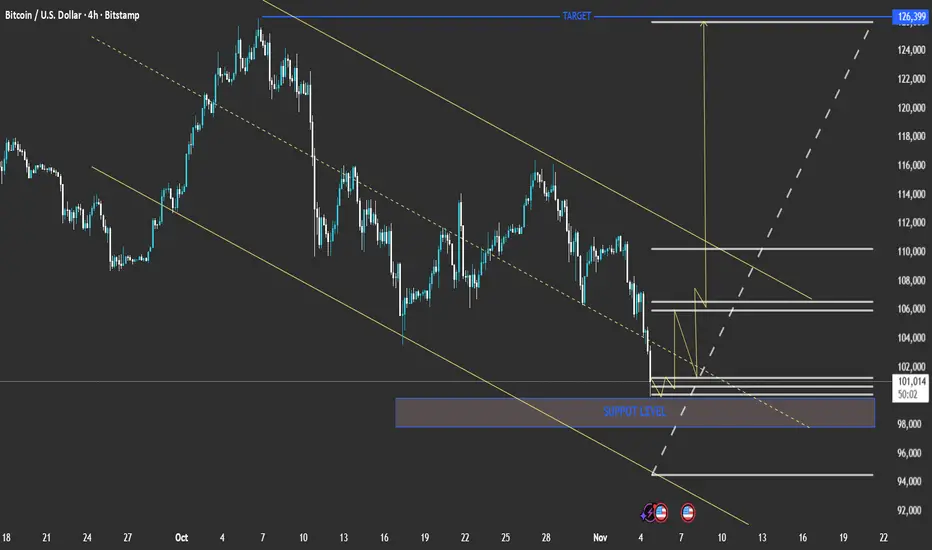
technical analysis of your Bitcoin (BTC/USD) 4-hour chartPair: BTC/USD
Timeframe: 4H
Current Price: ≈ 101,240
Trend: Downtrend within a descending channel
Main Zones:
Support Level: 98,000 – 100,000
Short-Term Resistance: 104,000 – 106,000
Major Target (Upside): 126,399
📉 Technical Outlook
Bitcoin continues to respect the descending channel drawn with parallel trendlines.
The price is now hovering near the lower boundary of the channel, close to the support level zone.
A potential bullish reversal may occur if this support holds, leading to a push toward mid-channel resistance (around 106,000).
📈 Bullish Scenario
If the support at 98,000–100,000 holds:
BTC could rebound toward 104,000 → 106,000 → 110,000.
A confirmed breakout above 110,000 may trigger a strong rally toward the main target of 126,399.
📉 Bearish Scenario
If BTC breaks below 98,000:
Expect further downside to 94,000 – 92,000, the next major demand zone.
This would confirm continuation of the descending channel trend.
⚙️ Summary
Aspect Bias
Trend Bearish (short term)
Key Support 98,000 – 100,000
Key Resistance 106,000 – 110,000
Long-Term Target 126,399 (if breakout occurs)
Short-Term Risk Break below 98,000 FPMARKETS:BTCUSD FPMARKETS:XLMUSD FPMARKETS:SOLUSD FPMARKETS:ETHUSD FPMARKETS:RPLUSD FPMARKETS:DOGUSD FPMARKETS:LTCUSD FPMARKETS:LNKUSD FPMARKETS:ADAUSD FPMARKETS:EOSUSD FPMARKETS:EOSUSD
BTC faces a crash, can it hold the $100000 mark?#BTCUSD BITSTAMP:BTCUSD BINANCE:BTCUSDT BITSTAMP:BTCUSD BINANCE:BTCUSDT
Affected by market news, BTC's hourly chart showed a large bearish candlestick, falling to a low of around 104000. Currently, regardless of the time frame, BTC has reached the lower Bollinger Band area, and all moving averages across different timeframes are trending downwards in tandem, with the MACD indicator showing a bearish crossover and increasing volume. There are no signs of a technical reversal yet, and in the short term, BTC still has room for further downward correction.
If 104000 is breached again, BTC may further decline to 102000-101000, or even the psychological level of 100000. It's only a matter of time, and the bulls will temporarily back down.
Therefore, if BTC rebounds to 105500-106500 in the short term, shorting BTC can be considered.

Bitcoin Rebound from Support Zone Targets 109,400Bitcoin (BTC/USD) is rebounding from the support zone near 106,000, showing signs of a potential upward move. The next resistance targets are around 108,000 and 109,400 levels.

BITCOIN SIGNAL: BIGGEST MOVE YET TO COME!!!? (scary)Yello Paradisers, enjoy the video!
And Paradisers! Keep in mind to trade only with a proper professional trading strategy. Wait for confirmations. Play with tactics. This is the only way you can be long-term profitable.
Remember, don’t trade without confirmations. Wait for them before creating a trade. Be disciplined, patient, and emotionally controlled. Only trade the highest probability setups with the greatest risk to reward ratio. This will ensure that you become a long-term profitable professional trader.
Don't be a gambler. Don't try to get rich quick. Make sure that your trading is professionally based on proper strategies and trade tactics.

Bitcoin Miners Trade Place With Long-Term Holders To Harm BTC Bitcoin’s price currently stands at $107,968, hovering above the key $108,000 support level. Historically, BTC has slipped through this zone during periods of miner or institutional profit-taking. Maintaining this support is crucial for preventing a deeper retracement.
If miner selling intensifies, Bitcoin could drop toward $105,585, marking a two-week low. The move would likely trigger short-term liquidation pressure and add to investor uncertainty. A further decline could also weaken technical support ahead of $103,000.
However, if miners ease off and sentiment stabilizes, Bitcoin could rebound toward $110,000. A confirmed breakout above this level may pave the way for a rise to $112,500, restoring short-term bullish confidence in the market.
