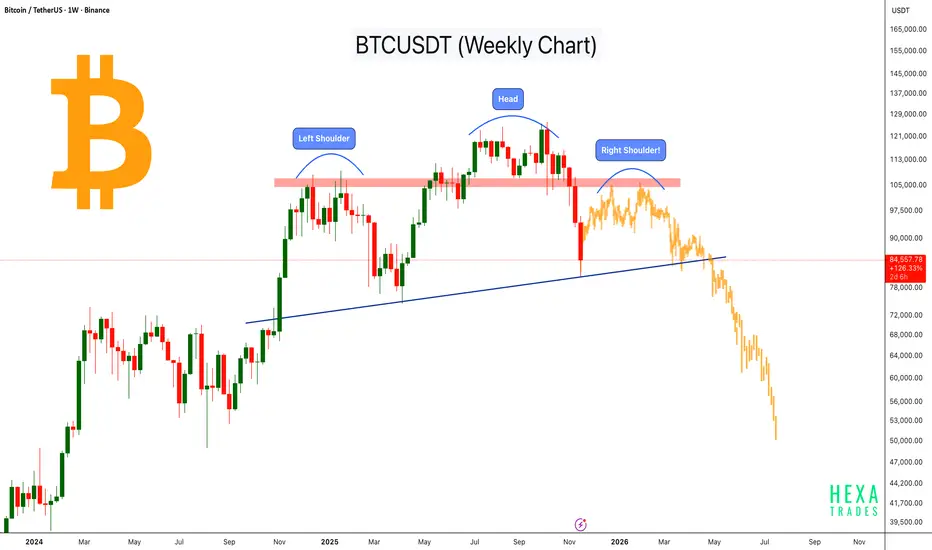
Bitcoin’s Macro H&S Structure Building Up!Bitcoin is developing a potential Head and Shoulders pattern on the weekly timeframe, a classic bearish reversal structure. The price has repeatedly rejected the major resistance zone marked in red, indicating strong selling pressure.
As of now, the left shoulder and head are already formed, and based on the current structure, the right shoulder could form within the next 1–3 months if BTC continues to face resistance near this zone $100k- $107k
Price is currently hovering near the long-term ascending trendline (neckline), which will play a key role in determining whether this pattern completes and confirms.
The yellow candles represent a forecast, illustrating a possible scenario if the right shoulder forms and the neckline breaks.
Key Highlights
- Left shoulder and head are already formed; right shoulder may form in the next 1–3 months.
- Strong rejection from major resistance, similar to classic H&S structures.
- Ascending neckline acting as final support.
- Yellow candles are only a forecast, not actual price data.
- Pattern confirmation requires a decisive break below the neckline.
This is an early-stage macro pattern, and traders should watch how BTC reacts around the resistance zone and the neckline in the coming weeks.
Cheers
Hexa
BTCUSDC
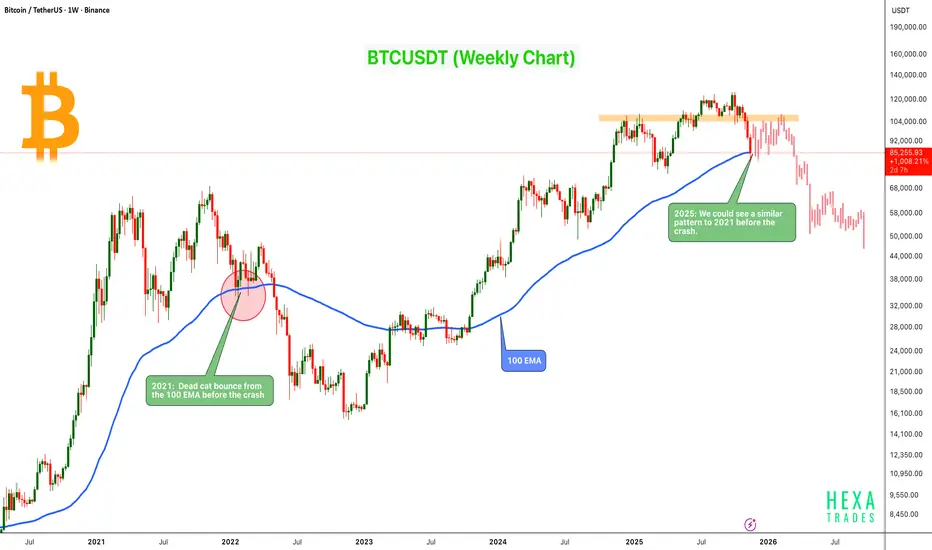
2021 vs 2025: Bitcoin Showing a Similar Macro StructureBitcoin is showing a price structure very similar to the 2021 macro top, where BTC formed a dead-cat bounce from the 100 EMA before beginning a major correction.
On the current cycle, BTC is once again testing the 100 EMA, and the price reaction looks very similar to the 2021 pattern: a brief bounce followed by continued downside pressure.
Key Points:
- 2021 Pattern: BTC bounced from the 100 EMA before the macro crash.
- 2025 Price Action: Showing a similar bounce and reject structure at the same weekly EMA.
- Major Weekly Resistance: Market showing exhaustion and lower-high structure, just like previous cycle tops.
- Potential Dead-Cat Bounce: We could see a bounce toward the $100K–$107K zone before the downtrend continues.
- Possible Repeat Scenario: If BTC fails to hold above the 100 EMA, history suggests a deeper correction may follow.
Cheers
Hexa
Should I sell Bitcoin?This chart is to offer up some guidance to those thinking of selling.
Trend lines are made to be broken. They express the rate of increase at the absolute bottom of the selling. So when a trend line breaks you're now in the area you actually want to buy for long term as a new trend will form from that low.
As you can see with past Bitcoin trends whenever there's a new low made, that's where the price eventually wants to come back to. And if the move above the trend was significant enough it will likely break it as people sell at the bottom. Currently as you can see from the Yellow section we are in a steady trend much like the latter part of 2016-2017. We've made small moves up to the previous (covid low) trend line and back down. These oscillations have been historically quite small. So any moves below this trend line are likely not to be significant.
If Bitcoin ever attempts a move up into the covid low channel at makes it up to that upper trend line, That would be a significant rise and would very likely follow a significant fall.
As for right now Bitcoin has breached the trend line slightly and is in what I would consider an opportunistic buy area with very low downside risk.
Good luck!

BTC/USDT - Make-or-Break Demand Zone: Reversal or Breakdown?Bitcoin is now entering one of the most critical zones of its mid-term market structure. After a sharp decline from the 126k peak, price is sliding into the major demand block at 83,000–78,000, a region that previously acted as a springboard for the rally earlier this year.
This 3D chart clearly highlights a structural decision point:
➡️ Hold this zone → strong bullish continuation potential
➡️ Lose this zone → the market opens room for a deeper macro correction
The next few candles in this zone will shape the direction of the entire Q4–Q1 trend.
---
Why This Yellow Block Matters
The 83k–78k zone is not random. It represents:
The origin of a previous rally, where institutional buying stepped in aggressively
A macro demand cluster, confirmed by multiple touches and consolidations
A liquidity “rebalance zone”, often retested before trend continuation
A structural higher-low area in the broader bullish cycle
If BTC wants to maintain a macro uptrend, this is where buyers must show up.
---
Market Structure & Pattern Description
The chart shows a macro uptrend, followed by a deep correction from the top.
Price is now approaching the key retracement zone of the previous expansion.
This area previously formed a base pattern before the 50k → 126k breakout.
Candles entering the demand zone show seller exhaustion signals, but no confirmation yet.
A reversal pattern here (engulfing, long-wick rejection, inside bar break) would be the first bullish signal.
A clean 3D close below 78k would convert this demand zone into supply — a strongly bearish structural shift.
This is the type of zone where trends are born or destroyed.
---
Bullish Scenario (Reversal from 83k–78k)
For the bullish thesis to remain valid:
🔥 Conditions Needed
Rejection wick or bullish engulfing on the 3D timeframe
Higher low confirmation on daily
Return above key short-term resistance around 92,400
🎯 Bullish Targets
TP1: 92,000 (short-term reclaim)
TP2: 110,000 (macro mid-range)
TP3: 126,000 (previous high → breakout zone)
If buyers defend this zone, BTC maintains its macro bullish structure.
❌ Bullish Invalidation
A 3D full-body close below 78,000
Followed by failed attempts to reclaim the zone
---
Bearish Scenario (Breakdown of 78k)
If price fails to hold the demand block:
🔥 Breakdown Confirmation
Strong 3D candle close under 78k
Retest of 78k–83k as resistance
Increasing selling volume
🎯 Bearish Targets
Target 1: 72,000 (major liquidity zone)
Target 2: 62,000 range
Target 3: 49,000 (macro support from prior cycle)
A breakdown here would confirm a macro correction, not just a pullback.
❌ Bearish Invalidation
Price quickly reclaims 80k–83k with momentum
Failed retest turns into a deviation
---
Trading Notes
This is a macro (3D) zone — be patient.
Let confirmation develop, avoid knife-catching.
Use wide stops; 3D signals require larger breathing room.
Watch volume:
Increasing volume near the bottom = accumulation
Increasing volume on breakdown = distribution
#Bitcoin #BTCUSD #BTC #CryptoMarket
#PriceAction #DemandZone #CryptoTA #BullishScenario #BearishScenario #MarketStructure #CryptoOutlook #MacroAnalysis

Btc: Yellow vs PinkMy two scenarios are:
- Yellow: around 70k and then we can fly again (70%)
- Pink: we retest 15k and then we can fly again (30%).
As long as we stay above 60k, I think we good.

$BTC MacroCRYPTOCAP:BTC following my macro plan. I will start adding in the purple box. We might get a short term bounce but we never got the $106250 which was an important level for us to go higher with btc and potentially see $109000. But now we have lost $100000 I think we will likely end op hitting 88/92k

Bitcoin RSI Oversold Again - Is Another bounce Coming?Bitcoin chart highlights a repeating pattern on Bitcoin’s daily timeframe: every time the RSI drops into oversold territory (below 30), it has historically marked a major local bottom followed by a strong recovery.
On the price chart above, each green arrow represents a previous swing low. On the RSI panel, the boxed areas show moments when RSI dipped below 30. Every one of these events has been followed by a noticeable rebound in Bitcoin’s price.
We are now seeing the same setup again. RSI has once again fallen into the oversold zone, aligning with another green arrow on the chart. If history repeats, we could see a similar recovery this time too, just as Bitcoin has done consistently over previous cycles.
Key Points
- Historically on the daily chart, whenever RSI dropped below 30, Bitcoin experienced a recovery soon after.
- The current RSI reading is tapping this same level again.
- This confluence suggests a potential bottoming zone and possible trend reversal.
- While not a guarantee, the pattern has been reliable across multiple past cycles.
Cheers
hexa

BTC Weekly View !BTC / USD
Bitcoin (BTC) followed my previous analysis on October 30th, dropping from $110,000 to its current price of $96,000. check here
What's Next?
Take a Look at the weekly chart:
Bitcoin is currently at a "do or die" support level (trend line + 50-week moving average).
This moving average has been a turning point in previous cycles.
If the price breaks below this level, it will confirm a mid-term bear trend with minimal target around 74k so keep an eye on this chart.

BITCOIN:LIVE TRADEHello friends
You know that this is a risky situation, so observe risk and capital management.
The price has risen after the decline, has collected good liquidity, and now it has fallen again, has collected low liquidity, and is waiting now that this floor has been made, to move to the specified targets. Of course, the opening of the US government is also effective.
Observe capital management.
*Trade safely with us*

BTC on the brink of explosion: Wave 5 is charged –BTC on the brink of explosion: Wave 5 is charged – those who are not up are late.
🌀 Wave Structure
On the weekly chart, BTC is forming a major impulse, where:
Wave 3 is already complete (characteristic super-sharp rise + volume extremes).
The market is now in the area of wave 4—an extended correction moving sideways.
Wave 5—the next wave in the cycle—is preparing to launch but requires confirmation through a resistance breakout.
The correction looks like this:
A–B–C (flat correction or sideways zigzag)
Wave A—a sharp decline.
Wave B—a rebound without breaking the high.
Wave C—a fading decline/flat.
This is a classic pattern before the start of the final impulse.
📍 Key Resistance Levels
$71,500—the main trigger level for wave 5.
A breakout opens the way for a trend acceleration.
$75,000—the boundary of a new impulse zone. Support
$64,000 is the support zone for wave 4.
Holding it is critical.
$60,500 is the deep support for wave C.
Only a breakout of this support will cancel the bullish scenario.
📈 Weekly Scenarios
🟩 Bullish Scenario (Main)
BTC holds the $64,000–$66,000 range, forming the bottom of wave 4 →
breaks $71,500 →
wave 5 activates.
Wave 5 Fibonacci targets:
$78,000
$82,000
Maximum extension: $89,000
🟥 Bearish Scenario (Alternative)
If the price breaks below $64,000, the structure turns into an extended zigzag. Then wave C could drop to:
$60,500
Extreme: $57,800
From there, there's a high probability of an upward reversal—the start of wave 5 is simply shifted in time.
🎯 Summary
BTC has reached its conclusion:
🔥 Above $71,500—the start of a powerful wave 5 and a new historical impulse.
⚠️ Below $64,000—wave 4 deepens before the final push.
This week promises to be a decision point: either a sharp upward move or a final liquidity boost at the bottom.

BTC Weekly chart Bear MarketI had to wait until the weekly closing candle to publish this idea.
We are currently in the A wave correction. I am expecting the price to do the B wave now (couple of weeks or the time it takes), finding resistance between 109,286 and 113,174 resistance zone. That zone will be where I place my Big Short with a TP of 40,000.
40,000 - 30,000 will be the accumulation zone and will mean the end of the bear market. When the time comes, I will tell you when the bull market begins and the next ATH in BTC.
Don't buy BTC at these prices, it is too expensive, wait for the next couple of years to buy. I will update the Daily chart idea for the big short zone to have the precise entry point.

#BTC/USDT – Support Reversal & Bullish Recovery Outlook#BTC
The price is moving in a descending channel on the 1-hour timeframe and is expected to break out and continue upwards.
We have a trend to stabilize above the 100-period moving average again.
We have a downtrend on the RSI indicator, which supports an upward move if it breaks above it.
We have a key support zone in green that pushed the price higher at 95327.
Entry price: 95815
First target: 96158
Second target: 96865
Third target: 97661
For risk management, don't forget stop-loss orders and capital management.
The stop-loss should be below the green support zone.
Upon reaching the first target, take some profits and then change the stop-loss order to an entry order.
For any questions, please comment.
Thank you.

Start Accumulating BTC!Bitcoin has reached a major demand zone between $91,000–$97,000, an area that has consistently acted as a strong support throughout 2024–2025.
Price has now tapped the bottom of this accumulation zone, where buyers previously stepped in aggressively.
Key Points:
BTC is sitting inside a high-probability bounce zone.
Historically, this region has triggered strong upward reversals.
Market structure is still intact as long as price holds above $91,000.
Perfect area for long-term positioning.
Start accumulating BTC within this support zone.
This is one of the cleaner levels to build exposure before the next macro move.

$BTC crash. Where is the bottom?Bitcoin is crashing — and while it looks scary, it’s also one of those rare long-entry opportunities you’ll regret missing once the rebound kicks in.
Why is Bitcoin dumping?
1️⃣ A major hedge fund manager shut down his Bitcoin fund.
Historically, this kind of event often precedes bubble corrections, creating panic in the market.
2️⃣ The FED won’t publish inflation or unemployment numbers due to the government shutdown.
With no data, Powell can’t justify a rate cut.
The market is now pricing a “no-cut scenario,” which puts downward pressure on all risk assets — including crypto.
3️⃣ Structural consolidation.
I already posted about this:
- bullish short-term,
- bearish long-term
This is exactly what’s happening.
The macro downtrend should end around Q2 2026, meaning we’ll likely grind down or range until then.
Is this a bear market?
Not really.
Bitcoin probably won’t see an -80% crash ever again.
But a -30% correction? Absolutely possible.
What does the chart say?
The current correction has a support zone at $94–95k.
If that breaks, the next zone is $88k — less likely but still possible.
Between now and Q2 2026, we’ll get several relief bounces.
If you go long without leverage on strong support zones, you can ride these bounces safely.
Where is the opportunity?
Buy the fear, sell the greed — classic strategy.
Altcoins will bounce even harder than BTC:
CRYPTOCAP:PEPE , NYSE:FUN , DeFi coins, memecoins — these always react with double-digit rebounds.
The key idea
👉 The best entries happen when everyone is panic-selling.
👉 The best exits happen when everyone is euphoric.
Stay smart, stay patient.
DYOR.
#Bitcoin #CryptoCrash #BTC #Altcoins #CryptoTrading #CryptoAnalysis #CryptoMarket #CryptoInvesting #BTCPrice #BuyTheDip #MarketUpdate #TradingStrategy #TechnicalAnalysis #Macro #RiskManagement #HODL #CryptoNews

BITCOIN SIGNAL: IS THIS THE END OF BITCOIN CYCLE??!!!(get ready)Yello Paradisers! Enjoy the video!!!!!
And Paradisers! Keep in mind to trade only with a proper professional trading strategy. Wait for confirmations. Play with tactics. This is the only way you can be long-term profitable.
Remember, don’t trade without confirmations. Wait for them before creating a trade. Be disciplined, patient, and emotionally controlled. Only trade the highest probability setups with the greatest risk to reward ratio. This will ensure that you become a long-term profitable professional trader.
Don't be a gambler. Don't try to get rich quick. Make sure that your trading is professionally based on proper strategies and trade tactics.

btc await breakout to sell#BTCUSD price needs reverse above the 98k which holds sell continuation, possibly decline still holds below 94600 on sell.
Sell limit 98k, target 93k-90k, stop loss 99300.
Bullish isn't strong now, we need multiple breakout above 100k before Bullish range can be formed.

BTC Analysis | CME GapHello friends
Bitcoin’s critical gap between $91,500 and $92,500 could serve as a short-term correction target if selling pressure continues.
A gap that closes could set the stage for a bottom and a continuation of the uptrend.
The price’s reaction to this area will determine the market’s next direction.
Don't forget risk and capital management.
*Trade safely with us*

BTCUSDT - The manipulation Festival!Bitcoin has already formed a rising wedge pattern, broke it downward after retesting it, and continued falling, even breaking below 100K just like you wanted? There’s also a death cross forming on the chart… and from here I’ll just sit back and watch the manipulation festival.
Bitcoin never forms a bearish pattern and hits its targets the way people expect — not until it wipes out every type of trader first. And look at the candlestick formation I predicted; Bitcoin followed it exactly, to the millimeter, on the 3-day chart.
The idea that Bitcoin is actually bearish and will drop more than this is a joke to me — something absurd. What about the people who have been holding short positions for the past 10 days? Nobody’s going to ask about them?
It’s their turn now, of course… You’ve taken your profit and now you’re greedy for more downside?
Come on, let’s liquidate all of you the same way we liquidated the long positions earlier, and the same way spot traders got shaken out. Let’s make everyone lose hope and exit the market.
The market is built on manipulation, and technical analysis is just a tool to understand where that manipulation happens — nothing more.
Study my candlestick projection carefully, because that’s exactly what’s going to happen in the coming days. And remember what I said.
Best Regards:
Ceciliones🎯

ANFIBO | Bitcoin BTCUSD - Bet a Buy order [11.14.2025]Hi traders, Anfibo’s here!
BTCUSD – Technical Outlook
Technical Structure:
BTC is now trading extremely close to a major structural support zone, aligning with the 61.8% Fibonacci retracement around the $94,000 region. This confluence makes the area a high-value reaction point—historically, 61.8% fib zones often act as strong bases for corrective rebounds during healthy bull-cycle pullbacks. Momentum is slowing down as price compresses into this support cluster, signaling that the market is preparing for a potential relief bounce… unless the level fails.
Trading Strategy:
Our approach today focuses on respecting this key confluence zone.
If BTC stabilizes above 94k, a short-term rebound toward 110,000 USD is a realistic target.
However, if price breaks below 91,000 USD, structure becomes decisively bearish, exposing deeper supports and invalidating the rebound setup.
This is a “react at the level, not before the level” type of day.
Daily Trading Plan:
>>> BUY ZONE:
ENTRY: 93,500 – 95,000
SL: 90,500
TP: 110,000
(Looking for a clean rebound from the 61.8% confluence, ideally with volume pickup or bullish rejection candles.)
>>> SELL ZONE: (only if 91k breaks cleanly)
ENTRY: 90,000 – 91,000 (retest of breakdown)
SL: 94,000
TP: 87,000 → 80,000 → 77,000 → 72,000 → 63,000
(A structural breakdown would shift momentum from corrective to impulsive downside.)
Risk Management:
Keep size moderate; counter-trend buys at major supports require disciplined SL usage.
If entering long, move stop to breakeven once price clears 98k–100k to reduce downside exposure.
Never average down near broken supports; wait for structure to confirm strength before adding.
If the 91k level breaks, switch to defensive mode — reassess bias and avoid catching falling knives without confirmation.
Conclusion:
BTC is sitting on one of its most important confluence supports at 94k. A rebound from here can push price toward 110k, but a clean breakdown below 91k will shift the broader narrative toward a deeper corrective leg with multiple supports waiting below (87k → 80k → 77k → 72k → 63k). Today is a critical inflection point—let the level decide the direction and react accordingly with disciplined execution.
GOODLUCK GUYS!!!

BITCOIN SIGNAL: HERE IS WHATS NEXT!!!! (boom)Yello Paradisers! Enjoy the video!
And Paradisers! Keep in mind to trade only with a proper professional trading strategy. Wait for confirmations. Play with tactics. This is the only way you can be long-term profitable.
Remember, don’t trade without confirmations. Wait for them before creating a trade. Be disciplined, patient, and emotionally controlled. Only trade the highest probability setups with the greatest risk to reward ratio. This will ensure that you become a long-term profitable professional trader.
Don't be a gambler. Don't try to get rich quick. Make sure that your trading is professionally based on proper strategies and trade tactics.

Bitcoin: Liquidity CycleTypical liquidity cycle is 5-6 years long (65m). Buy bitcoin before an upswing (or end of QT) and sell when liquidity tightens. Macro is the best way to analyze markets?
Adjust your stakes based on position of the cycle.
Markets can have risk-on, risk-off episodes. Where Bitcoin is a risk-on asset.
Use 10Y-02Y for guidance.

$BTC bounce. What is happening?On the Macro Side:
Metaplanet was on the verge of bankruptcy — their stock dropped from $1,900 to $415 in just five months.
Their average Bitcoin buy price sits around $104K, and they had to take on more loans to buy even more BTC, in an attempt to lift the price and save their position.
Michael Saylor and NASDAQ:MSTR are in a similar situation. MicroStrategy’s stock has fallen from $460 to $236, with an average Bitcoin purchase price around $66K.
This puts huge pressure on these institutional treasuries — they cannot afford a bear market.
They’re forced to keep buying Bitcoin to prevent a BTC dominance collapse ( CRYPTOCAP:BTC.D ) and hold market confidence.
In the last two days, altcoins ( CRYPTOCAP:OTHERS ) have been outperforming Bitcoin, signaling a possible rotation from BTC to alts.
That alone was enough for these mega whales to ignite a quick pump before the weekend, trapping retail traders and preventing massive ETF sell pressure from retail-driven redemptions.
On the Chart:
Bitcoin is oversold on both RSI and MACD across multiple timeframes.
This aligns perfectly with the whales’ attempts to spark a rebound — and may support a short-term bounce lasting 5–7 days.
However, don’t be fooled — this looks more like a desperate defense pump than a true trend reversal.
The weekly trend remains bearish until at least Q2 2026, and we’ll likely see more bounces and dips along the way.
A new all-time high seems unlikely in this macro environment, with a maximum target around 108K before another correction.
Stay cautious. Don’t FOMO into this move — it’s engineered to protect treasury positions, not to start a new bull run.
Things will truly turn bullish only when Powell is replaced, QE restarts, or a major macro catalyst (like a government resolution) happens.
DYOR. Stay smart. Don’t chase hype.
#Bitcoin #CryptoMarket #BTC #Altcoins #CryptoNews #CryptoAnalysis #Macro #Whales #MarketUpdate #BTCUSD #AltcoinSeason #Investing #Trading #CryptoTrends #MSTR #Metaplanet #CryptoCrash #CryptoStrategy #DYOR

ANFIBO | Bitcoin BTCUSD - UP or DOWN? [11.13.2025]Hi traders, Anfibo’s here!
BTCUSD – Technical Outlook
Technical Structure:
On the higher intraday frame, BTC is running an H1 uptrend — higher highs / higher lows are still intact and the structure favors the bulls. However, on the lower intraday frame (M15) price is trapped inside a short-term descending trend, creating compression between the bullish H1 bias and the bearish M15 micro-structure. That interaction is producing chop around the ~102,000 area and increases the value of waiting for a clean directional resolve (breakout + retest) before committing.
Daily Trading Strategy:
Our approach today is simple and veteran-focused: wait for the breakout of the conflicted edge and trade in the direction of the break after a proper test.
If price breaks up out of the M15 downtrend: wait for the pullback / downtest, then buy near the test level (~102,000).
If price breaks down through H1 support / the current compression: wait for the retest of that broken edge, then sell near ~102,000.
This “break → retest → trade” workflow avoids getting caught in false moves and puts probability in our favor.
Daily Trading Plan:
>>> SELL ZONE:
ENTRY: 101,500 – 102,500 (on confirmed breakdown + failed retest)
SL: 104,500 (above the immediate M15 channel / invalidation level)
TP: 96,000 (TP1) — 92,000 (TP2)
>>> BUY ZONE:
ENTRY: around 102,000 (on confirmed breakout + clean downtest)
SL: 99,500 (below the downtest low / invalidation level)
TP1: 108,000
TP2: 112,000
(Notes on entries: the same ~102k area becomes the decision point — trade only after structure confirms: for buys, look for bullish confirmation on the retest (rejection wick, bullish engulf, rising volume); for sells, look for bearish rejection on retest or inability to reclaim the edge.)
Risk Management:
Keep position sizes small-to-medium while the pair remains in a compressed range; risk 1–2% of equity per full setup.
Use stop losses as listed and never widen SL to “hope” — adjust size instead if you need a wider stop.
Prefer scaling: take a starter size at first confirmation and add only after the trade behaves in your favor (e.g., after TP1 or strong momentum continuation).
Avoid trading into major macro prints or news; if a scheduled event is imminent, reduce size or stand aside until clarity returns.
Conclusion:
Today’s market is a classic “higher-frame bias vs. lower-frame conflict” scenario. The H1 uptrend gives the structural edge to buyers, while the M15 downtrend supplies immediate supply and failure points. The correct, experienced play is to wait — only engage after a clear breakout of the micro-trend and a confirming retest around the decision area (~102k). Whether the trade becomes a buy or a sell, follow the break → retest → confirm discipline, manage risk tightly, and let price prove the direction before enlarging exposure.
GOODLUCK GUYS!!!
