BTCUSD retracement expected Expecting BTCUSD to retrace back till 23400 from current level of 24700 after a good upmove.
Btcusdforecast

BTC_USDT on daily Everytthing is clear we are compeleting 5 waves on elliot, we can expect of price to touch mid line on 26k and after that 29k , just analyze and can be failed

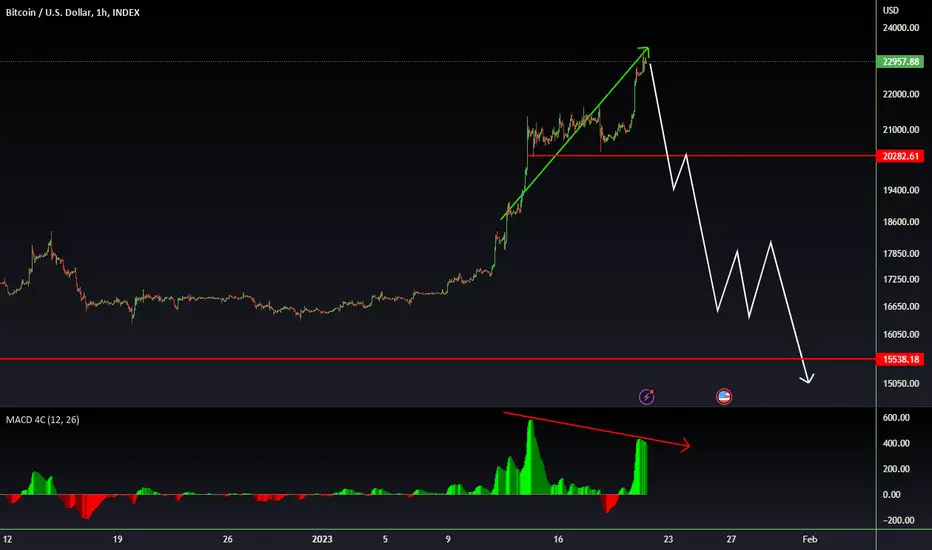
BTC - Back to 20k?!BTC - Back to 20k?!
You either going to love this or hate this but I think we should re-visit the 19-20.5k areas, now what I think really doesn't matter.
However, the technicals is what really matters. If we don't stay above this elevated areas 19-20k but if we get bulls above and go above key resistance sure 25k easily but we do have FOMC this week and that is critical like I've stated many times no one really knows the definite outcome of FOMC and it is same as technicals but when you create edge you have mental support but right now FOMC that's coin flip event it's messy if you buy or even sell now you just get frustrated because you're stuck in this range. I've done this many times myself and I still do at times. Also,reality those who follow signal providers that's not real trading, that's just you wanting to get rich quick thinking trading is some kind of side hobby when it's not.
Now in front technically we know the levels where bulls can gain control and bears can gain control. You can even get a better view on daily but I wouldn't be surprised if we revisit 20k areas however, even if we get break above or below - I will be making sure it isn't a fake break out etc either direction and that's when your own trade plan helps.
When becoming a professional trader you have a plan and you execute with that plan. The 'wannabe' trader either usually follow signal provider or listening to outside noise. That won't help, unfortunately I haven't came across a successful trader which hasn't had yrs of struggles or there own trade plan. Not every trade plan is the same, that's what makes trading amazing, there no one set way. You can to choose the way you want trade by creating your own edge!
A great trader once stated ' Trade what you see, not what you think'.
It's important to keep your emotions in check at all times, you must be strong to ignore the noise.
Have a great week ahead,
Trade Journal

BTCUSD💥1H-TIMEFRAME ANALYSISBTCUSD💥1H-TIMEFRAME ANALYSIS
💗Hello ladies and gentlemen
This is my new idea for 💥BITCOIN
I hope my idea is clear
Support me by like and share thank you
Stay Safe💯💲💲💲
Good luck💰😍
BTC - Nothing to see here... Move alongBTC still in that ascending broadening wedge we all know it's bearish right? Ain't that right? Right?

Bitcoin / Possible routehi guys , my prediction of the state of Bitcoin is as I have shown
Of course, this is a possibility, not a signal

BTCUSDT: Bitcoin Likely to Continue Bullish After CorrectionThe outcome of the Federal Reserve's upcoming meeting will impact the direction of the BTCUSD pair. Currently, Bitcoin is experiencing a sell-off due to profit-taking, but the market anticipates a further bullish trend due to a slowdown in interest rate hikes. However, a brief bearish correction is expected. It is important to watch the 20000 price level as it may provide support in the future.
I would appreciate your support of this idea to help reach others. You can also share your opinion with me. Many thanks

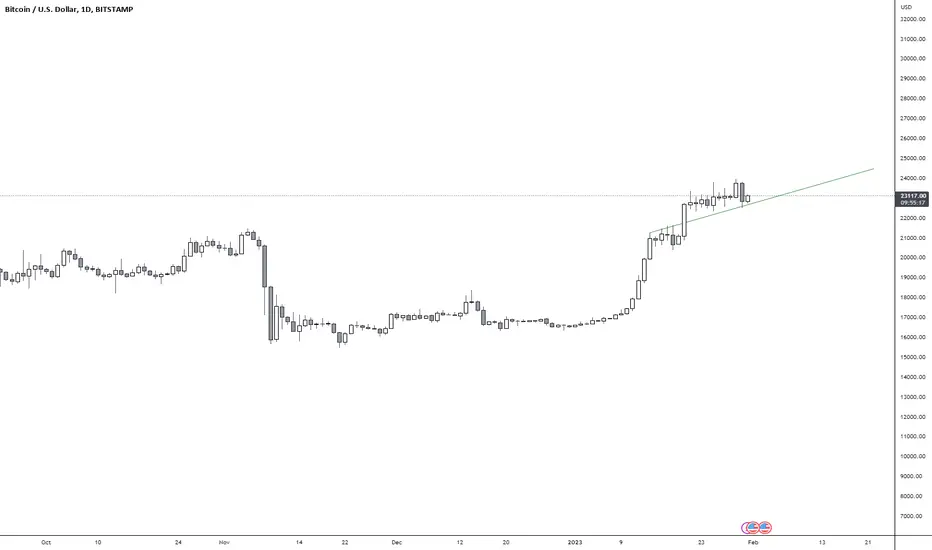
BTC/USD Shift of trend ?Hello fellow traders,
The Stoch RSI cross on the monthly, as well as being oversold on the RSI.
Monthly charts speak volumes. the next bull cycle may be starting. go against the herd <3

BTC/USD CAUTIONHello fellow traders,
just wanted to share while the momentum has shifted prices higher for some time now.
The RSI however is showing that the positive price action is running out of steam. In my opinion, I suspect a pullback to 20K (roughly) to confirm as support.
Weekly charts more or less convince us the Bull cycle has started (weekly macd cross, monthly stochostic cross) This is just stating nothing parabolic will likely happen anytime soon, but if anything a healthy stage for the market to prepare for the next bull cycle.

BTC/USDT Trade Strategy for FOMC!Bitcoin is currently trading right around the $23k area.
Lower Support is around the $22.3k level.
This is my strategy for the meeting:-
I am holding no leverage long positions as of now.
I have placed orders for Doge and BTC.
Lower levels to long BTC are $22322, $22569, and $22689.
These can easily get filled with choppy price action.
FOR NEW TRADERS:- Do not trade at all!
Wait for the market to settle down and get entries a few hours after the announcement.
DYOR, This is not financial advice.
The two scenarios are shown in this chart.
Which one do you think is highly likely?
Invalidation:- Break and close below $21878, which will be our Stop Loss.
Do show your support, it motivates me to post frequently.
Thank you
#PEACE

BTCUSDT AnalysisAm still Neutral on Bitcoin if it breaks 23.5k then upward trends continue, but below 23.5k will fall to 22.9k then 22.5k then 21.8k as support. Trade with caution

Shorters about to get REKTKeep shorting and apply at McDonalds Chads.
Vertical accumulation again and again.
but muh 12k bids.... ye keep waiting.
BTCUSD Multi-Timeframe And TMP AnalysisGood morning my fellow Traders! This is my insight on BTCUSD. I don't normally trade BTCUSD. I'm fairly a small investor, but I do see a great opportunity for buyers and sellers. I do urge you to watch this pair and if it fits your trading rules giving you a high conviction to participate, go go for it. ONLY IF IT FITS YOUR RULES.
If you'd like more ideas please like this video and comment your thoughts below.

BTCUSD next monthly resistanceIf we close above current monthly resistance strongly with a bit of fervor, our next target would be 35k-37k. We still got a couple of days left for monthly close. Let us hope that we have a strong push up before the monthly closes. That will be favorable recipe for another 50% increase in the price from current levels.


BTC - Buying StrategyBYBIT:BTCUSDT.P
4H time frame
-
Bitcoin is challenging the resistance again.
There are three targets if it could successfully get rid of the red zone this time.
-
Entry: BOS
TP: 24400, 25230, 26370
SL: 22800

Bitcoin Multi-Timeframe Analysis 28.01.Hello Traders,
welcome to this free and educational technical analysis.
I am going to explain where I think this asset is going to go over the next few days and weeks and where I would look for trading opportunities.
If you have any questions or suggestions which asset I should analyse tomorrow, please leave a comment below.
I will personally reply to every single comment!
If you enjoyed this analysis, I would definitely appreciate it, if you smash that like button and maybe consider following my channel.
Thank you for watching and I will see you tomorrow!
You can also check out my previous analysis of this asset:


btc forecast bitcoin forecast for short term ,we are expecting simple elliot movement ,after fed announcement there is a high prediction that gonna be last HH leg
however dou your own research


🔥BITCOIN price SP500 FOMC-Fed Funds Rate. Next week will be hotEarlier this week, we published a possible trade for BTCUSDT. It is still in the process of being worked out.
The trade was based on the assumption that sellers would make every effort to protect the $25k area from an upward breakout. And it is justified and logical to cover at least part of the long positions in this zone.
But looking at the weekly candlesticks, we can see that the growth is only accelerating.
If buyers manage to break the stops of shorts above $25,000, this may provide additional fuel for a sharp 1-2 day impulse to the $27500-28,000 area.
And after a correction to the $20,000 area is possible, and theoretically, this will not be bad for the future growth trend.
We would also like to remind you that on 01/02/2023, the FOMC will meet to announce the new Fed rate. The forecast is +0.5%.
It is difficult to predict how the markets will react, but increased volatility in the markets will be guaranteed.
And at this point, We would like to remind you that sitting without a position is also a position and perhaps the most difficult position)
The SP500 index is on the verge of an upward breakout, but even traders by large companies included in this index are waiting for what the Fed will say. Therefore, in our opinion, it is worth keeping an eye on two possible scenarios.
_____________________
Did you like our analysis? Leave a comment, like, and follow to get more

BTC TO 24K Today ? Here's a possibility in my eyes that could happen today!
BTC is in an upward wedge coming up to a very important zone. THE 24k Zone. BTC must hold the current support LVL of 22990-23100 IF it wants to continue to the upside.
If we hold this area we could see BTC go up and test the 23985- 24304 LVL
ON THE FLIP SIDE
If we lose this current LVL of support we will most likely go back down and test the 21100-21500 LVLS

BTC ... Broken Supply, 25K is next???Good evening all!
We're here with another video for BTCUSD!
Let's have a chat about where we're headed and what we can expect over the coming days!
