Bitcoin - a weak resumption of movement.The instrument shows a weak resumption of buying after the breakdown of the trendline. After stopping the movement, the price is in the upper boundary of the trading range. On the background of the fact that important news are coming out today, higher volatility is expected.
If you liked the idea, please like it. That's the best "Thank you!" for the author 😊
P.S. Always do your own analysis before a trade. Put a stop loss. Fix profits in installments. Withdraw profits in fiat and make yourself and your loved ones happy.
Translated with www.DeepL.com (free version)
Btcusdforecast

BTC ANALYSISBTC UPDATE.
BTC is currently trading in rising wedge with upper band acting as the resistance and btc needs to close above this level for long positions.However,btc aslo making the double top at the resistance $ close below the neckline of the doule top will result in dump again.It would better if wait for long position and can take short positions with less leverage as we are still trading in seesaw range.

Bitcoin Crypto market update
Pakistan Time: 10:57 AM
Bitcoin support levels - 19,500 and 19,000 USD strong Support (is Ka Matlab yahan buyers hain)
Bitcoin resistance - 20,500 and 21,500 USD strong resistance (is Ka Matlab k yahan sell karney walay hain, sell hoga bitcoin)
Bitcoin per market depend karti hain tu ap ko update de di hai - is k according plan apko khud karna hai AB kiya karna hai apna funds k sath.
———————————————————————
Analysis -
BTC support is at 19500 and Resistance is at 20500. We need more confirmation for 20,000 support level.Looking at 4 hour chart, BTC is right at 20 EMA, if its support from 20 EMA breaks then it can test 50 EMA around 19745. You MUST consider 19500 Support and 20500 resistance in your risk management.
BTC dominance is at 40% and Total Crypto marketcap is at $956 billion.
Today Important three important fundamental data is being released at 5:30 PM Pakistan time:
US Average Hourly Earning
Non Farm Employment Change
USA Unemployment Rate
New members/ members who don't have more than 1 year trading experience should NOT trade during 5-6 PM Pakistan time.

Bitcoin Btc Trade IdeaCrypto market update
Pakistan Time: 08:46 AM
Bitcoin support levels - 19,500 and 19,000 USD strong Support (is Ka Matlab yahan buyers hain)
Bitcoin resistance - 20,500 and 21,500 USD strong resistance (is Ka Matlab k yahan sell karney walay hain, sell hoga bitcoin)
Bitcoin per market depend karti hain tu ap ko update de di hai - is k according plan apko khud karna hai AB kiya karna hai apna funds k sath.
———————————————————————
Analysis -
BTC got rejection from 20400-20500 resistance level. Further confirmation is required to confirm 20,000 as support again. Current support is 19500 and resistance is 20500. Trade carefully and manage your risk according to support and resistance levels.
BTC closed its daily candle red at 19960. Opening was at 20158, High was at 20456 and low was at 19853.

Btc Bitcoin Trade Plan Crypto market update
Pakistan Time: 12:00 AM
Bitcoin support levels - 18,500 and 19,500 USD strong Support (is Ka Matlab yahan buyers hain)
Bitcoin resistance - 20,500 and 21,500 USD strong resistance (is Ka Matlab k yahan sell karney walay hain, sell hoga bitcoin)
Bitcoin per market depend karti hain tu ap ko update de di hai - is k according plan apko khud karna hai AB kiya karna hai apna funds k sath.
———————————————————————
Analysis - BTC was unable to break 20,500$ level of resistance as we had no volume therefore btc got rejected from the resistance level but we are still able to hold 20,000$ level on 4h Candle which is good, as long as we are above 20,000$ we might see another retest of resistance level and if we see a good volume we might be able to break the resistance as well, Manage your risk accordingly

BTC - Selling SignalBYBIT:BTCUSDT
4H time frame
-
BTC stops making higher high, and it is approaching the the top of the ascending channel, which means resistance.
Also,it broke the uptrend line and forms a double top here; therefore, open short is better.
-
Entry: 20100
Add: 20250
TP: 19650, 19550, 19300
SL: 20320

Btcusd bitcoin Btc Crypto market update
Pakistan Time: 5:33PM
Bitcoin support levels - 20,000 USD and 19,600 USD strong Support (is Ka Matlab yahan buyers hain)
Bitcoin resistance - 20,500 and 21,500 USD strong resistance (is Ka Matlab k yahan sell karney walay hain, sell hoga bitcoin)
Bitcoin per market depend karti hain tu ap ko update de di hai - is k according plan apko khud karna hai AB kiya karna hai apna funds k sath.
———————————————————————
Analysis -
Bitcoin is forming a double top which is bearish pattern and soon we will see drop in Bitcoin price. Price may touch the support area of $19,600 where 200M.A also lying
There are are still signs of struggles in the crypto market.
The US Federal Reserve controlling measures against inflation.
With its approach of increasing interest rates and tightening other financial operation
Don't trade without stop loss

BTC Bitcoin Crypto market update
Pakistan Time: 08:25 AM
Bitcoin support levels - 20,000 USD and 19,500 USD strong Support (is Ka Matlab yahan buyers hain)
Bitcoin resistance - 20,500 and 21,500 USD strong resistance (is Ka Matlab k yahan sell karney walay hain, sell hoga bitcoin)
Bitcoin per market depend karti hain tu ap ko update de di hai - is k according plan apko khud karna hai AB kiya karna hai apna funds k sath.
———————————————————————
Analysis -
BTC support is at 20,000 and resistance is at 20,500. BTC is headed towards the 20500 resistance level, do note BTC has got rejected from this level multiple times so be careful. Trade carefully and manage risk between support and resistance levels.
BTC dominance is at 40.1% and total crypto marketcap is at 971 billion.

Bitcoin BtcCrypto market update
Pakistan Time: 5:47 AM
Bitcoin support levels - 20,000 USD and 19,500 USD strong Support (it means buyers)
Bitcoin resistance - 20,500 and 21,500 USD strong resistance (is Ka Matlab k yahan sell karney walay hain, sell hoga bitcoin)
Bitcoin per market depend karti hain tu ap ko update de di hai - is k according plan apko khud karna hai AB kiya karna hai apna funds k sath.
———————————————————————
Analysis -
BTC support is at 20,000 and resistance is at 20,500.
Looking at the four-hour timeframe, BTC has made two green candles with the current candle also being green. BTC is potentially heading towards the 20500 resistance level, do note BTC has got rejected from this level multiple times so be careful. Watch volume, if BTC manages to break this level with high buying volume the next major resistance will be at 21500. Trade carefully and manage risk between support and resistance levels.
BTC closed its daily candle red, opening at 20337, making low at 1973, high at 20365, and closing at 20158.

BTC Bitcoin Crypto market update
Pakistan Time: 9:30 PM
Bitcoin support levels - 18,500 and 17,500 USD strong Support (is Ka Matlab yahan buyers hain)
Bitcoin resistance - 20,500 and 22,000 USD strong resistance (is Ka Matlab k yahan sell karney walay hain, sell hoga bitcoin)
Bitcoin per market depend karti hain tu ap ko update de di hai - is k according plan apko khud karna hai AB kiya karna hai apna funds k sath.
———————————————————————
Analysis - Bitcoin just retested 19700$ level and currently trading above 20,000$ level, We need good volume to break 20,500$ level of resistance. Manage your risk accordingly

BTC Bitcoin Crypto market update
Pakistan Time: 03:40PM
Bitcoin support levels - 20,000 USD and 19,500 strong Support (is Ka Matlab yahan buyers hain)
Bitcoin resistance 20,500 and 21600 USD strong resistance (is Ka Matlab k yahan sell karney walay hain, sell hoga bitcoin)
Bitcoin per market depend karti hain tu ap ko update de di hai - is k according plan apko khud karna hai AB kiya karna hai apna funds k sath.
———————————————————————
Analysis
Bitcoin breakout and bulls were able to pump the price above the $20,200 resistance zone. The price as high as $20,475 and the price is now correcting gains.
The next major resistance sits near the $20,500 zone.
But RSI is at overbought area and we may see the price will test $19,500
Be carefull
Don't trade without stop loss.

BTC Bitcoin Crypto market update
Pakistan Time: 12:50 PM
Bitcoin support levels - 20,000 USD and 19,600 strong Support (is Ka Matlab yahan buyers hain)
Bitcoin resistance 20,500 and 21600 USD strong resistance (is Ka Matlab k yahan sell karney walay hain, sell hoga bitcoin)
Bitcoin per market depend karti hain tu ap ko update de di hai - is k according plan apko khud karna hai AB kiya karna hai apna funds k sath.
———————————————————————

Btcusd BTC Bitcoin Crypto market update
Bitcoin support levels - 20,000 USD and 19,600 strong Support (is Ka Matlab yahan buyers hain)
Bitcoin resistance 20,500 and 21600 USD strong resistance (is Ka Matlab k yahan sell karney walay hain, sell hoga bitcoin)
Bitcoin per market depend karti hain tu ap ko update de di hai - is k according plan apko khud karna hai AB kiya karna hai apna funds k sath.
———————————————————————
Analysis
BTC support is at 20,000 and major support at 19600. Resistance is at 20500 and major resistance at 21600.
When observing 4 hour time frame, BTC has had multiple rejections from 20500 resistance level since 30th August.
Trade carefully and manage your risk according to support and resistance levels.
BTC closed its daily candle green, opening at 19629, making low at 19490, high at 20475, and closing at 20337. BTC is up 700 than its previous daily closing.

BTCUSDT - Elliott Waves Tryout on WEEKLY ChartHey guys,
Long time no see. (:
I'm trying out this Elliott Waves on the weekly chart of BTCUSDT.
Price movement above 25200 levels will invalidate this one.
Until we see that happening, the ranging length until we establish the 5th and last leg may vary as stated in the chart text.
And I believe if or when we find that 5th leg, it will be our new dip for BTC and the new bull run will begin.
As always, this is not a financial advise! Always DYOR!
Cheers.

BTC ANALYSIS
Analysing the current BTC move..
#BTC has again come to retest the resistance level but we have decrease in the voule as btc approaches the resistance level.Since this has been the Strongest resistance since past few days it wont be easy for btc to close above it.
Will still wait for the daily close as reversal is also possible from here.

short after pullbackDear friends and companions:
As you can see according to my roadmap, Bitcoin is probably suitable for short position after meeting the resistance of this dynamic channel.
If you like my analysis, please like and follow me

BTC must break above 20550!As you can see the price is getting close to the top of the downtrend channel here.
Must take and close above 20550 for higher levels to be seen (green arrows)
Failure to break the trendline will get the price down to 14k if not lower.
My ideal pathway is a move up (ideally to 30k+, might be limited to 27-27.5k) by the EOY and much lower in Q1 of 2023, ideally below 10K.
I personally would like to see the price below 8k at some point next year, that alone will screw everyone out and make people exit and run with whatever left from their holdings.
And only after that (panic exit) the price will start move and will be 10x to 80k plus if not more on the next bull run cycle (which should be stronger then we saw last imo)
Expect lower before the bear market is over, more pain to be seen next year

"Inverted hammer" appeared on BITCOIN chart what does this mean?The previous trading week on the chart BTCUSDT closed presumably with a candle: Inverted Hammer
This Japanese candlestick pattern consists of a bearish candle (red), followed by the Inverted Hammer candlestick, which is characterized by a short body, long upper shadow, and almost without lower shadow. Its appearance on the chart completes the downtrend and signals a bullish reversal.
Inverted hammer pattern criteria
For the reliable identification of the inverted hammer, the following criteria should be met on the chart:
- The market should be dominated by a pronounced downtrend, which can be clearly identified on the chart.
- The first candle of the pattern should be a bearish candle with a long body (relative to the average length of the body of the previous candles).
During the next candle forms an inverted hammer candle, which has a relatively short body length, located in the upper part of the trading range. It does not matter whether it will be bullish (green) or bearish (red)
- The upper shadow of the second candle should be at least twice as long as its body.
- Ideally, the lower shadow should be completely absent, but in the practice of analysis, it is acceptable, if its length is insignificant.
Signal confirmation
The inverted hammer bullish reversal pattern should definitely get the final confirmation in the form of:
- a bullish candle with a long body, provided that the trading volume is high;
- price break upwards with the formation of a bullish candle.
That is why, the BTC price should rise at least to $21.5-22k in the current trading week, as we show in the chart
Psychological rationale
The formation of the model occurs against the background of a steady downtrend, and the bearish candle with a long body just confirms the domination of the bears in the market. The next trading candlestick opens at or near the price low. During this trading candle, the bulls take the initiative, which creates a long upper shadow, but when the candle was closed the bears regain the lost positions. Further action by market participants will depend on the final confirmation, which will be received or not received on the next trading candle. If the market gets a clear confirmation of the trend reversal, the bears will begin to close short positions, and the bulls will increase pressure on the market, and the price will naturally accelerate growth.
Buy and Stop Loss levels
The model is considered to be confirmed if the price has crossed the level passing through the middle of the upper shadow of the inverted hammer, in our case the Buy signal will be if the Bitcoin price fixed above $19716
Stop Loss level is defined as passing through the lowest of the last two price lows, i.e. below $18180. Close a long position and fix the loss in the case, if the market has closed and consolidated below this level.
_____________________
Did you like our analysis? Leave a comment, like, and follow to get more

bitcoin btc Crypto market update
Bitcoin support levels - 18,940 and 18,500 USD strong Support (is Ka Matlab yahan buyers hain)
Bitcoin resistance - 19,400 and 20,100 USD strong resistance (is Ka Matlab k yahan sell karney walay hain, sell hoga bitcoin)
Bitcoin per market depend karti hain tu ap ko update de di hai - is k according plan apko khud karna hai AB kiya karna hai apna funds k sath.
———————————————————————
Analysis -
BTC support is at 18,940 and major support at 18500. BTC got a good bounce from 18940 support.
19,300-19400 is resistance and major resistance is at 20,100. Trade carefully and manage your risk according to to support and resistance levels.
7:00 PM Pakistan time, Federal Reserve Board will be having a closed-door meeting and ISM Manufacturing figures will be released so be careful during 6-7:30 PM.

BTC Bitcoin longterm perspectiveFor those who believe in the success of Bitcoin, these are some potential long-term entries if we get a discount.
The chart explains my interest levels.
Not investment advice just my idea.
Cheers

TheKing Moon or Mars - Everything is in graph.
- Everything is based on Fibonacci (extensions and retracements).
- This scenario is likely to fail, so don't take it as a financial advice.
- This is just a scenario nothing more, nothing less.
------------------------------------------------------------------------------------------------------------------------------------
- Take also in consideration, this scenario is only based on two basic reasoning situations :
------------------------------------------------------------------------------------------------------------------------------------
1/ The Bearmarket :
- The real bearmarket started from April 2021 (First ATH)
- The Second ATH (November 2021) was just a fake, a fomo created by people's witch missed the first train.
------------------------------------------------------------------------------------------------------------------------------------
2/ The Brrrrrr Machine :
- if they start to brrrrrrr ( UK just started ), more will follow.
- this scenario could happen more fast than we think.
- BTC was created to fight inflation.
------------------------------------------------------------------------------------------------------------------------------------
- Feel free to add your comments and ideas.
- Sometimes, it's better to keep silent than speak without thinking.
- Take it easy.
Happy Tr4Ding !

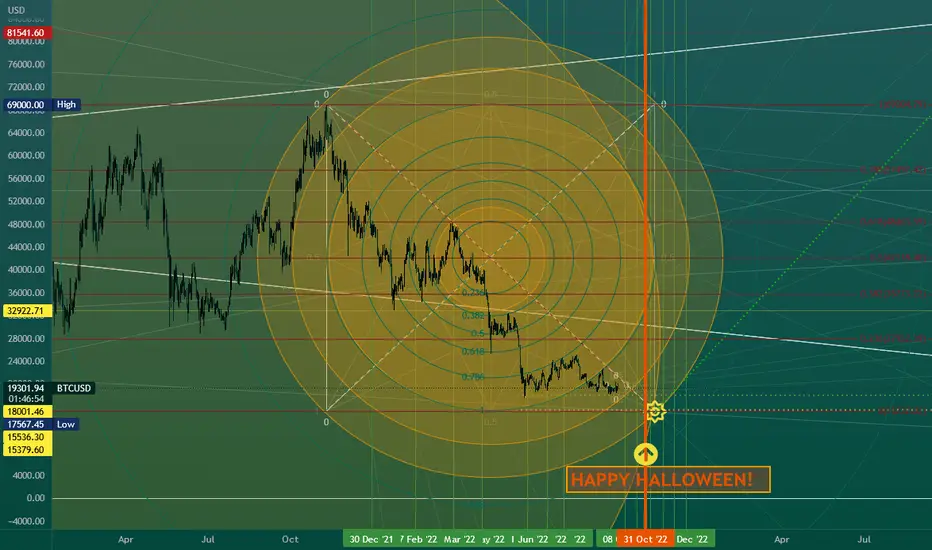
BTCUSDT Oct 1 22🧅Disclaimer :There are risks associated with investing in securities. Investing in stocks, bonds, exchange traded funds, mutual funds, and money market funds involve risk of loss. Loss of principal is possible. Some high risk investments may use leverage, which will accentuate gains & losses. Foreign investing involves special risks, including a greater volatility and political, economic and currency risks and differences in accounting methods. This is Not Financial Advice
🧅JUST AN OPINION OF THE ONION.🧅

POST HALLOWEEN BAG GRABS!!!
2 minutes ago
Somewhere on Coast of the USA
This is a meaningful description of my analysis and prediction. I'm walking you through my processes now. IF i were in your shoes I would question the validity and expertise of this author and judge the value of accuracy in about 9 seconds. How many followers? Do people comment on the posts made?
After that, I'd look back at the chart and read the Happy Halloween and see an GEAR icon.
Most importantly notice the very simple diagonal trend line downward that wrapped in a GANN STAR. IF THIS POST WAS STRIPPED DOWN TO THE BARE ESSENTIALS, that one line would be the only thing I would leave on the chart.
Then I'd sit and stare at the easy-going simplicity for awhile and make some future plans about an EPIC TRADE of the Year!