BTC/USDTreferring to waves analysis the price will go down to complete the last point "C" from ABC will give us the falling wedge pattern, however, the divergence will occur between A and C that may confirm this bullish pattern, by then the price will start to change the trend slightly to move up and complete the future pattern.
as a daily trader, you are at the best moment to put your sell order but, if you are waiting for a buy order, you should be patient until the price hits the C point then you put your buy order after any coming confirmation.
Btcusdforecast

BTC Setup ✔Hello Traders. Here is a setup on BTC. AS you can see we have clear divergence on RSI so expected pullback to around 20500. This is my position.
Entry , TP and SL are shown.

BTCUSDT | Pump to ATHHey everyone!
The BTC is staring to make a historical pump
In one or two month we have to see an awesome pump for real!
So do not miss your chance guys
We are live in amazing time!
Best wishes!

#BTC / $BTC 1H TF UpdateBitcoin is holding on my important zone, and now we see RSI Bullish Divergence
Expecting a Bounce from here! 🏋🏻♀️

BTCUSDT 12h Such situation was already on the BTC chart in 2019A week ago, we already published the idea of BTCUSDT, where we used the Gann box, Fibonacci levels and fractals of BTCUSDT price behavior in the analysis.
And today, analyzing the BTCUSD chart, we caught ourselves thinking: "it was already like that"
I remembered the beginning of 2019, when there was the same sharp correction of the BTCUSDT price in one day. Further 1-1.5 months of narrow consolidation before the start of the growth trend.
In 2019, there was an interesting feature, alts stopped reacting painfully to sharp Bitcoin corrections.
At that time, altcoins began to grow and shoot individually.
It seems to us that the situation is very similar now, which is why we depicted the fractal of the BTC price movement from 2019 to the current chart.
Of course, you can research the behavior of the BTCUSDT price movement and altcoins at the beginning of 2019 and write in the comments whether we are right or wrong
_______________________________
Since 2016 , we have been analyzing and trading the cryptocurrency market.
We transform our knowledge, trading moods and experience into ideas. Each "like under the idea" boosts the level of our happiness by 0.05%. If we help you to be calmer and richer — help us to be happier :)

BTCUSD RETRACEMENT AFTER BIG DUMP!BTCUSD made a big dump after US continues to rise their interest rates and affects all USD pairs. A retracement will be expected after it continues to retest the current
support area around 19926.38. It will retrace and will possibly react around 20786.18 area as a first target and second target will be 21270.60. Confirmation of price action needs to be validated first
as the stochastic is also very oversold. #tyor #dyor

BTC Macro bottom will be decided by PizzaBitcoin macro bottom may be decided by a macro pizza on RSI indicator.
In my humble opinion for the pizza to work out in the greatest way, BTC should go lower on price but not making new lows on RSI ,thus bullish divergence of a strong variety will occur.
Non financial advises just educational stuff :).

Bitcoin and possible declineAfter the fall of Bitcoin price and staying in the range of $20,300, a smaller drop is likely
TIME : 4 H
SIDE : SELL
BUY 0r SELL ZONE : 20340
TAKE PROFIT : 19850
STOP LOSS : 20600
R/R = 2
MIDTERM SIGNAL
#CRYPTO
#BTC

Bitcoin- A flower doesn't make it springIn my previous analysis, I said that a break above 22k resistance could lead to further gains and a test of the next important resistance at 25k.
However, after the break and a local high of 22.700, CPI data from US triggered a massive selloff and Bitcoin dropped more than 10% from top to bottom.
Considering this false break, the large bearish engulfing, and the downwards direction of the trend, most probably Bitcoin will break also under 20k soon.
In my opinion, this will be Bitcoin's next move and a visit to the 18k previous low is now unavoidable.
Sell rallies against 22k is my strategy for BTC for the short term
In the longer term, a break under 18k would bring panic into the market, and 12.500 would be in focus next. (Considering my outlook for SP500 and other US indices this is a very probable scenario)
BTC making 2 bullish shark harmonicsLeft Chart : We a have a bullish shark harmonic in process of developing which will complete at $17,870 level, Invalidation or stop-loss for this will be $17,032. If this level breaks down then we will possibly stop at $13k-$15k levels although I still feel we won't go down that further but anything can happen in crypto.
Right Chart : Bullish shark harmonic identified on a daily chart which is in play at the moment, Invalidation point is $17,994 and near to that another 🦈 will complete.
So we have 2 confluences for bullish price action and I know most people would find it funny but in these dark times we do need something positive. Lets see what unfolds in coming weeks.

Wedge target $19274 shark target $18929BTC was unable to hold its major support of ascending broadening wedge and broke down. Next possible target is at demand zone of $19,274 whereas final technical target of broadening wedge is $17,737.
A bullish shark harmonic is in process of developing which will complete at $18,929. Invalidation of that will be $17950.
Avoid futures trading for some days, Sometimes no trading is the best the strategy

BTC / USD - We are at this point...I believe that we are at the orange circle and we are going to pull another mega pump.
Do i really believe this? Maybe...
NOT FINANCIAL ADVICE boyos!

Possible (W) pattern for BTCBTC / USDT
BTC hit my first TP in my last analysis and still moving
Check previous idea here :
What Next ?
With that big green candle at support marked in my chart (possible reversal candle)
We now see a high chance for the price to make a (W) pattern or double bottom pattern toward 25k in next few days
Are you agree ?
Share with us in comment section below ⬇️

BTCUSD intraday trading & flying to the moon🚀 12 SEP 2022Bitcoin intraday trading alert
3 steps must fulfill before entry
1. 1st breakout done
2. Retracement done
3. 2nd breakout and see you in the sky🚀
Hope you like my Trading Alerts~
Cheers~

BTC - HOURLY ANALYSISBTC is on a very critical position right now.
This highlighted resistance is respected previously as well.
FIB .5 level is also present in this resistance area.
Suppliers' Order block availability as well.
Hourly Divergence found on RSI also.
If this area gets violated, long orders can be placed.
if rejected, a short entry can be taken until the weekly support area.

Bitcoin forecast and ideaPlease write any advice or suggestions.
Dear friends, request any cryptocurrency pair, currencies pair for forex, and any index that you want to be analyzed and ask any questions.
Thanks for your attention
Bitcoin vs tether / BTCUSD/ BTCUSDT

Bitcoin- Is this a genuine reversal? 25k holds the keyAfter the recent drop under 20k, Bitcoin found bids, and on Friday reversed strongly, gaining around 10% in a day and breaking above the recent falling wedge resistance (visible on short-term time frames)
Now, everyone is wondering if this is a genuine reversal and a resumption of the long-term bullish trend.
As a speculator, I try to be as objective as I can and look strictly at what the chart is telling me.
Looking at the weekly posted chart we can see that after 10 months of decline, BTC found support in 20k and the last 3 weeks of price action are showing an Evening Star candle formation which can be the first sign of reversal. However, the price is still under the falling trend line that started in Nov last year. More, Bitcoin has also a strong horizontal resistance in the 25k zone and as long as this confluence level is intact, we are still in a bearish trend.
That being said, in my opinion, this 25k zone holds the key and in order to speak of a bottom, we need a break above first.
A quick look into Total:
Total looks a little better than BTC. Of course, also here we have a downtrend that started in Nov last year and an Evening Star formation in the last three weeks, but this formation can be very well a higher low, which is more bullish than the double bottom (not yet confirmed) from Bitcoin.
Also here we have an important resistance ahead at 1.16T.
In conclusion, although I hope for a reversal, I'm only cautiously bullish at this moment.
Best regards!
Mihai Iacob

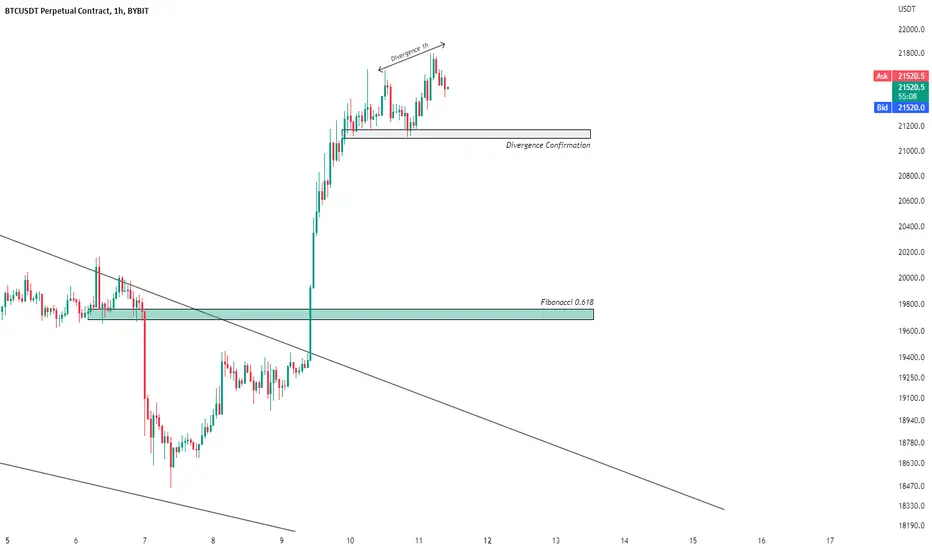
BTCUSDT | Divergence In 1h TimeframeIt is very clear that there is a divergence on the 1h timeframe
*To confirm the divergence, the price must penetrate the gray area, if successful , the price will go to the 0.618 area
Stay tune!
#BTC next target and resistance#Prediction #BTC next small support at 20,500 and target 21,8000 then 23,000. Keep eye over #BTC
For any help inbox me or post comment.

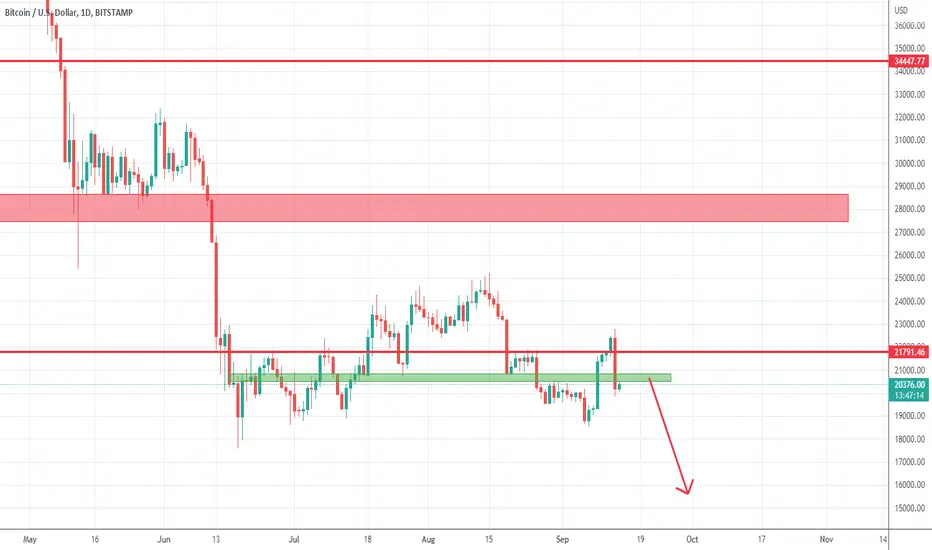
BTCUSDT Analyze The Next Move There are some points that you should know
* Still no bullish indicate
* In my vision, price will move up to around 22687.89
What is BTCUSDT doing on the green line (22687.89)?
The green line is the 0.618 area of Fibonacci, we can see again in the future, whether the price respects the green line or not
IF, the price respects the green line, the price will go down
IF NOT ,the price will test the key level as its second target
Just Stay Tune!

BTCUSDT 3D 🎂 Bitcoin price we expect $365k in 365 daysToday is our birthday - 2 years since two friends - traders created the PS Trade project.
And although we have different approaches to analysis and different trading styles, we are united by the desire to diversify our working days and share the experience we have gained over the years of trading cryptocurrencies with society.
For two years of public work, we have published more than 1500+ ideas on Tradingview, and you can evaluate the quality of their working out.
On the occasion of our holiday, we would like to present you a c-c-combo idea-analysis of the BTCUSDT trading pair
On the Bitcoin chart shows:
- Gann box, which shows critical trend breaks on the global graph
- Fibonacci levels on different timeframes, which historically work well as support and resistance levels, and also indicate future guidelines
- as well as fractal analysis - which shows the psychology of the behavior of market players.
So:
The minimum program is the growth of the BTCUSDT price according to the blue fractal and the achievement of the goal of $117-120k in the spring of 2023
The maximum program is the movement of the BTCUSD price with a white fractal and $365000 per BTC at the end of summer - at the beginning of autumn 2023
The critical zone , where the global trend can change its direction to growth, is in the zone of $32-37k
If the BTCUSDT price cannot be fixed above this zone, then the apocalyptic scenario that was published at the beginning of May 2022 with targets below $12-14k will be relevant
_______________________________
Since 2016 , we have been analyzing and trading the cryptocurrency market.
We transform our knowledge, trading moods and experience into ideas. Each "like under the idea" boosts the level of our happiness by 0.05%. If we help you to be calmer and richer — help us to be happier :)

Bitcoin price & market cap Growing!😮Bitcoin is growing by breaking the resistance and the price is rising towards $25,000 and the market cap is also increasing.
Bitcoin / BTCUSD and BTCUSDT
--------------------------------------------------------------
Please write any advice or suggestions.
Dear friends, request any cryptocurrency pair, currencies pair for forex, and any index that you want to be analyzed and ask any questions.
Thanks for your attention

BTC - BTCUSDT#BTC $BTCUSDT - DEEP CRAB Pattern - Daily Frame #This is my technical opinion and not a recommendation to buy or sell
