BTCUSD – 4H Chart AnalysisBTCUSD – 4H Chart Analysis
Educational purpose only
Current Price
BTCUSD ≈ 90,950
Market Structure
Price is in a short-term bearish phase after rejection from the upper resistance zone.
BTC is trading below key EMAs (21 & 50), showing weakness.
Price is approaching an important support area, where reaction is expected.
Support Levels
Support: 90,700 – 90,900
Main Support: 88,500 – 88,800
If price breaks and closes below 90,700, bearish continuation may extend toward the main support near 88,500.
Resistance Levels
Resistance: 92,900 – 93,200
R2 (Major Resistance): 95,500 – 95,800
Buy Scenario
A strong 4H close above 93,200 may indicate recovery.
Above resistance, price could move toward 95,500 – 95,800.
Buyers need confirmation above EMAs.
Sell Scenario
Failure to hold 90,700 support keeps bearish pressure active.
Below support, downside may extend toward 88,500 – 88,800.
Summary
Below resistance → bearish bias remains.
Above resistance → bullish recovery possible.
Wait for clear breakout confirmation at key levels.
For educational purposes only.
Btcusdlong

BTCUSD Time for LONG1h - bullish divergence
4h - hidden bullish divergence
15m - new low with US open and than it could star the bullrun on 15m
Target for this movement will be 93k
Stay profitable !

BTCUSD (45-Min) — Bearish Structure With Weak Momentum, WatchingMarket Structure
Price is forming lower highs, respecting a descending trendline (red dashed line).
This indicates a short-term bearish trend.
Current price is around 95,090, struggling to break above recent minor highs.
2. Price Action
Recent candles show small-bodied candles → lack of strong buying pressure.
Rejections near 95,200–95,300 suggest this area is acting as near-term resistance.
Downside pressure remains dominant unless the trendline is clearly broken.
3. RSI (14)
RSI is around 46, below the neutral 50 level.
This confirms bearish momentum, but not oversold.
No strong bullish divergence visible yet → sellers still have control.
4. AO (Awesome Oscillator)
AO is negative (-65) and flattening.
Indicates weak bearish momentum, not aggressive selling.
Often precedes either consolidation or a continuation move.
5. MACD
MACD lines are below zero and moving sideways.
Histogram is weak → momentum is bearish but slowing.
No bullish crossover yet, so trend reversal is not confirmed.
6. Key Levels
Resistance:
95,200 – 95,300
Trendline resistance above current price
Support:
94,650
94,400 (next major downside target if support breaks)
7. Bias & Scenarios
Bearish Bias: While below the descending trendline.
Bearish Continuation:
Break below 94,650 → possible move toward 94,400 or lower.
Bullish Invalidation:
Strong close above 95,300 + trendline break → shift toward 95,600–95,800.

BTCUSD: Watching for the 91,000 Pullback | 38.2% Resistance HoldWe are seeing a very gradual, controlled increase. However, the price is currently bumping its head against a major resistance before the next big leg up. Looking for a pullback to the 91,000 level is good opportunity to buy After the pullback, we could see further increase towards to 98k-103k levels.

: BTCUSD Daily Chart – Rising Trendline Holds, Momentum ImprovinPrice Structure
Bitcoin is trading around $95,000, respecting a rising trendline from the December lows.
The market has shifted from a strong downtrend (Nov) into a higher-low / higher-high structure, suggesting a short-term bullish recovery.
Price recently pulled back slightly after testing the $98k–$99k resistance zone, which is acting as near-term supply.
Trend & Support/Resistance
Key Support:
Trendline support: $92k–$93k
Horizontal support: $88k–$90k
Key Resistance:
Immediate: $98k–$99k
Major psychological level: $100k–$107k (next upside zone if breakout occurs)
RSI (14)
RSI is around 61–62, above the neutral 50 level.
This indicates bullish momentum without being overbought yet.
No clear bearish divergence at the moment; momentum remains constructive.
MACD
MACD lines are crossed bullish and flattening slightly.
Histogram remains positive, suggesting upside momentum is still present but losing some acceleration.
AO (Awesome Oscillator)
AO has turned positive (green bars), supporting the bullish continuation bias.
Momentum is improving compared to December.
Overall Bias
Short-term bias: Bullish to neutral
As long as price holds above the rising trendline, buyers remain in control.
A clean daily close above $99k could open the door to a $100k+ breakout.
A breakdown below $92k would weaken the bullish structure and signal a deeper pullback.

BTC SCALP Bitcoin looking to head back to it’s recent highs to complete the full price pattern , therefore we can scalp in towards the direction and make sure to always secure some profits or (Trial Stop)

BTCUSD Bullish Price Objective — Target 98,000BTCUSD continues to trade with a constructive bullish bias, supported by strong demand zones and sustained buyer interest. Price action reflects ongoing accumulation, with the market respecting higher levels and maintaining upside pressure.
Based on the current structure and order-flow behavior, the primary bullish objective remains 95,000. This level represents the next significant upside target where price is expected to gravitate as long as bullish conditions persist.

BTCUSDT – Daily Market Structure UpdatePrice is currently trading within a well-defined daily support zone following the recent bearish impulse. The sharp reaction into this area suggests sell-side momentum is weakening, and the market is now entering a period of balance rather than continuation to the downside.
I expect Bitcoin to consolidate within this daily range over the coming days as price digests the prior move and liquidity accumulates. This sideways behavior is constructive and often forms the base for the next expansion phase.
Provided this zone continues to hold, the higher-timeframe structure remains intact. A clean breakout and daily close above the consolidation high would signal renewed bullish intent and increase the probability of a push toward higher resistance levels. Until then, patience is warranted as the market develops its next clear setup.

BITCOIN - buy bitcoin nowBITCOIN (BTC/USD) has recently been stuck inside a triangle channel pattern and has struggled to break out for a few weeks. However, the price has recently broken a strong resistance level (the white trend line shown on the chart) - The price is currently above the trend line which acted as a strong resistance level and is now very likely to hit the next resistance zone which is labeled as the take profit level. time to buy BITCOIN now!

BTC is taking support at 90299.as you can see btc is taking support at 90.299 if it break we can short but it take support we can take trade in same direction with perfect candel stick conformation.
plan your trade accordingly.

BTCUSD (4H) – Bearish Structure After Distribution, ConsolidatioMarket Structure:
The chart shows a clear bearish shift after the January impulsive rally.
A BOS (Break of Structure) to the upside occurred first, followed by distribution and then a CHoCH (Change of Character) to the downside, confirming loss of bullish control.
Price is now making lower highs and lower lows, respecting a descending trendline, which reinforces bearish bias.
Key Levels & Zones:
Supply / Resistance:
~93,500–94,500 (previous highs & rejection zone)
~92,000–92,500 (mitigated area / prior structure)
Current Price: ~90,574, trading below key structure and trendline.
Demand / Support:
~87,800–88,500 (FVG / demand zone)
Below that, next liquidity rests near ~85,500.
Fair Value Gaps (FVG):
The lower FVG remains unfilled, acting as a bearish magnet if downside continuation occurs.
Upper FVGs have mostly been mitigated, reducing bullish fuel.
Bias & Scenarios:
Primary Bias: Bearish continuation while price remains below ~92,000.
Bearish Scenario:
Consolidation → breakdown → move toward 88,500 FVG, possibly extending to 85,500.
Invalidation / Bullish Shift:
Strong reclaim and close above 92,500–93,000, breaking the descending trendline, could open continuation toward 94,500+.
Trading Insight (ICT / SMC perspective):
Favor sell-on-rallies into premium zones and trendline resistance.
Wait for lower-timeframe CHoCH confirmation for entries.
Avoid longs unless structure flips decisively.

BTCUSD (4H) – Consolidation Below Key Volume Node After PullbackMarket Structure: On the 4H timeframe, BTCUSD shows a strong impulsive rally followed by a corrective pullback and current sideways consolidation. Price is holding above prior higher lows, so the medium-term structure remains bullish, but momentum has clearly cooled.
Price Action: After topping near the recent swing high (~93k area), price retraced and is now ranging around 90,500. The candles show indecision (overlapping bodies and wicks), suggesting balance rather than trend at the moment.
Volume Profile (Right Side):
A high-volume node (HVN) is visible roughly around 90k–91k, indicating a fair value area where buyers and sellers agree.
Below, another significant volume cluster appears near 88k–89k, which should act as strong support if price breaks down.
Above current price, thinner volume up toward 92k–93k suggests that if price breaks and holds above the HVN, movement could be relatively fast.
RSI (14): RSI is around the mid-40s, below the neutral 50 level. This confirms lack of bullish momentum, but it is not oversold—more consistent with consolidation than reversal.
Bias & Scenarios:
Bullish scenario: Acceptance above ~91k suggests continuation toward 92.5k–93k, where prior supply sits.
Bearish scenario: Loss of ~89.8k–90k acceptance could lead to a rotation down toward 88k, aligned with the next major volume node.
Most likely near-term: Continued range-bound price action until a clear breakout from the volume area.

Bitcoin (BTCUSD) – Bullish Breakout with Pullback to Demand (4H)Market Structure
Overall bias: Bullish continuation
Price formed a strong accumulation base inside the red demand zone (≈ 86,500–89,000).
A clean breakout from the range led to a rising price channel, confirming trend strength.
Current move is a healthy pullback, not a breakdown.
🔑 Key Zones & Levels
🟥 Demand / Support Zone
Major demand: 86,500 – 89,000
This zone acted as:
Accumulation
Breakout base
Strong institutional demand area
As long as price holds above ~89K, bullish structure remains intact.
🔄 Pullback Area
Current price retraced from the channel high (~94–95K).
Pullback is corrective, forming potential higher low.
Ideal reaction zone: 90,000 – 92,000
⬆️ Resistance / Target
Primary target: 95,000 – 95,200
Previous high
Marked “TARGET POINT” on your chart
Break and hold above this level → opens room for 97K+
🎯 Trade Scenario (Based on Your Setup)
Bullish Scenario (Primary Bias)
Price respects 90K–89K
Bullish confirmation (strong 4H close, rejection wick, higher low)
Continuation toward 95K
Bearish Scenario (Invalidation)
Clean break and 4H close below 86,500
Would indicate:
Failed breakout
Deeper correction toward 83K–84K
📊 Price Action Insights
Higher highs & higher lows remain intact.
No strong bearish engulfing or distribution signals.
Volume expansion on breakout supports continuation bias.
🧠 Summary
Trend: Bullish
Phase: Pullback after breakout
Key decision zone: 89K–90K
Upside target: 95K+
Bias: Buy pullbacks while above demand

BTC/USD 4H – Range Breakout Holding Above Key Support*Overall Market Structure
Trend: Short-term bullish continuation
BTC has broken out of a prior consolidation range and is making higher highs and higher lows.
Price is currently above a key support zone, suggesting strength.
📦 Key Zones & Levels
🟦 Major Support Zones
$89,750 – $91,350 (Primary Support)
Former resistance → now acting as support
Price is currently retesting this zone
Strong area for bullish defense
$85,800 – $87,600 (Secondary Support)
Previous accumulation range
If price loses the upper support, this is the next high-probability bounce zone
🎯 Resistance / Target
$98,200 (Target Point)
Clear horizontal resistance
Matches prior rejection / liquidity area
Logical upside target if support holds
📈 Bullish Scenario (High Probability)
Price holds above $89.7k
Consolidation or shallow pullback
Continuation move toward:
$94k → $98.2k
Break and close above $98.2k could open the door to $100k psychological resistance
📉 Bearish / Pullback Scenario
Loss of $89.7k support
Price likely revisits:
$87.6k
Then $85.8k
As long as price stays above $85.8k, the macro bullish structure remains intact
🧠 Market Behavior Insight
The clean breakout + retest pattern suggests smart money accumulation
Sharp rejection from support would confirm buyers in control
Choppy price inside the support zone = healthy consolidation, not weakness
✅ Summary
Bias: Bullish
Key Level to Watch: $89,750
Upside Target: $98 200
Invalidation: Clean 4H close below $85,800

BTC/USD Daily Chart – Bullish Recovery Attempt After Deep PullbaOverall Structure
Bitcoin is in a recovery phase following a sharp decline from the previous highs.
Price is forming higher lows, suggesting buyers are regaining control in the short term.
The market remains below all-time highs, so this move is still considered a corrective rally within a larger cycle.
Trendline Behavior
Price is respecting a rising support trendline, which acts as dynamic support.
As long as BTC holds above this trendline, the bullish recovery structure remains valid.
A breakdown below the trendline would weaken the current bullish bias.
Momentum Indicators
RSI (14): ~60
Indicates moderate bullish momentum.
RSI is not overbought, leaving room for further upside.
MACD (12,26,9):
MACD lines are crossing upward.
Momentum is improving but still in an early expansion phase.
Awesome Oscillator (AO):
Histogram has turned green, confirming positive momentum shift.
Key Price Levels
Immediate Support: $90,000
Major Support: $84,000–$86,000
Immediate Resistance: $95,000–$96,000
Next Upside Targets: $100,000 and $104,000
Market Bias
Short-term bias: Bullish while above $90k and trendline support.
Mid-term bias: Neutral-to-bullish, pending a confirmed breakout above $96k.
Volume expansion on a breakout would be critical for confirmation.

BTC/USDT (Bitcoin) long set upBTC Long set up
Entry Price 1: $90,500
Entry Price 2: $88,500
Stop Loss: $87,000
Take Profit 1: $93,500 (Close 25%)
Take Profit 2: $96,000 (Close 50%)
Take Profit 3: $99,500 (Close 75%)
Take Profit 4: $104,500 (Close 100%)
Status: ACTIVE

BTCUSD 1H – Bullish Structure with Short-Term Resistance and PotTechnical Analysis (1-Hour Chart)
Market Structure
Bitcoin is in a clear bullish market structure on the 1H timeframe.
Multiple BOS (Break of Structure) labels confirm continuation to the upside.
Earlier CHoCH (Change of Character) marked the transition from consolidation/bearishness into the current uptrend.
Price is respecting higher highs and higher lows, indicating strong trend control by buyers.
Price Action & Key Levels
Current price: ~91,395 USD
Price is trading near recent highs, just below a descending trendline resistance (blue dashed line).
A premium zone is visible near the highs, suggesting price may be temporarily overextended.
Below price:
FVG (Fair Value Gap) zone acts as a strong bullish retracement area.
This zone is a logical area for pullback and continuation if the trend remains intact.
Momentum Indicators
RSI (~64.7):
Bullish but approaching overbought territory.
Suggests momentum is strong, but upside may be limited short term without consolidation.
MACD:
MACD lines remain above zero with a mild bullish crossover.
Momentum is positive, but histogram shows slowing acceleration → possible short-term cooldown.
Volume
Volume is steady, not showing major distribution yet.
No clear bearish divergence, which supports trend continuation after a retracement.
Bias & Scenarios
Bullish Scenario (Preferred)
Price pulls back into the FVG / demand zone, holds structure, then continues upward.
A clean break and close above 91,800–92,000 USD would open continuation toward 93,500+.
Bearish / Correction Scenario
Rejection from the trendline + premium zone could trigger a healthy pullback.
Loss of the FVG would expose deeper retracement toward 89,800–88,800 USD, still within bullish structure unless that support fails.

Bitcoin (BTCUSD) Daily Chart – Potential Bullish Reversal Above Market Structure
BTC experienced a strong downtrend from the October high, followed by a base formation in December.
Price is now forming higher lows, suggesting a potential trend reversal or early-stage uptrend.
The ascending trendline (dashed blue) indicates growing bullish structure if respected.
2. Support & Resistance
Key Support:
~$89,150 (marked level)
Psychological zone: $85,000–$88,000
Immediate Resistance:
$92,000–$94,000
Major Resistance Target:
$100,000–$102,000 (previous breakdown area)
3. RSI (Relative Strength Index)
RSI is around 54, moving upward.
This shows bullish momentum building, but not yet overbought.
Confirms a healthy recovery, not an exhausted move.
4. MACD
MACD lines are converging upward.
Histogram is improving toward zero → bearish momentum is fading.
A bullish crossover would strengthen upside confirmation.
5. Momentum / Volume
Selling pressure has clearly weakened.
Momentum indicators suggest accumulation rather than distribution.
Bias & Outlook
Short-term bias: Mildly bullish
Confirmation needed: Daily close above $92k with volume
Invalidation: Break below $88k would weaken the bullish case

BTCUSD 15M, 30m, 1Hr Breaking upwards, alignment formingHeres another videio guys on the mighty Bitcoin.
Intraday breaking out somewhat, moving cleanly up and through a bearish order-block.
IO also explain how I use momentum indicators to confirm future price swings in the traders direction.
The True Strength Index or TSI functionality is similar to MACD but its more accurate in short term trading and it can dictate / capture the longer term trend. (* My bias and finding only. Also, never wait for cross down eg. Macd crossing down X Signal line on very high timeframes. Profits will be handed back.
Exit on other confluences like bears OBlock's but in combination with several other cue's like a bearish pinbar, trendlines etc, RSI & Stochastics are faster than MACD, & TSI, when they are pointed skywards still its a good chance what you just witnesses was a pullback and the bullish uptrend is intact.
Tomorrows trading is interesting, USD index looks to move higher, EURUSD in a short term downtrend and I think Bitcoin will stay on the heals of the USD which normally wouldn't do, why how, is its releasing from its coiling and bullish momentum still building.

A quick look at Bitcoin. It loves the big dates. Happy New Year!To be totally honest I was watching the gold price in relation to a firm DXY during yesterdays session Wednesday which at 8am NY time became 2026 here in Australia.
Bitcoin on the RSi a couple of times dipped below the key 50 RSI level and snapped back.
BTCUSD was at a similar level 6 months into its breakout at President Trumps 2nd election victory. Watch for a jump from its 200ema if it should happen.
I'll share a secret, i've traded a few of these breakouts with Bitcoin up close on the second timeframes where it all begins and what i'd say is that price is always looking for for its next upwards move and Bitcoin is not overbought. The tight range is about to spring the 'golden child' to its next move, I'll keep that direction to myself as its not proper to state otherwise.
Enjoy the trading day. Happy 2026,
Chris
MusicalNightz

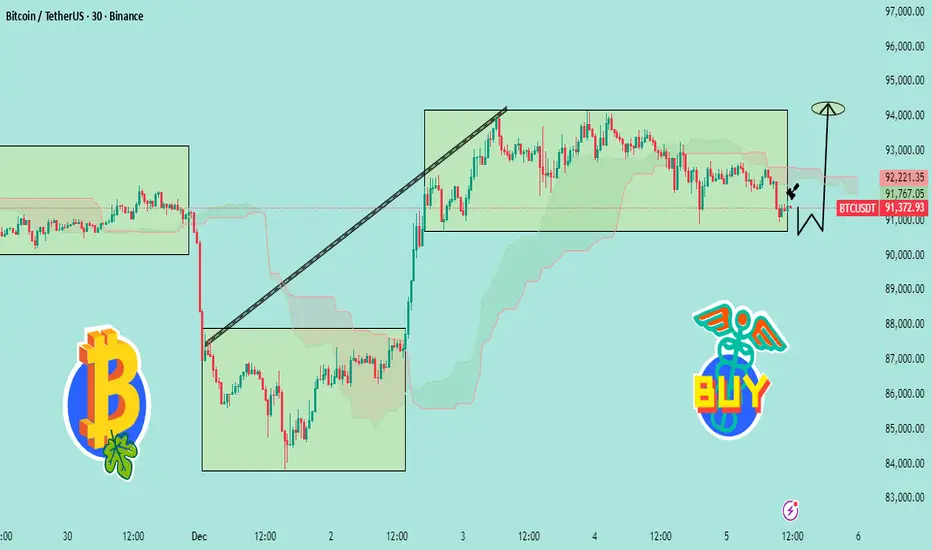
“BTC Bounce From Demand Zone – Targeting 94K Next📊 BTCUSDT Analysis (Based on Your Chart)
1️⃣ Price is Still Respecting the Range
Bitcoin is trading inside a wide consolidation box (around 91,000 – 93,000).
The recent drop tapped the bottom of the range, showing a clean liquidity sweep.
That wick below the box = fake breakdown → bullish signal.
---
2️⃣ Strong Reaction at Demand Zone
The chart shows BTC touching the demand/support zone, followed by a small bullish reaction (the black arrow).
This suggests:
Sellers failed to break lower
Buyers are stepping in exactly where expected
Market preparing for a reversal bounce
---
3️⃣ Expected Move (Your W Pattern Idea)
The drawn “W-shape” indicates a double bottom setup.
If the bottom holds around 91,000, BTC can push back toward:
🎯 Target: 93,500 – 94,000
This matches the upper boundary of the consolidation.
---
4️⃣ Bullish Scenario
If BTC holds above 91,000–91,300:
Reclaim mid-range
Break through resistance
Continue toward 94,000+
This aligns with the “BUY” tag you added.
---
5️⃣ Bearish Invalidations
Bullish idea is invalid if: ❌ Price closes below 90,800 on 30-minute
= fresh breakdown → deeper correction
---
🧠 Summary
BTC swept liquidity at the support → formed a bounce → still inside range → bullish reversal expected toward 94K
Getting the alignment across most TF's Bitcoin. BuyWaiting on the Daily to align, price needs a good push upwards from these levels triggering Daily & we will finally be off to the races.
Or it could all be a fakey. Lol.
But I think that as currencys like AUD USD and EUR USD , Gold price, silver, metals, will more than likely start the week strong in Asia in about 12 hours time. 22:00 AUD time now. This would fuel the rally in bitcoin and usual hangers on.
Where is DOGEUSD? Last time i saw its price I thought, thats a buy.
1st try and get a break above on 30m chart.

Combining very low TF's for breakouts on Bitcoin. Long only.The video is for educational, demonstration purposes only.
It's a style of trading which you wont find much information about, definitely not from brokers.
This is not specifically scalping, as all timeframes are considered.
It's also about managing the trade concurrently. Because it can be combined with alll sytles of trading and if intraday TF's are moving bearish, it might be a good time to exit your position.
