BTCUSD Rebound & ConsolidationToday, BTCUSD is experiencing a narrow-range consolidation following a oversold rebound. Despite bouncing roughly 3% from its overnight low, the bearish structure on the daily timeframe remains intact. Market sentiment stays cautious, and the short-term trend will still hinge on the defense of key price levels and upcoming macroeconomic data releases.
The November U.S. nonfarm payroll data delivered a strong headline but weak internals outcome. It neither altered market expectations for the Federal Reserve’s monetary policy nor provided clear unilateral guidance. Meanwhile, year-end institutional settlements have triggered liquidity tightening, coupled with a slowdown in stablecoin growth, which has weighed on Bitcoin’s short-term risk appetite. Additionally, expectations surrounding the Bank of Japan’s interest rate hike remain uncertain—an unexpected 50-basis-point rate hike could spark a fresh round of correction in Bitcoin prices.
On the support front, the $85,000–$86,000 zone serves as the core support range. This level not only marks the early November low but also encompasses the average cost basis of U.S. spot Bitcoin ETFs. Approximately 400,000 BTC were purchased within this range, making it a robust structural support for the year. A breakdown below this zone would open the door to a further decline toward $80,000–$82,000.
For resistance, the initial hurdle lies at $88,000–$88,500 (yesterday’s rebound peak), with further resistance at $89,700–$90,500. A decisive breakout above this upper resistance band would pave the way for a potential rally toward $94,000.
In summary, BTCUSD is likely to trade within the $85,000–$94,000 range in the short term. Going forward, focus should be placed on the U.S. inflation data and remarks from Federal Reserve officials scheduled for Thursday. Ahead of the release of these key data points and policy signals, the market will most likely adopt a wait-and-see stance, with prices lacking a clear directional bias.
Trading Strategy:
Buy 86000 - 86500
SL 85500
TP 87500 - 88000
Sell 88000 - 88500
SL 89000
TP 86000 - 85500
Btcusdprediction

Bitcoin Weakness Unfolding – Kijun Break Confirms Bear Bias🚨 BITCOIN (BTC/USD) BEARISH PROFIT PATHWAY 🚨
Hey Traders! 👋 A compelling bearish setup is unfolding on PURPLETRADING:BTCUSD. This swing trade plan leverages a classic Ichimoku signal with a sophisticated entry method for optimal risk distribution.
📉 THE BEARISH THESIS:
The bearish momentum is confirmed by a decisive breakout BELOW the Kijun Sen (Baseline). This indicates a significant shift in medium-term momentum, favoring the sellers.
🎯 MY TRADING PLAN:
Direction: BEARISH 🐻
Style: Swing Trade
Strategy: "The Thief" Layer Entry
⚡ ENTRY STRATEGY (The "Thief" Layer Method):
Instead of one risky entry, we use multiple sell limit orders at key resistance levels. This averages our entry price and builds a position as price moves in our anticipated direction.
Proposed Sell Limit Layers:
Layer 1: 96,000.00 🟥
Layer 2: 94,000.00 🟧
Layer 3: 92,000.00 🟨
Layer 4: 90,000.00 🟩
You can adjust the number of layers and prices based on your capital & risk appetite.
🛑 RISK MANAGEMENT (STOP LOSS):
A safety stop loss is placed above a key resistance zone at 98,000.00.
⚠️ IMPORTANT NOTE: This is MY plan. You MUST adjust your stop loss based on your personal risk tolerance and strategy. Protect your capital!
🎯 PROFIT TARGET (TAKE PROFIT):
Our primary target is 82,000.00, where we expect a confluence of:
Strong Support from the Triangular Moving Average (TriMA).
Oversold Conditions on lower timeframes.
A potential bull trap being sprung.
💡 SMART EXIT TIP: Consider taking partial profits on the way down. You are NOT obligated to hold until the final target. Secure profits according to your own plan!
🔍 RELATED ASSETS & KEY CORRELATIONS:
Watching these related markets can provide confirmation and strengthen the thesis:
TVC:DXY (U.S. Dollar Index): 🟢 A stronger DXY often puts downward pressure on Bitcoin. Watch for bullish momentum in the dollar as a tailwind for this bearish BTC setup.
BITSTAMP:ETHUSD (Ethereum): Crypto majors often move in tandem. If Ethereum shows similar weakness and breaks key supports, it confirms a broader crypto market pullback.
^SPX (S&P 500 Index): In recent years, BTC has shown correlation with risk-on assets. A declining stock market could accelerate the sell-off in Bitcoin.
AMEX:GBTC (Grayscale Bitcoin Trust): Monitor for significant discounts or premiums to NAV, as it can reflect institutional sentiment.
✅ LIKE & FOLLOW if you find this analysis helpful! It helps the algorithm and keeps you updated on my latest market insights. ✅
📣 Let me know your thoughts in the comments! Are you bullish or bearish on Bitcoin here? 👇

ElDoradoFx PREMIUM 3.0 – BTCUSD PRO ANALYSIS (07/12/2025)1. Market Overview
BTC is trading inside a contracting corrective structure after rejecting the 89,750–89,850 supply zone. Price failed to sustain above the intraday EMAs and shifted momentum bearish. Liquidity remains heavy below current price, and MACD shows continued bearish pressure across short- and mid-timeframes. Weekend conditions favour engineered sweeps into deeper demand before any strong reversal attempt.
⸻
2. Technical Breakdown
🔹 Daily (D1)
• BTC remains in a broader retracement phase after major rejections at 97,400 and 104,000.
• EMAs overhead continue acting as dynamic resistance.
• Short-term relief rallies lack follow-through; price is at risk of retesting 88,000–87,500.
• Momentum is flattening but still bearish (MACD increasing negative histogram).
🔹 H1
• Strong rejection at 89,750 followed by BOS to the downside.
• Price now trades under both 50/200 EMAs, retesting them as resistance.
• Trendline support from prior swing low is being tested.
• Demand pockets: 89,350 → 89,200 → 89,000 → 88,800 (PDL).
• Structure remains bearish unless 89,750 is reclaimed with conviction.
🔹 15M–5M
• Clear lower-high sequence with repeated CHoCH → BOS confirmations.
• Sellers defended the supply zone aggressively.
• MACD flipped short with strong follow-through; RSI mid-range but with bearish slope.
• Liquidity clusters align below: 89,200, 89,000, 88,800 → highly attractive for engineered sweeps.
⸻
3. Fibonacci Analysis (Golden Zone)
Swing: 88,899 → 89,750
• 38.2% = 89,450
• 50% = 89,325
• 61.8% = 89,200
🎯 Golden Zone: 89,450 – 89,200
This aligns perfectly with intraday demand and previous liquidity builds.
⸻
4. High-Probability Trade Scenarios
📈 BUY Scenario (Countertrend Only)
Buy Zone:
• 89,200 – 89,000 – 88,800 (PDL sweep preferred)
Targets:
• 89,350 → 89,500 → 89,750
Stop-Loss: below 88,700
Confirmation Needed:
• Wick rejection at demand
• MACD re-flip long
• 5M BOS to confirm reversal structure
⚠️ Note: This is a counter-trend setup.
⸻
📈 BUY Breakout Scenario
Trigger: Break & hold above 89,750
Retest: 89,600–89,650 holding as support
Targets:
• 90,050 (PDH) → 90,300 → 90,750
Stop-Loss: 89,200
⸻
📉 SELL Scenario (Primary Setup)
Sell Zone:
• 89,600 – 89,750 (major supply zone)
Targets:
• 89,350 → 89,200 → 89,000 → 88,800 (PDL)
Stop-Loss: 89,900
Why this is preferred:
• Strong momentum confluence
• EMA rejection
• Multiple CHoCH/BOS confirming bearish control
⸻
📉 SELL Breakout Scenario
Trigger: Break below 89,000
Retest Fail Zone: 89,050–89,100
Targets:
• 88,800 → 88,400 → 88,000
Stop-Loss: 89,350
⸻
5. Fundamental Watch
• Weekend trading = algorithmic liquidity hunts, low-volume manipulations.
• No major fundamentals expected; movement will be structure-driven.
• Liquidity below is highly attractive; expect volatility near 89,200 / 89,000.
⸻
6. Key Technical Levels
Resistance:
• 89,600 / 89,750 / 90,050 / 90,300
Support:
• 89,350 / 89,200 / 89,000 / 88,800
Breakout Buy Trigger: > 89,750
Breakout Sell Trigger: < 89,000
⸻
7. Analyst Summary
BTC sentiment remains short-term bearish with strong structural, momentum, and EMA confluence. The sell zone at 89,600–89,750 remains the primary area of interest. First key liquidity target sits at 89,200, with deeper sweeps into 89,000–88,800 likely if momentum persists.
Countertrend longs only activate after confirmation at those deeper zones.
⸻
8. Final Bias Summary
Primary Bias: Bearish below 89,750
Bullish Only If: Price reclaims and holds above 89,750
Key Decision Zone: 89,200–89,000
⸻
🥇 ElDoradoFx PREMIUM 3.0 – PERFORMANCE 05/12/2025 🥇
⚡ Smart Entries. Consistent Wins.
📈 BUY +570 PIPS (From 04/12)
📈 BUY +500 PIPS (From 04/12)
📈 BUY +40 PIPS
🟥 SELL -55 PIPS (SL)
📈 BUY +120 PIPS
📈 BUY +210 PIPS
📈 BUY +20 PIPS
🟥 BUY -40 PIPS (SL)
📈 BUY +20 PIPS
📉 SELL +60 PIPS
━━━━━━━━━━━━━━━
💎 SWING TRADES – STILL RUNNING
🔵 BUY → +3,005 PIPS
🟣 BUY → +2,260 PIPS
🟢 BUY → +1,390 PIPS
📊 Long-term swing positions continue to dominate, while intraday precision adds consistent controlled gains.
━━━━━━━━━━━━━━━
💰 TOTAL PIPS GAIN: +1,445 PIPS
🎯 8 Wins · 2 SL
🔥 80% Accuracy
━━━━━━━━━━━━━━━
✅ A powerful close to the week — strong swings + clean intraday setups delivering exceptional profit.
— ElDoradoFx PREMIUM 3.0 Team 🚀

ElDoradoFx – BTCUSD ANALYSIS (09/11/2025, WEEKEND EDITION) (09/11/2025, WEEKEND EDITION)
⸻
1. Market Overview
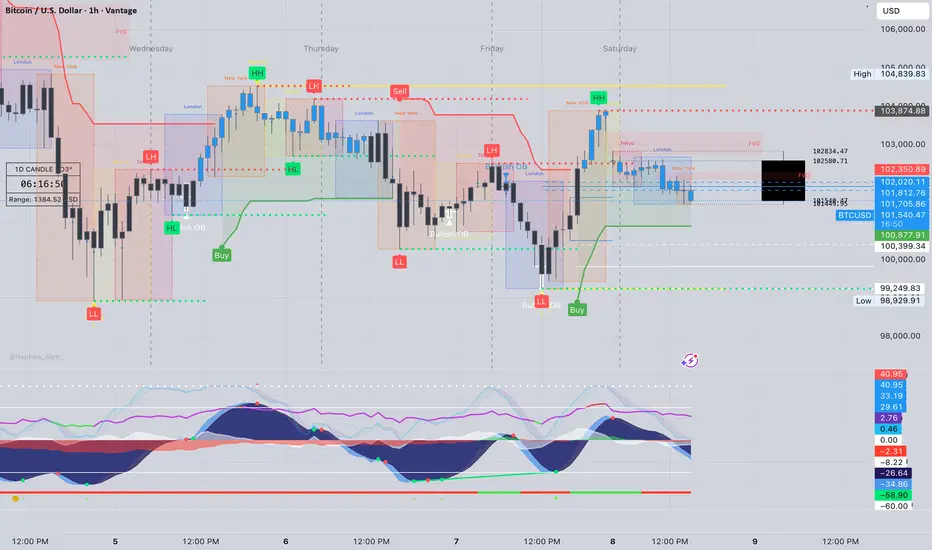
Bitcoin (BTCUSD) remains under bearish pressure around $101,500, extending its correction from the recent $103,800 recovery peak. Price action confirms a sustained rejection at the $102,600–$103,000 supply zone, with downside continuation now favored as sellers maintain control.
The broader market context shows BTC trapped between the $102,600 ceiling and $99,200 floor, forming a descending channel. Unless bulls reclaim $102,600+, momentum remains bearish heading into next week’s macro calendar (CPI & PPI releases).
⸻
2. Technical Breakdown
🔹 Daily (D1):
• BTC continues trading below the 20EMA, 50EMA, and 100EMA — confirming sustained bearish structure.
• RSI ~38, indicating weak momentum and no signs of trend reversal.
• MACD histogram continues printing red bars, showing continuous sell-side pressure.
• Price remains within a macro range between $99,000–$108,000, with downside favored until structure shifts.
🔹 H1:
• Strong rejection from descending trendline at $102,300–$102,600.
• CHoCH confirmed to the downside below $101,800.
• EMAs aligned bearish (20 < 50 < 200).
• RSI below 45; MACD momentum fading — signals bearish continuation likely.
🔹 15M–5M:
• Structure shows lower highs and weak pullbacks.
• Minor demand zone at $101,000–$100,900; break of this level could trigger a liquidity sweep toward $99,200.
• RSI near 36 with weak MACD cross — short-term bounce possible but unsustainable without strong volume.
⸻
3. Fibonacci Analysis (Last Swing: 103,896 → 99,249)
Level Price (USD) Comment
38.2% 101,037 First retracement / initial resistance
50.0% 101,570 Mid-zone equilibrium
61.8% 102,090 Key reaction level within supply zone
🎯 Golden Zone: 101,000 – 102,090 → Acting as intraday supply zone for high-probability sells.
⸻
4. High-Probability Trade Scenarios
📉 Bearish Continuation Setup (Main Bias)
• Entry Zone: 101,900 – 102,400 (Golden Zone retest)
• TPs: 101,000 → 100,000 → 99,200 → 98,800
• SL: Above 102,600
• Confirmation: Rejection candle + RSI failure to cross 50
• Rationale: Retest of former support turned resistance within descending structure; EMAs and momentum indicators favor continuation.
💥 Breakout SELL Setup
• Trigger: 1H candle close below 100,900
• Retest Zone: 101,100 – 101,300
• TPs: 100,000 → 99,200 → 98,500
• SL: Above 101,600
• Rationale: Structural break of key demand; confirms continuation of broader downtrend.
📈 Countertrend BUY Setup (Low Probability)
• Entry Zone: 99,200 – 98,900 (Liquidity Sweep Zone)
• TPs: 100,800 → 101,600 → 102,400
• SL: Below 98,700
• Confirmation: Bullish divergence on RSI or MACD + absorption wicks
• Rationale: Potential liquidity collection zone where short covering may occur; low conviction long setup.
⸻
5. Fundamental Watch
• Weekend volatility remains thin; potential for stop-hunts before Monday’s open.
• DXY holding above 105 supports bearish sentiment in BTC.
• No major macroeconomic catalysts until early next week — expect range-bound but reactive price behavior.
• CME futures gap near $102,800 could attract a brief fill before resumption lower.
⸻
6. Key Technical Levels
Type Levels (USD)
Resistance 102,400 / 102,600 / 103,000 / 105,800
Support 101,000 / 100,000 / 99,200 / 98,900
Golden Zone 101,000 – 102,090
Break Buy Trigger > 102,600
Break Sell Trigger < 100,900
⸻
7. Analyst Summary
BTC is consolidating under the 102K–103K ceiling, showing clear exhaustion from buyers and renewed strength from sellers. The Golden Zone (101,000–102,090) offers the highest-probability sell opportunities for continuation to 99K.
Momentum, EMAs, and trend alignment all support a bearish outlook unless price cleanly reclaims 102,600+ on H1 structure.
⸻
8. Final Bias Summary
✅ Primary Bias: Bearish below 102K — selling rallies within the 101–102K zone targeting 99K.
⚠️ Secondary Bias: Bullish recovery only if 102,600 breaks with volume and structure shift confirmed.
⸻
— ElDoradoFx PREMIUM 3.0 Team 🚀
ElDoradoFx – BTCUSD ANALYSIS (08/11/2025, ASIA SESSION)1. Market Overview
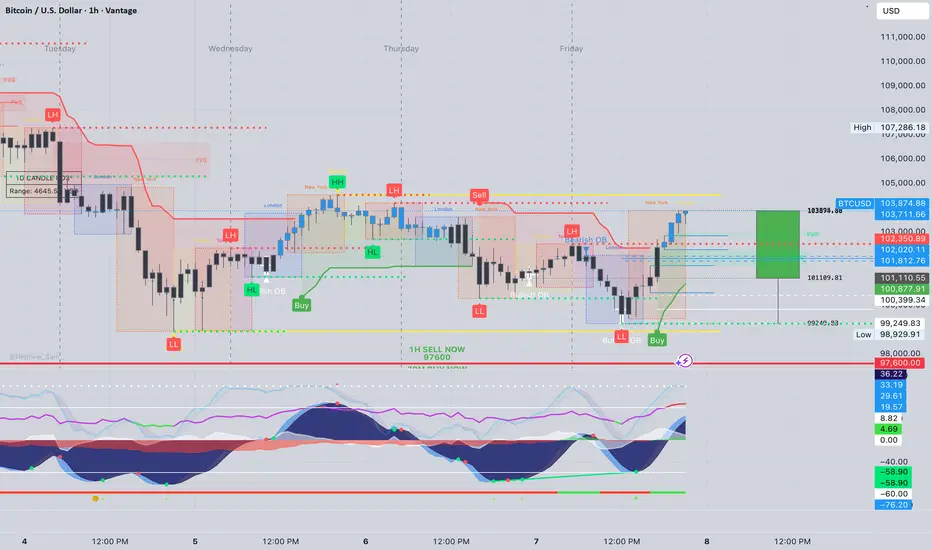
BTCUSD is trading around $103,800, posting a strong rebound from the $99,200 liquidity sweep earlier in the week. The bullish momentum is driven by the reclaim of short-term structure and EMA crossovers on intraday charts. While the recovery is technically healthy, BTC now approaches critical resistance between $104,800–$105,400, where rejection or liquidity grabs could occur before continuation.
⸻
2. Technical Breakdown
🔹 Daily (D1):
• The daily structure shows a bullish CHoCH from the 99K demand sweep.
• RSI has recovered from oversold (now 41.2), signaling early trend recovery.
• MACD histogram tightening — selling momentum fading.
• Price is still below the 100EMA (~108K), so overall macro bias remains neutral until 105K–108K is cleared.
🔹 H1:
• Clear BOS confirmed with a sequence of higher highs and higher lows.
• EMAs aligned bullish (20 > 50 > 200).
• RSI near 66, showing strong intraday bullish strength.
• MACD positive, confirming momentum favoring the upside.
🔹 15M–5M:
• Strong intraday trend channel formed with consistent BOS toward 103,800.
• RSI approaching 70 — minor exhaustion likely.
• Pullback to 102,200–101,900 expected before next impulsive wave.
⸻
3. Fibonacci Analysis (Last Swing: 99,249 → 103,895)
Level Price (USD) Note
38.2% 102,200 First retracement area
50.0% 101,570 Mid-zone equilibrium
61.8% 100,940 Strong support confluence
🎯 Golden Zone: 102,200 – 100,940 → Potential re-entry area for continuation buys.
⸻
4. High-Probability Trade Scenarios
📈 Bullish Continuation Setup (Main Bias)
• Entry Zone: 102,200 – 100,940 (Fibonacci Golden Zone)
• TPs: 103,800 → 104,800 → 105,400 → 106,000
• SL: Below 100,600
• Confirmation: Bullish engulfing candle or RSI bounce from 50–55
• Rationale: Break of structure + bullish EMA alignment + increasing volume.
💥 Breakout BUY Setup
• Trigger: 1H close above 104,000
• Retest Zone: 103,800–103,600
• TPs: 104,800 → 105,400 → 106,500
• SL: Below 103,200
📉 Bearish Countertrend Setup
• Entry Zone: 104,800 – 105,400 (Major resistance)
• TPs: 103,800 → 103,000 → 102,200
• SL: Above 105,600
• Confirmation: RSI divergence or bearish engulfing candle on H1/H4
• Rationale: Liquidity trap possible at 105K; short-term overextension.
⸻
5. Fundamental Watch
• Weekend sessions = low liquidity → prone to manipulation and stop hunts.
• DXY holding above 105, limiting BTC upside in the medium term.
• No major US macro data releases until early next week (CPI & PPI).
• Expect Asian session volatility spikes between 1 AM–5 AM UTC.
⸻
6. Key Technical Levels
Type Levels (USD)
Resistance 104,000 / 104,800 / 105,400 / 106,000
Support 103,000 / 102,200 / 100,940 / 99,200
Golden Zone 102,200 – 100,940
Break Buy Trigger > 104,000
Break Sell Trigger < 101,000
⸻
7. Analyst Summary
BTC shows a clean short-term bullish reversal from the 99K base, supported by strong momentum and structure recovery. However, traders should watch closely the 104,800–105,400 zone — a key liquidity cluster where potential profit-taking or rejection could occur.
Pullbacks into 102,200–100,940 remain ideal buy-the-dip zones, targeting 105K+ extension. A confirmed H1 close below 101K would invalidate this bullish bias and reintroduce downside risk.
⸻
8. Final Bias Summary
✅ Primary Bias: Bullish above 102K (Buy dips toward 102,200–100,940)
⚠️ Secondary Bias: Bearish only if rejection forms at 105,400 or break below 101K
⸻
🥇 ElDoradoFx PREMIUM 3.0 – PERFORMANCE 07/11/2025 🥇
📅 Precision. Profit. Live Execution.
━━━━━━━━━━━━━━━
🪙 XAU/USD (GOLD)
🔻 SELL +60 PIPS
🟢 BUY +40 PIPS
🟢 BUY +90 PIPS
❌ BUY -40 PIPS (SL)
🟢 BUY +120 PIPS
---
▶ LIVE TRADING SESSION RESULTS
💥 BUY +100 PIPS
💥 BUY +125 PIPS
💥 BUY +150 PIPS
🧠 Our live sessions continue to deliver consistent profits — traders learned in real-time how to identify clean entries, scale in safely, and secure profits like pros.
━━━━━━━━━━━━━━━
💰 TOTAL PIPS GAIN: +645 PIPS
📊 8 Trades → 7 Wins | 1 SL
🎯 Accuracy: 87%
━━━━━━━━━━━━━━━
🔥 Another powerful day for ElDoradoFx Premium 3.0 — combining analysis, education, and execution all in one live environment.
📈 If you’re not joining the live sessions yet, you’re missing real-time profitable setups every day.
👏 Congratulations if you profited! ✅✅✅🚀🚀🚀
— ElDoradoFx PREMIUM 3.0 Team 💼📊
BTCUSD – DAILY PROFESSIONAL ANALYSIS (04 NOV 2025)Prepared by: ElDoradoFx PREMIUM 3.0 Analyst Desk
⸻
🧭 1️⃣ Market Overview
Bitcoin has experienced a strong bearish continuation, breaking decisively below the key structural support at 108,200, confirming a shift in market sentiment. The break of structure (BOS) at 109,600 turned the mid-term bias bearish, with price now testing the psychological level at 100,000.
RSI is at 32 on the daily chart, showing near-oversold conditions, but momentum remains heavy to the downside. Unless bulls reclaim 101,000–102,000, sellers are likely to continue dominating toward 98,600–97,000.
⸻
📊 2️⃣ Technical Breakdown
🔻 Daily (D1)
• Price broke below the long-term ascending trendline from August.
• EMAs aligned for bearish continuation (20 < 50 < 200).
• RSI 32 → weak recovery potential but still room for downside liquidity sweep.
→ Interpretation: Bears fully in control until 102,000 is reclaimed.
🔻 1-Hour (H1)
• Descending channel intact; price rejected from supply zone 101,200–101,600.
• RSI hovering around 30–40; possible minor retracement before further drop.
• MACD still printing red histogram bars → bearish momentum active.
→ Interpretation: Look for short opportunities near resistance retests.
⚠️ 15M–5M (Intraday)
• Price formed a small double bottom near 99,550, showing temporary relief bounce.
• RSI rebounding, but no confirmation of reversal.
• EMA50 (H1) around 101,000 acting as dynamic resistance.
→ Interpretation: Possible short-term correction before continuation down.
⸻
📐 3️⃣ Fibonacci Analysis
Swing Range: 104,839 → 99,559
Level Price Observation
38.2% 101,455 Minor retracement zone
50.0% 102,200 Key confluence with EMA50
61.8% 102,950 Strong resistance zone for potential short re-entry
✅ Golden Zone: 101,455 – 102,950
This is the ideal sell re-entry area if price pulls back.
⸻
🎯 4️⃣ High-Probability Trade Scenarios
🔻 SELL SETUP (PRIMARY BIAS)
Scenario A – Golden Zone Retest
• Entry: 101,455–102,950 (Fibonacci + EMA confluence)
🎯 TP1 → 100,000 TP2 → 99,000 TP3 → 97,000
🛑 SL → Above 103,300
Scenario B – Continuation Breakout
• Trigger: Break & retest below 99,550
🎯 TP1 → 98,600 TP2 → 97,000 TP3 → 95,800
🛑 SL → Above 100,300
⸻
🟢 BUY SETUP (ALTERNATIVE SCENARIO)
Scenario A – Support Reversal Zone
• Entry: 99,550–98,600 (if strong bullish reaction with engulfing candles)
🎯 TP1 → 101,000 TP2 → 102,000 TP3 → 103,000
🛑 SL → Below 98,200
⸻
🕐 5️⃣ Fundamental Watch
• US yields rising and DXY strengthening above 105.2 → bearish pressure on BTC.
• Market sentiment risk-off due to global equity weakness.
• Watch upcoming US Unemployment & CPI data — could trigger volatility reversal.
⸻
⚙️ 6️⃣ Key Technical Levels
Type Levels
Resistance 101,455 / 102,200 / 102,950
Support 99,550 / 98,600 / 97,000
Golden Zone 101,455 – 102,950
Breakout Confirmation Below 99,550 or Above 103,000
⸻
🧾 7️⃣ Analyst Summary
BTC confirmed a bearish structure, with short-term retracements expected toward the Golden Zone (101,455–102,950) before further downside continuation. Momentum indicators still favor sellers, though oversold readings could create minor pullbacks. Until 103,000 is broken to the upside, bias remains bearish.
⸻
📈 8️⃣ Final Bias Summary
🔻 Bearish below 102,000 → Targets 99,000 / 97,000 / 95,800
🟢 Bullish only above 103,000 → Targets 104,800 / 106,000
⸻
— ElDoradoFx PREMIUM 3.0 Team 🚀

Today's Bitcoin Trading StrategyBitcoin triggers bearish warning: Technical pattern breaches + liquidation of long positions, aiming directly at the psychological threshold
The technical indicators are all bearish, and the rebound is weak.
Looking at the chart, it's clearly visible that all the short-term moving averages are above the price, forming a "bearish arrangement" - it's like multiple layers of ceilings pressing down, and the price simply doesn't have the strength to rise any further. Moreover, the 200-day moving average (107,846 USD) has now become a strong resistance level. The previous several rebounds failed to break through it, and now the price is moving further away from this average, making the rebound even more difficult. Additionally, from the historical trend, Bitcoin is currently trapped between the 200-day moving average and the 365-day moving average (100,367 USD). If this lower boundary of the range is broken, it is very likely to accelerate the decline.
The risk of liquidating long positions is emerging, which may trigger a chain reaction of declines.
There are still a large number of long positions bought in the range of 105,000 - 106,000 USD in the market. Now these positions are already in a loss state. If the price continues to fall below 103,000 USD, these long positions will be forcibly closed (that is, the long positions will be wiped out), and the selling pressure from the forced closure will further push down the price, forming a vicious cycle of "decline - liquidation - further decline". There have been precedents before, where after breaking through a key support level, 500 million USD of long positions were liquidated. This time, the risk is also not small.
Today's Bitcoin Trading Strategy
sell:104000-104500
tp:103000-103500
sl:105000
ElDoradoFx – BTCUSD WEEKEND ANALYSIS (02/11/2025, US SESSION)
🧭 1️⃣ Market Overview
Bitcoin retraced after testing the intraday resistance near 111,238, facing rejection at the upper boundary of the descending channel. Price remains supported above 110,000, respecting both the dynamic ascending trendline and 200 EMA on intraday charts. Momentum has cooled but the market still holds a mildly bullish structure unless 109,700 breaks. Volatility is expected to remain moderate heading into early-week sessions.
⸻
📊 2️⃣ Technical Breakdown
✅ Daily (D1)
• Structure: Rangebound between 108,300 and 111,800.
• EMAs: Price hovering between 50 and 200 EMA, equilibrium zone.
• RSI (47): Neutral – no divergence.
• MACD: Histogram flattening; momentum loss after prior bullish impulse.
→ Interpretation: Consolidation phase, waiting for directional breakout.
✅ 1-Hour (H1)
• Clean BOS from 109,600 led to impulsive rise to 111,200.
• Currently retracing toward the 50 EMA and trendline support.
• Key support: 110,100–109,900.
→ Interpretation: Market retesting support after profit-taking; potential bullish re-entry if structure holds.
✅ 15M–5M (Intraday)
• Price rejecting 111,238 and forming short-term lower highs.
• RSI rebounding from 35 – possible micro bullish correction.
• MACD showing first red bars, indicating short-term retracement nearing exhaustion.
→ Interpretation: Possible liquidity sweep around 110,000 before upward continuation.
⸻
📐 3️⃣ Fibonacci Analysis
Swing Range: 109,703 → 111,238
Level Price Observation
38.2% 110,671 Minor support zone
50.0% 110,470 Golden mid-level + EMA confluence
61.8% 110,268 Trendline & structural confluence
✅ Golden Zone: 110,671 – 110,268 (high-probability buy zone)
⸻
🎯 4️⃣ High-Probability Trade Scenarios
🟢 BUY SCENARIOS (Primary Bias)
Scenario A – Golden Zone Reversal (Ideal Setup)
• Entry Zone: 110,671 – 110,268
🎯 TP1 → 111,000 TP2 → 111,238 TP3 → 111,800
🛑 SL → Below 109,900
Scenario B – Breakout Continuation
• Trigger: Break & retest above 111,238
🎯 TP1 → 111,800 TP2 → 112,200 TP3 → 112,800
🛑 SL → Below 110,800
⸻
🔻 SELL SCENARIOS (Alternative)
Scenario A – Breakdown from Structure
• Trigger: Break & retest below 109,700
🎯 TP1 → 109,200 TP2 → 108,600 TP3 → 108,000
🛑 SL → Above 110,200
Scenario B – Rejection from 111,200–111,400 Zone
• Trigger: Bearish engulfing candle rejection.
🎯 TP1 → 110,600 TP2 → 110,000
🛑 SL → Above 111,500
⸻
🕐 5️⃣ Fundamental Watch
• Weekend volatility lower than average; price reactive to liquidity sweeps.
• DXY steady near 104.8 – neutral macro tone.
• ETF accumulation flows remain supportive for mid-term trend.
• Watch US macro data midweek (PMI & NFP) for volatility spikes.
⸻
⚙️ 6️⃣ Key Technical Levels
Type Levels
Resistance 111,238 / 111,800 / 112,200
Support 110,268 / 109,900 / 109,700
Golden Zone 110,671 – 110,268
Breakout Confirmation Above 111,238 or Below 109,700
⸻
🧾 7️⃣ Analyst Summary
BTC continues consolidating within a controlled retracement phase, currently resting in the Golden Zone (110,671–110,268) that aligns with the ascending trendline. Holding above this range favors bullish continuation, while a confirmed break below 109,700 would open downside space. Short-term trades favor long positions within the zone, targeting 111,200–111,800.
⸻
📈 8️⃣ Final Bias Summary
🟢 Bullish bias above 110,200 → Targets 111,200 / 111,800
🔻 Bearish bias below 109,700 → Targets 108,800 / 108,000
⸻

BTC/USD – Bullish Channel Breakout and Retest Buy SetupChart Overview
Trend: The chart shows BTC moving within a descending channel (highlighted in blue).
Current Price: Around $106,534
Setup Type: Possible bullish reversal setup from the lower channel boundary.
🧩 Technical Breakdown
1. Pattern
BTC is currently testing the upper boundary of a falling channel.
Price has attempted to break out upward, suggesting early bullish momentum.
A retest zone (blue rectangle) is drawn between $104,690 – $103,033, indicating a potential buy zone.
2. Entry Zone
Entry Point: $104,690
This is around the retest of broken channel resistance, now turned support.
Price may dip into this zone before bouncing upward.
3. Stop Loss
Stop Loss: $103,033
Below the blue zone — protects from deeper continuation of the downtrend.
4. Target Point
Target Zone: $108,979 – $109,043
This is near the previous swing high and serves as a short-term bullish target.
5. Risk-to-Reward Ratio
Entry: $104,690
Stop Loss: $103,033 → Risk ≈ $1,657
Target: $109,043 → Reward ≈ $4,353
Risk/Reward ≈ 1:2.6, which is favorable for a long setup.
📈 Possible Market Scenario
BTC may retest the breakout area near $104.6K.
If it holds support, a bullish move toward $109K is expected.
A break below $103K invalidates the setup, resuming bearish pressure.
💡 Summary
Signal Direction Entry Stop Loss Target Risk/Reward
BUY Setup Bullish $104,690 $103,033 $109,043 1:2.6
⚠️ Note
Wait for confirmation (bullish candle or retest bounce) before entering.
Use tight position sizing to manage risk, especially since BTC remains volatile.

WHO WRE EXPECTING THAT BITCOIN WILL MOVE UP 118K...?Chart Overview
The chart shows Bitcoin trading between a strong support zone near $108,000–$112,000 and a resistance zone around $122,000–$123,000. After a sharp decline (“Falling Down”), BTC rebounded with a clear “Bullish Back” movement before facing resistance again.
Key Observations
1. Support Zone (108K–112K USD):
BTC has tested this zone multiple times, confirming strong buyer interest.
The recent bounce suggests accumulation pressure is building.
2. Resistance Zone (122K–123K USD):
Price faced rejection from this level previously.
A break and close above this resistance would confirm a bullish continuation pattern.
3. Pattern Formation:
A potential rounded bottom / cup shape appears to be forming, indicating bullish reversal potential.
The “eye” and “arrow” symbol in the chart highlight market observation before a possible breakout attempt.
4. Short-Term Outlook:
Expect sideways consolidation between 112K–118K USD before a possible bullish leg higher.
The next target levels on breakout: 120K, then 122.5K.
Support retest below 112K could delay recovery.
Bullish Scenario
Price holds above 115K and pushes past 118K, signaling momentum for a breakout.
Confirmation above 122.5K could open room toward 125K–128K.

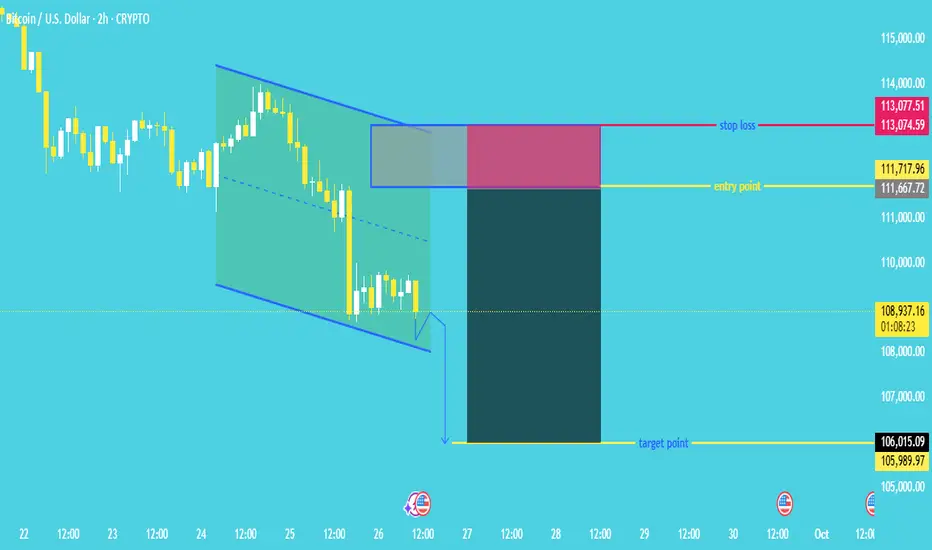
"Bitcoin Bearish Continuation Pattern: Short Entry on Retest"Chart Pattern
The price is moving within a descending channel (highlighted in blue and green), which typically signals continuation of the current downtrend.
A breakout to the downside of the channel seems to be forming (small breakout candle drawn outside the channel).
🔽 Trade Setup: Short Position
This is a short trade setup, meaning the trader expects the price to go down.
🔸 Entry Point
Entry Zone: Between 111,667.72 and 111,717.96 USD
This is above the current price, suggesting a pullback entry (waiting for a slight retracement before shorting).
🔹 Stop Loss
Stop Loss Zone: Between 113,074.59 and 113,077.51 USD
Placed above the channel and the entry point to protect against invalidation.
🟢 Target Point (Take Profit)
Target Zone: Between 105,989.97 and 106,015.09 USD
The expected price move is based on a measured move or projected breakdown from the channel.
🧮 Risk to Reward Ratio
The risk/reward box (red for risk, green for reward) shows a positive risk-reward ratio, likely around 1:2 or better, which is favorable in trading.
✅ Analysis Summary
Trend: Bearish (descending channel, lower highs and lower lows).
Setup: Short position on pullback into resistance zone.
Target: 106,000 area.
Stop: 113,000 area.
Current Price: Around 108,905.09 USD.
📌 Final Thoughts
The setup assumes the breakdown from the channel is valid.
A retest of the breakdown zone (entry point) is anticipated before continuation downward.
Be mindful of potential false breakouts or sudden bullish reversals.
BTC/USD Supply Zone Rejection – Short Setup Towards 111,450Pair & Timeframe
BTC/USD on the 1-hour chart.
The chart is showing intraday to short-term trading levels.
2. Current Market Structure
Price has been moving in a downward channel (bearish trend).
Multiple lower highs and lower lows confirm the downtrend.
Recently, price broke a bit above the channel but got rejected in the supply zone.
3. Supply Zone
Marked between 115,318 – 116,118 USD.
This is an area where sellers are expected to step in (previous breakdown zone).
Price reacted from this zone and is showing bearish continuation.
4. Trade Setup
Entry Point: ~115,337 USD
Stop Loss: 116,118 USD (just above supply zone to protect against false breakout)
Target Point: 111,468 USD
This gives:
Risk (SL – Entry) ≈ 781 USD
Reward (Entry – Target) ≈ 3,869 USD
Risk-to-Reward Ratio (RRR) ≈ 1:5, which is very favorable.
5. Current Price Action
BTC currently trading around 114,614 USD (below entry).
If price retests supply zone again but fails to break above, bearish continuation is likely.
If BTC breaks and closes above 116,118 USD, this short setup becomes invalid.
6. Outlook
Bearish bias as long as BTC stays under 116,118 USD.
High probability move toward 111,450 – 111,468 USD support zone.
If price holds above 116,118 USD, it could flip bullish and retest 117k+ levels.
✅ Summary:
This is a short setup based on supply zone rejection within a broader downtrend. The risk-to-reward is excellent (1:5), but watch for a false breakout above 116,118 USD.

BTC/USD Bullish Order Block Setup – Targeting 114,328BTC/USD (1H) Analysis
Trend & Structure: Price has been respecting a rising channel with clear support and rejection lines. After testing the support line, it rebounded and is now consolidating.
EMA Strategy: Price is fluctuating around the 70 EMA (111,081) and 200 EMA (110,902), showing short-term consolidation. A bullish crossover above 70 EMA may confirm further upside momentum.
Order Block (OB) Zone: The marked OB Buying Zone (109,261 – 110,252) is a strong demand area where buyers are expected to step in.
Support & Resistance: Support lies at 109,261, while the next resistance/target is 114,328.
Risk-Reward Strategy: A potential long entry from the OB zone offers a favorable R:R ratio toward the 114,328 target point. Stop loss ideally below 109,246.
Price Action: Recent wicks suggest rejection of lower levels, strengthening the bullish bias.
✅ Signal: Buy from OB Buying Zone (109,261 – 110,252)
🎯 Target: 114,328
🛑 Stop Loss: Below 109,246
Overall Bias: Bullish continuation if price respects the OB buying zone and EMA support.

BTC/USD – FVG Buy Zone Setup Targeting $113KChart Overview (BTC/USD 30m)
Price is currently trading at $110,517.
EMA 70 (111,276) above price → short-term bearish.
EMA 200 (110,598) acting as immediate support zone.
📐 Trend & Channel Strategy
Market is moving inside an ascending channel (support & projection line).
Price recently retraced to the support line → potential bullish continuation.
🎯 Supply & Demand / FVG Strategy
FVG Buying Zone: $109,583 – $110,217 highlighted (strong demand zone).
Entry around this zone expected to trigger a bullish reaction.
📊 EMA Crossover Strategy
EMA70 > EMA200 previously → bullish structure.
Current retest of EMA200 is key → holding above signals continuation to upside.
💎 Price Action Strategy
After strong drop, price tapped into support + FVG zone.
Wick rejection suggests buyers stepping in.
🎯 Target & Risk Management
Target Point: $113,053 – $113,064.
Stop Loss: Below $109,583 (to protect against breakdown).
Risk/Reward ratio looks favorable (approx. 1:3).
✅ Conclusion:
BTC is in an uptrend channel. After retesting the FVG buying zone & EMA200, buyers are likely to push price back toward $113,000 target 🚀📈. A break below $109,583 would invalidate this bullish setup.

BTC/USD Bearish Retest Setup – Eye on 106.6K TargetTrend: BTC is in a downtrend channel (rejection line above, support line below).
EMA Signals: Price is trading below EMA 70 & EMA 200 → bearish bias remains strong.
Supply & Demand:
Support zone: around 112,000 – 112,500 (price just bounced).
RBR Supply zone: 114,300 – 116,000 where sellers are likely waiting.
📊 Strategies in play
Support–Resistance: Bounce at support, retest expected at supply zone.
EMA Strategy: Bearish since candles trade under 200 EMA.
Break & Retest: Price could retest supply before resuming drop.
Target Projection: If rejection at supply holds, target = 106,600 zone (chart target point).
⚖️ Risks
A clean break above 116,000 would invalidate bearish setup and open room for reversal.
Range trading possible between 112k–116k before breakout.
✅ Summary: BTC short-term bias remains bearish. Expect retest of 114.3k–116k supply before continuation lower toward 106.6k target. Only a strong breakout above 116k flips the trend bullish.

BTC/USD Bullish Breakout Toward 124K🔎 Chart Analysis
1. Support & Resistance Zones
Support Zone: Around 113,600 – 115,000, holding price from further downside.
Resistance Zone: Around 116,000, where price faced rejection previously.
2. Trend Structure
The price has broken out of the descending channel (rejection line & support line).
This breakout suggests a bullish reversal signal.
3. Moving Averages (EMA)
EMA 70 (~115,080) and EMA 200 (~116,182) are converging.
If the price sustains above EMA 200, it will confirm a bullish continuation.
4. Candlestick Price Action
Recent bullish engulfing from support zone strengthens the case for upward momentum.
Consolidation near resistance indicates accumulation before a breakout.
5. Target Projection
If breakout above resistance is successful, target lies around 124,449 – 124,484 (next major resistance level).
📌 Trading Plan (Example)
Entry: Around 115,260 – 115,600 (after confirmation above EMA 200).
Stop Loss: Below 113,600 (support zone).
Target: 124,449 – 124,484.
⚡ Summary
Bitcoin is showing signs of a bullish breakout from a descending channel. If price sustains above the resistance and EMA 200, a strong move toward 124K is likely. The support at 113,600 remains a critical invalidation level.

BTC SHORT SETUP INTRADAY ( 02 AUG 2025 )If you have doubt on our trades you can test in demo.
Details:
Entry: 113,680 $ - 113,450 $
Target Price: 112,300 $
Stop loss: 114,370 $
Trade Ideas:
Idea is clearly shown on chart + we have some secret psychologies and tools behind this.
What is required to Join VIP?
- Nothing just you have to share 10% of your profit with us at the end of the month which you earned from our signals. Yeah this is just the requirement, trade where ever you like your favorite broker or else you don't need to pay fees first or create account thru our link.
Trade Signal:
I provide trade signals here so follow my account and you can check my previous analysis regarding BITCOIN. So don't miss trade opportunity so follow must.
BINANCE:BTCUSDT BINANCE:BTCUSDT.P BINANCE:BTCUSD

BTC HUGE DROP TO 113,400$ - BIG CRASH !*Sorry for posting to late as I am between a trip in Malaysia.*
Details:
Entry: Now - 117,000 $
Target Price: 113,410 $
Stop loss: 119,460 $
Trade Ideas:
Market creating a flag pattern here. Though its not only the logic we have some secret logics here and indicators which I shared in the VIP.
What is required to Join VIP?
- Nothing just you have to share 10% of your profit with us at the end of the month which you earned from our signals. Yeah this is just the requirement, trade where ever you like your favorite broker or else you don't need to pay fees first or create account thru our link.
Trade Signal:
I provide trade signals here so follow my account and you can check my previous analysis regarding BITCOIN. So don't miss trade opportunity so follow must.
BINANCE:BTCUSDT BINANCE:BTCUSDT.P BINANCE:BTCUSD

Bitcoin (BTC/USD) 1H Chart Analysis – Double Top Signals BearishPattern Formed: DOUBLE TOP
⚠️ Bearish Reversal Pattern Spotted!
📍 Formed near 111,794.8
⬆️ Price tested the top twice and failed – strong resistance confirmed!
Key Zones:
🔶 SUPPLY ZONE (Resistance):
🟧 111,794.8 - 111,829.8
🔼 Expect selling pressure here!
🔷 SUPPORT Zone (Broken!):
🔻 Price fell below this level, confirming a bearish breakout
🟩 TARGET ZONE:
🎯 102,500.0
✅ This is the likely drop target based on the pattern
🧊 Other minor supports:
* 102,820.6
* 102,750.8
* 102,227.0.
Indicators:
📈 Trend Line
* Supported the price during the uptrend
* ❌ Now broken — indicates momentum shift
📉 EMA 70 (Red Line)
* Current Price (108,238.6) is below EMA 70 = 109,245.0
* Indicates bearish pressure.
Trade Setup:
🔽 Short Entry Idea: After support break
🛑 Stop Loss: 111,829.8
🎯 Take Profit: 102,500.0
⚖️ Risk-Reward looks attractive!
Summary:
📉 Bearish bias confirmed by:
* Double Top pattern
* Supply zone rejection
* Support break
* EMA crossover
🚨 Traders Watch Out: Bears are in control — next major stop likely at 102,500.0!

Bitcoin Short Setup –Supply Zone Rejection Trade Plan (1H Chart)(BTC/USD – Technical Setup)
🔵 Trend Setup:
⬆️ Resistance Line – Price is struggling to break above this level.
⬇️ Support Line – Price bounced several times here before breaking down.
🟢 EMA 70 – Currently around 104,435.9, acting as dynamic support/resistance.
📍 Key Levels:
🔴 Stop Loss Zone:
107,488.4 to 107,402.4
(🚨 Strong resistance, limit losses!)
🟡 Entry Point:
106,026.8
(🟨 Inside the Supply Zone – Ideal for Sell)
🟦 Supply Zone:
106,026.8 to 107,402.4
(⚠️ High selling pressure expected here!)
🔵 Break of Structure (BOS):
Price broke below the rising support line
(📉 Bearish confirmation!)
🎯 Target Point:
99,000.0
(💰 Take Profit Target!)
🔻 Trade Idea:
SELL at 106,026.8
🛑 Stop Loss: 107,488.4
✅ Target: 99,000.0
Risk-Reward looks solid.
This is a short setup expecting a drop after a retest of the supply zone.

Bitcoin 4H Technical Analysis– Bullish Continuation Toward $111KCurrent Price Context:
BTC/USD: $103,696.63
EMA (70): $96,211.07
Trend: Bullish 📈
---
Key Zones & Analysis:
1. RBR Zone (Demand Zone) 💙
Price Range: $95,435.39 – $97,986.81
This area is a bullish support zone where price previously consolidated before the breakout.
Potential entry/buy zone 📍
If price pulls back: Bounce expected here 🔁
🟦 RBR Zone:
🔵 97,986.81
🔵 96,211.07 (EMA support)
🔵 95,435.39
---
2. Resistance / Short-Term Supply 🟥
Small blue box above current price
May cause a minor rejection before a breakout
Keep an eye out for price action signals here 👀
🟥 Resistance:
🟥 ~103,700 – 105,000
---
3. Target Zone 🎯
Main Target Point: $111,415.32
Target Range: $111,281.04 – $112,959.60
If price breaks above resistance, this is the next major target
Take profit zone 💰
🎯 Target Area:
🔵 111,281.04
🔵 111,415.32
🔵 112,959.60
---
Possible Price Path:
1. 🔼 Break above current resistance
2. 🔁 Or pull back to RBR zone
3. 🎯 Final move toward target zone

Do you think this could happen to Bitcoin?
Do you guys think we could enter a long position in the area I have outlined with confirmations appearing, especially on the lower timeframes?
The best course of action is to just watch the market for now and see what happens to Bitcoin in the range outlined over the coming days?
What do you think, buddy?

BTC Bounce from $58,000: Heading Towards ?I've been closely tracking Bitcoin's price action, and my latest analysis suggests that we may be witnessing a significant bounce from the $58,000 level, a strong support zone. After a recent dip, BTC is currently trading at $65,655, and based on key technical indicators, I expect it to rally toward $74,000 with a couple weeks.
however It's only a matter of price breaking above the 67000k resistance level as shown on chart. So this is a key level to watch
Key factors driving this prediction:
Support at $58,000:
This level has historically acted as a strong floor for Bitcoin, with previous bounces leading to upward moves to retest 63k +- 1000points resistance range.
Volume and Momentum:
Increasing trading volume and momentum indicators are pointing to a potential upward continuation.
Moving Averages:
BTC is currently holding above key moving averages, reinforcing the possibility of bullish momentum.
Market Sentiment:
With recent developments in the fundamental space, sentiment is leaning bullish, adding further conviction to the potential for this move.
If this analysis plays out, we could see BTC pushing through resistance levels and reaching $74,000 in a couple weeks time frame ideally. Keep an eye on these key levels as the price action unfolds.
MCG
