Selling pressure on BTC - 2026Bitcoin (BTC/USD) – End-of-Year Outlook (D1)
As we move toward the end of the year, Bitcoin is showing a clear shift from uptrend to corrective / bearish structure on the daily timeframe.
1. Market Structure
BTC has broken below the rising channel and failed to reclaim it, confirming a loss of bullish control.
Price is now trading below EMA 34 and EMA 89, while EMA 200 remains far above — a classic sign of a medium-term downtrend.
2. Key Resistance Zone
The 95,000–96,000 area (purple zone) is a strong supply / sell zone, aligned with:
Previous support turned resistance
EMA confluence
Any pullback into this zone is likely to attract sellers rather than buyers.
3. Support & Downside Scenarios
First downside target: ~76,700
This is a major demand zone and the 1.618 Fibonacci extension.
If this level breaks:
Price could extend further toward 52,000–53,000, which is a long-term demand area and strong historical support.
4. Year-End Expectation
Without a strong reclaim above 96,000, BTC is more likely to:
Continue sideways to bearish movement, or
Form a bearish pullback before another leg down
Btcusdsell

BTCUSD: Anticipating a Strategic Sell OpportunityRecent economic indicators present a challenging landscape for risk assets, with disappointing U.S. employment figures underscoring labor market fragility and cooling inflationary pressures signaling a potential shift in monetary policy expectations. Major U.S. equity indices, such as the Dow Jones Industrial Average (US30) and Nasdaq-100 (NDX), are exhibiting technical patterns suggestive of near-term exhaustion, hinting at a broader market correction. Against this backdrop, Bitcoin (BTC/USD) appears poised for a period of weakness.
From a technical perspective, BTC/USD is approaching a critical juncture. The pair is testing a key ascending resistance trendline (highlighted in orange), which has historically acted as a formidable barrier. A retracement toward this dynamic resistance zone is anticipated, presenting a high-probability selling opportunity. Given that this setup does not align with a classic A-Book liquidity profile, trading volumes may remain subdued, suggesting a less aggressive approach to position sizing.
Traders are advised to monitor price action closely for confirmation of a pullback, with a focus on confluence between the ascending resistance and other technical indicators, such as momentum divergences or elevated selling pressure, to optimize entry timing. Risk management remains paramount in navigating this potentially volatile environment.

BTC Trade Set Up Dec 16 2025I am expecting a continuation of the bearish trend especially if price respects this 4h FVG. The target is demand and lower SSL

BTCUSD’s Weak ReboundToday, the BTCUSD pair exhibited a volatile and weak trend characterized by a decline followed by a pullback. After a sharp drop in the early trading session, it staged a slight rebound but still failed to break free from the recent downward trend overall. Bulls and bears engaged in fierce rivalry around key price levels, which was driven by multiple factors including expectations for macroeconomic policies, institutional attitudes and market sentiment.
Resistance Levels
The key short - term resistance stands at $90,400, a level that corresponds to the CME futures gap formed over the weekend. It exerts a strong magnetic pull on the price and serves as a crucial juncture determining whether the rebound can gain further momentum. The $90,500 level, where multiple moving averages converge on the 4 - hour chart, also acts as a resistance level. If this level can be breached, the pair will subsequently face a strong resistance zone between $92,000 and $94,000. Only a volume - backed breakout of this zone will enable Bitcoin to be expected to regain upward momentum.
Support Levels
The current core support zone ranges from $88,000 to $89,000. If this zone is lost, the price may further decline to the key Fibonacci Retracement level of $85,569, or even lower regions, and the subsequent trend will weaken further.
Trading Strategy:
Sell 91500 - 92000
SL 92500
TP 90000 -89000- 88000
Buy 88000 - 89000
SL 875000
TP 91000 - 91500 - 92000

Why is it a good time to consider short selling now?Macro policies suppress risky assets: Previously, the market had some expectations for the Fed's December interest rate cut, but officials such as the president of the Boston Federal Reserve, Collins, made hawkish remarks, explicitly opposing the continuation of the rate cut in December, reducing the probability of a rate cut to only 40%. The cooling of the expectation for rate cuts pushed the US dollar to strengthen, while Bitcoin, as a typical risky asset, lost its appeal significantly under the backdrop of a strong US dollar, and lacked macro policy support for its price increase, providing a basis for short selling.
Market enthusiasm has significantly cooled down: The institutional funds that previously drove the rise of Bitcoin are now withdrawing, and related funds have been flowing out of the market for several consecutive days, with a cumulative amount of 3.79 billion US dollars. Moreover, market trading volume is also decreasing, and the trading activity on major exchanges is not as active as before, indicating a decline in the enthusiasm of participants and a lack of momentum for the rise.
Policy risks persist: The regulatory rules for Bitcoin have been delayed for a long time, and related bills have been in deadlock in the parliament, and there is no clear direction in sight in the short term. This has made many large institutions reluctant to enter the market, resulting in a lack of market confidence. Meanwhile, although there are rumors of a rate cut by the Fed, officials have repeatedly stated that "it is not a certainty", this uncertainty makes high-risk assets like Bitcoin prone to decline.
Bitcoin trading strategy
sell:88000-89000
tp:87000-85000
sl:90000

Weekly BTCUSD Trend SummaryThis week, BTCUSD launched a strong rebound following a previous sharp decline, but later pulled back after hitting resistance, presenting an overall oscillatory recovery pattern characterized by "rebound – rally – pullback."
1. Early-Week Oversold Rebound with Intense Long-Short Dynamics (November 24)
At the start of the week, BTCUSD extended its oversold rebound after touching a 7-month low of $80,600 the prior week. Prices briefly broke above $88,000 in the morning, with an intraday peak gain of 3.85%; however, the market pulled back in the afternoon, slipping below $86,000 to turn slightly negative.
2. Mid-Week Oscillatory Uptrend as Bearish Momentum Faded (November 25 – 26)
November 25: Prices traded around $88,000, approaching the key resistance level of $90,000, forming a three-day consecutive rebound on the daily chart.
November 26: A bullish rally emerged in the evening, with prices surging approximately 5,000 points to successfully break through the $90,000 mark. However, the rally lacked subsequent volume support, preventing prices from extending further into higher ranges and laying the groundwork for a subsequent pullback.
3. Late-Week Rally Followed by Pullback, Halted at Key Resistance (November 29 – 30)
In the latter half of the week, the market experienced a turning point. On the morning of November 29 (Friday), prices touched a weekly high of $93,092 but immediately pulled back. Subsequently, prices retreated to around $90,000 to seek support, testing the validity of the $90,000 – $91,000 support range. From a market analysis perspective, the area around $93,000 represents the high of a consolidation range following multiple previous pullbacks, featuring strong resistance.
Overall Outlook & Key Drivers
Overall, BTCUSD staged a significant rebound from recent lows this week, but the lack of sufficient volume during the rebound was a prominent issue. Going forward, focus should be on whether prices can hold above the $90,000 support level—if broken, a further pullback may ensue. Conversely, if BTCUSD can regroup and break through the key level of $93,500, it may attempt to challenge the two-month downtrend line around $96,000.

BTC: Bullish Trend, 900000 Breakout AheadFollowing Black Friday’s plunge, BTC’s uptrend is now confirmed—holding firmly above 85000 and awaiting a direct breakout above 90000
Buy 86500 - 87500
TP 88500 - 89000
Accurate signals updated daily. They serve as a reliable guide for trading issues – feel free to refer to them. Hope they help!

The bearish trend of Bitcoin is unlikely to be reversedShort-term: Multiple negative factors converge, and the downward trend is difficult to reverse
Macro liquidity continues to tighten: This is the core driver behind the current decline in Bitcoin. The core inflation rate in the United States in October still reached 2.8%, far exceeding the Fed's 2% target, and the strong non-farm data led Fed Chair Powell to clearly state that interest rates would remain high for a long time. The probability expectation for a December interest rate cut has dropped to 44.4%. In a high-interest-rate environment, Bitcoin, as a non-yielding high-risk asset, loses its appeal sharply, and funds are flowing to stable-yielding US Treasury bonds (with interest rates reaching 5%). Market liquidity is being continuously drained.
Institutional and large-scale whales' concentrated selling: Institutional funds were previously the key force supporting the rise of Bitcoin, but now they have become the main force of the sell-off. The 12 US Bitcoin ETFs have cumulatively withdrawn 3 billion US dollars in the past 5 days, and the BlackRock-backed IBIT ETF even set a record for the largest single-day redemption since its establishment. At the same time, large whales holding over 1000 Bitcoin have sold 800,000 coins in the past month, large-scale sell orders directly broke through the key support level, triggering chain stop-losses in program trading, and further amplifying the decline.
High leverage intensifies market panic: The current leverage ratio in the crypto market is as high as 18%, and 20 times leverage trading is relatively common. A small price decline will trigger the bankruptcy of a large number of long positions, and the automatic selling behavior during bankruptcy will further push the price down, forming a vicious cycle of "downward - liquidation - further downward". On November 22, 400,000 people went bankrupt, with 1.9 billion US dollars of principal evaporated. Under the influence of panic, it is difficult for short-term funds to dare to enter the market to support at a large scale.
Bitcoin trading strategy
sell:87000-88000
tp:86000-84000-82000
sl:89000

Tightening liquidity suppresses risky assets. Negative policy factors: Fed Chair Powell clearly stated that "interest rates will remain high for a longer period", causing expectations of rate cuts to plummet; the core PCE inflation rate in the US is above the 2% target, completely dashing expectations of loose liquidity.
Cross-market correlation: The 30-day correlation between Bitcoin and the Nasdaq is 0.78. U.S. technology stocks are under pressure and falling, and high-risk assets are collectively being sold off, further spreading to the cryptocurrency market.
Bitcoin trading strategy
sell:94000-93000
tp:92000-91000-90000
sl:95000

Avoid chasing long positionsBTC has broken below the key level of 90000 today, with the downtrend becoming clear.
If the support around 87500 is broken, it may continue to decline
Accurate signals updated daily. They serve as a reliable guide for trading issues – feel free to refer to them. Hope they help!

Weak Recovery for BTCUSDBTC showed a trend of weak oscillatory recovery after hitting a low today. The price found support after breaking below the critical level of 90,000; however, the market remained in an extreme state of panic, which restricted the overall strength of the rebound.
From a technical perspective, the 85,000 - 90,000 range serves as a strong support zone, corresponding to the Fibonacci 0.618 retracement level. The price has demonstrated support near 89,000 today. On the flip side, the key resistance is concentrated in the 93,500 - 94,200 range. A breakout above this range may lead the price to test 95,000 subsequently, and if it can breach 95,000, it is expected to further move towards and challenge the 96,000 - 96,700 range.
Sell 93,500 - 94,000
SL 94,500
TP 92,000 - 91,500 - 91,000
Buy 89,500 - 90,000
SL 88,500
TP 92,500 - 93,000 - 93,500

BTC Short-Term Weakness PersistsBTC continued to decline last week, not only breaking below key support levels but also erasing all its year-to-date gains. Affected by multiple factors including capital outflows, macroeconomic conditions and technical trends, the short-term market remains in a bear-dominated weak pattern.
Today, Bitcoin opened near the bottom and staged a slight rebound, but the technical picture still shows a clear bearish dominance with downward momentum not yet fully exhausted. The previous key support level of 94,000 has been breached, and the next support lies around 92,800. If this level is broken, the price may fall further. On the upside, short-term resistance is concentrated in the 98,000-100,000 range, and a breakthrough in the short term is highly challenging.
Sell 96,000 - 97,000
SL 98,000
TP 94,000 - 94,500
Buy 92,800 - 93,500
SL 92,000
TP 94,500 - 95,000

BTC Extends Weak Volatile DeclineBTC witnessed a slight decline with certain price fluctuations today, continuing its recent correction trend. This price drop is a continuation of the ongoing downward trajectory.
Bitcoin had already recorded a significant fall on November 14th. Prior to that, Bitcoin ETFs saw a massive net outflow of approximately 870 million US dollars on November 13th, marking the second-largest single-day withdrawal since the launch of such funds.
Coupled with the market's reevaluation of expectations for the Federal Reserve's interest rate cuts, this has exerted sustained pressure on high-risk assets like Bitcoin, consequently leading to the continuation of the correction trend for Bitcoin's price today.
Today, BTC maintained a weak volatile downward pattern. In the short term, it is constrained by factors such as ETF capital outflows and adjustments to macroeconomic expectations. For the subsequent trend, close attention should be paid to the stability of the support level around 94,000, as well as the shifts in institutional capital flows and marginal changes in macro market sentiment.

BTCUSD: Sharp DropBTCUSD showed a sharp decline today, breaking below the key psychological level of 100,000, with violent intraday volatility. Both technical and capital flows indicate a bearish bias. After opening, the price did not continue the previous consolidation trend; although there were brief signs of stabilization in the morning, it subsequently entered a downward trajectory.
The 100,000 level had been a crucial psychological support for the market. After breaking below this level today, the price further dropped to 95,853 and failed to rebound quickly to reclaim the lost ground. Combined with the 4-hour technical structure where BTC has been in a descending channel, the persistent downward pressure from the 20-period and 60-period moving averages remains unresolved. Following this breach of key support, there may be further downside pressure ahead.
Going forward, focus on the support strength around 95,000. A breakdown below this level could trigger a new round of selling; if it stabilizes here, a short-term technical rebound may occur, but the overall weak pattern is unlikely to reverse easily in the near term.
Trading Strategy:
Buy 95,000 - 95,500
SL 94,500
TP 98,000 - 99,000 - 100,000
Sell 99,500 - 100,000
SL 100,500
TP 98,000 - 97,000 - 96,000

BTCUSD: Narrow-range consolidationToday, BTCUSD overall showed a trend of bottoming out with a slight rebound followed by a narrow-range consolidation, with price movements being volatile and fluctuating. In the morning, prices remained under pressure, fluctuating below 103,500, then rebounded quickly, but the upward momentum was weak, encountering obvious resistance below 105,500.
The short-term resistance above focuses around 106,000. Only a breakthrough of this level accompanied by increased trading volume can confirm a short-term reversal signal. Further resistance can be watched at 108,000; a firm hold above this level would give bulls the opportunity for a sustained rebound.
For support below, close attention should be paid to 102,000. If this support level is breached, prices may further test 99,800. As a key psychological and technical support level, a break below 100,000 could trigger more stop-loss orders, exacerbating downward pressure.
Currently, BTC's short-term trend is relatively weak but supported, and it is likely to consolidate in the 102,000 - 105,500 range.
In terms of operation, it is recommended to adopt a strategy of buying low and selling high with quick entries and exits. Do not blindly chase the upward trend; instead, patiently wait for prices to break through key ranges with increased volume and for the trend to clarify before adjusting positions to reduce trading risks.
Trading Strategy:
Buy 103,000 - 103,500
SL 102,500
TP 104,500 - 105,000 - 105,500
Sell 105,500 - 106,000
SL 106,500
TP 104,500 - 104,000 - 103,500

BTCUSD: Overall trend is moving downwardLooking at the candlestick chart, Bitcoin has formed a potential M-top or double top pattern, which is a typical top reversal signal. Currently, the price has broken below all short-term moving averages, indicating obvious weakness.
Yesterday, it is consistent with my analysis. BTC broke below the short-term support at 102,000, fell to around 100,000 where it found support and rebounded. However, this also showed an overall downward shift in the trend, with yesterday’s short-term support at 102,000 having turned into today’s resistance.
Overall, I predict that Bitcoin will continue its overall downward trend today. The short-term support is at 100,000, and a break below this level would target 98,000.
For resistance above, we still focus on 105,000 in the short term, with key attention on 108,000. Only a breakthrough and a firm hold above 108,000 could lead to sustained gains.
Buy 100,000 - 100,500
SL 99,000
TP 102,000 - 102,500 - 103,000
Sell 103,500 - 104,000
SL 104,500
TP 102,000 - 101,500 - 101,000

BTC continues to correct below 100k🟠 BTCUSD Technical Plan
Current Price: 101,960
Overview: BTC continues to follow a downtrend structure, with each lower high being rejected from the descending trendline (marked with red arrows). The market recently broke below key Fibonacci support and is now trading around the 1.0 extension level near 100,950.
📉 Short-term Expectation:
Price may retest the broken support zone around 104,700 – 105,800 (Fib 0.5–0.618 + EMA zone).
This area is expected to act as strong resistance where sellers may re-enter the market.
If the rejection is confirmed, BTC could continue dropping toward the 95,200 – 94,700 support zone (1.618 extension).
📈 Alternative Scenario (Bullish Correction): If price breaks above 105,800, a short-term correction could extend toward the trendline resistance near 111,400 before another potential reversal.

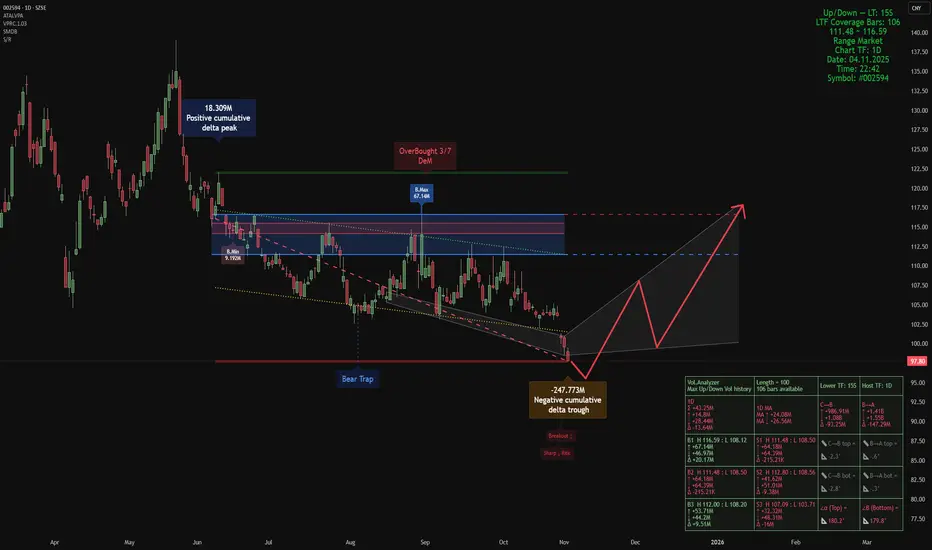
Smart Money Composite View — BYD Company Limited Class ASmart Money Composite View — #002594 (1D), BYD Company Limited Class A
Indicators used:
• Smart Money Support/Resistance
• Smart Money Dynamics Blocks (Pearson Matrix)
• ATAI •Volume Pressure Analyzer v1.2 — Pure Up/Down (Editorial Pick)
We fuse these three into a single composite read. With offset = 48, the setup highlights where price sits relative to smart-money demand/supply, how liquidity is being absorbed, and where momentum can re-emerge.
Market read (composite)
• Price is trading below the 112–118 supply block, which currently acts as the dominant resistance. The failed attempts into this band and the overhead “OverBought” tag mark it as the active sell wall.
• The current swing printed a large negative cumulative delta trough (~-247.8M) right at the lower reaction zone (bear-trap baseline + descending structure). That’s classic absorption of aggressive selling rather than fresh distribution.
• Wing geometry is near-flat (α≈180° / β≈179.8°), signalling compression: momentum has bled off while liquidity rotates. This is typically the pause before a directional decision.
• The grey path on the chart sketches the logical reaction sequence: a relief leg first into the mid-band (~108), where supply should be re-tested, and—only if absorption continues—an extension toward 112–118. Until price reclaims and holds above ~108, the structure remains a redistribution risk under that supply.
Invalidation: A decisive close below the recent trough low (the bear-trap baseline on the chart) would negate the recovery sequence and opens lower prices.
This analysis is a personal market view and is not investment advice.
Today's Bitcoin Trading StrategyBitcoin triggers bearish warning: Technical pattern breaches + liquidation of long positions, aiming directly at the psychological threshold
The technical indicators are all bearish, and the rebound is weak.
Looking at the chart, it's clearly visible that all the short-term moving averages are above the price, forming a "bearish arrangement" - it's like multiple layers of ceilings pressing down, and the price simply doesn't have the strength to rise any further. Moreover, the 200-day moving average (107,846 USD) has now become a strong resistance level. The previous several rebounds failed to break through it, and now the price is moving further away from this average, making the rebound even more difficult. Additionally, from the historical trend, Bitcoin is currently trapped between the 200-day moving average and the 365-day moving average (100,367 USD). If this lower boundary of the range is broken, it is very likely to accelerate the decline.
The risk of liquidating long positions is emerging, which may trigger a chain reaction of declines.
There are still a large number of long positions bought in the range of 105,000 - 106,000 USD in the market. Now these positions are already in a loss state. If the price continues to fall below 103,000 USD, these long positions will be forcibly closed (that is, the long positions will be wiped out), and the selling pressure from the forced closure will further push down the price, forming a vicious cycle of "decline - liquidation - further decline". There have been precedents before, where after breaking through a key support level, 500 million USD of long positions were liquidated. This time, the risk is also not small.
Today's Bitcoin Trading Strategy
sell:104000-104500
tp:103000-103500
sl:105000
Why is shorting profitable now? 3 key signalsCritical support "slipping past the edge", with the downward door wide open
The current price of $107,080 is exactly on the $107,000 - $107,500 "life line", which is both a key support at the daily level and coincides with several long-term moving averages. This range has held up several times before, but now it is in a precarious state. More importantly, the price has been hovering below the support level for 3 consecutive days, like an unstable old wall, and a slight external force could cause it to collapse - and historical data shows that if this support is effectively broken, it usually drops by 5% - 15%, with the next target being $105,000 or even lower.
The bulls are being "pushed to the ground and rubbed", and the liquidation wave is still ongoing
In the past 24 hours, the total net liquidation of Bitcoin bulls across the network exceeded $60 million, accounting for 95.88% of the total liquidation amount. It's like the "gamers betting on an increase" being collectively forced to stop trading, and the buying power has been exhausted. More intuitively, the long positions in mainstream exchanges have almost been "cleared", with the proportion of long positions in platforms like Bybit and CoinEx exceeding 97%. The remaining bulls are also like frightened birds, and a slight decline will trigger panic selling, further accelerating the decline.
The Fed "dampens the flames", and the expectation of interest rate cuts has completely cooled down
Previously, everyone thought that the interest rate cut would continue in December, so they were bold enough to buy Bitcoin. Now, Federal Reserve Chair Powell clearly stated that "the interest rate cut in December is far from guaranteed", and the market's expectation of interest rate cuts has dropped from 90% to 67.8%. This means that "cheap money" will be less available. For high-risk assets like Bitcoin, no one is willing to buy heavily again; instead, they will sell and convert to stable assets like dollars and bonds, and the price will naturally lose support.
Today's Bitcoin Trading Strategy
sell:107000-108000
tp:106000-105000
sl:109000
Today's Bitcoin Trading StrategyUS stocks "lagged behind", and Bitcoin followed suit in decline.
The correlation between Bitcoin and US technology stocks has always been high. Recently, US technology stocks suffered a significant drop due to poor performance (the Nasdaq index fell by 2.8% in 3 days), and Bitcoin was also dragged down along with them. It's like two balloons tied together; if one falls down, the other cannot fly either. More importantly, expectations for the Fed's interest rate cuts have weakened - previously, it was thought that there would be frequent rate cuts, but now it's believed that it might take longer, and slower rate cuts mean less "cheap money", making risky assets like Bitcoin more prone to being sold off.
Today's Bitcoin Trading Strategy
sell:108000-109000
tp:107000-106000
sl:110000

Today's Bitcoin Trading StrategyThe price trend has shown a "double top reversal"
When looking at the K-line chart, it is clearly visible that Bitcoin previously rose to a high of $12.6, then fell back and tried to rise again, but failed to exceed the previous high, forming an "M" shape (which is what people call a double top). This is like climbing a mountain. The first time reaching the top without stabilizing caused a fall, and the second time climbing, although close to the top, lacked the strength to go up, so it could only slide further down. Now the price has fallen below the middle low point of this "M" shape, indicating that the downward trend is very obvious.
The external environment has worsened, and Bitcoin cannot withstand it
Recently, the global market has been unstable. For example, trade policies have changed, and there are concerns that inflation will rebound. Everyone starts to buy gold, US dollars and other safe-haven assets, while they are less inclined to touch risky assets like Bitcoin. Moreover, the "expectation of interest rate cuts" that supported Bitcoin's rise has weakened. People are unsure if there will be further interest rate cuts in the future, and no one dares to buy Bitcoin boldly. The price naturally lost the momentum to rise and was more likely to be pushed down by selling pressure.
Today's Bitcoin Trading Strategy
sell:108000-109000
tp:107000-106000
sl:110000

BITCOIN HIGH PROBABILITY SETUP SOON!!!🚨 BTC HIGH PROBABILITY SELL/BUY SETUPS 🚨
* Here We Can See Clearly The Next Potential Moves For BTCUSD Coming Hours/Days.
* Keep Your Eyes Close On Your Trading Positions.
* Happy PIP Hunting Traders.
FXKILLA.
