$Btc Rejected at $110K – Will $106K Hold or Is $95K Next? #BTC/USD is showing signs of another lower high after facing strong rejection near the $110,000 resistance zone. The price is currently testing the $106,000 support area, a level that may serve as a crucial retest zone. If buyers step in here, we could see a bullish rebound and potential push toward a new high.
However, if $106K fails to hold, the next support zones to watch are $100K and $95K. A breakdown below $106K opens the door for a deeper correction, possibly targeting $95,000 – a key demand area from previous structure.
Supporting this bearish pressure, the RSI is dropping from the overbought zone, signaling increasing selling momentum. Historically, such RSI movements have coincided with local tops and short-term pullbacks.
🔍 Key Levels:
Resistance: $110,000
Support 1: $106,000 (retest zone)
Support 2: $100,000 (psychological level)
Support 3: $95,000 (major structure support)
📊 Outlook: Watch price action closely at $106K. A strong bounce could reignite bullish momentum. A break below this level may confirm the start of a deeper retracement.
Btcusdshort

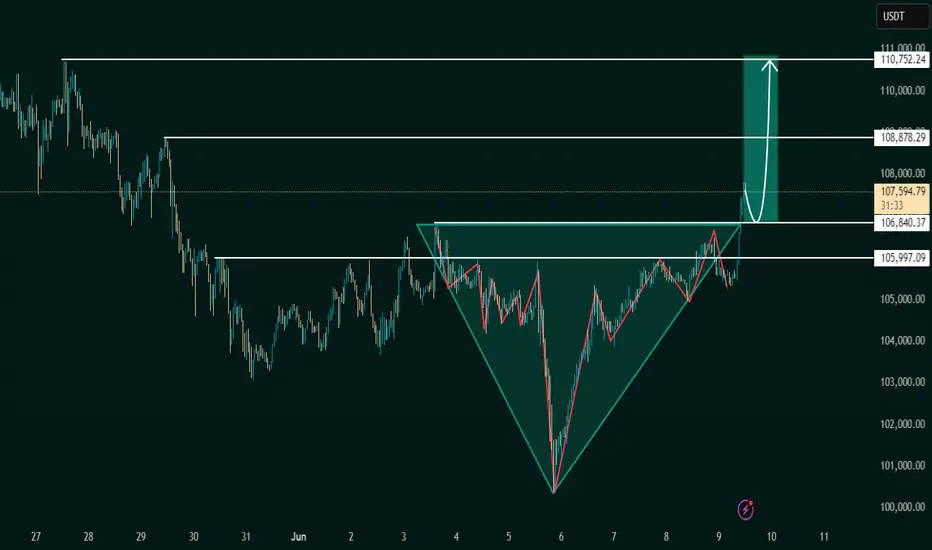
Inverse Head and Shoulders Breakout Signals BullishThe chart under review presents a classic Inverse Head and Shoulders pattern, a reliable and widely recognized bullish reversal formation in technical analysis. This structure typically forms after a downtrend, indicating a potential shift in market sentiment from bearish to bullish.
The pattern is composed of:
Left Shoulder: A modest price decline followed by a temporary upward correction.
Head: A deeper price decline forming the lowest point in the pattern.
Right Shoulder: A higher low that mirrors the left shoulder, followed by another upward movement.
The neckline, which acts as a critical resistance level, is clearly illustrated at approximately 106,840.37 USDT. A confirmed breakout above this neckline suggests the completion of the reversal pattern and validates the potential for a sustained bullish movement.
2. Breakout Confirmation
The current price action confirms a successful breakout above the neckline, with the market currently trading around 107,586.58 USDT. This breakout is a key signal for bullish continuation, provided it is supported by increased volume and follow-through price action.
From a technical standpoint, the breakout is reinforced by:
A clean violation of neckline resistance
Price consolidation near breakout zone before a strong upward thrust
Higher lows preceding the breakout, indicative of growing buying pressure
This confluence of technical signals strengthens the case for an upward price trajectory in the near term.
3. Projected Price Targets
Upon confirmation of the Inverse Head and Shoulders breakout, target levels can be derived using the measured move technique. This involves projecting the vertical distance from the head to the neckline upward from the breakout point.
Target 1 (Initial Resistance):
108,878.29 USDT – This level represents a potential short-term resistance where price may consolidate or retrace slightly before continuing.
Target 2 (Measured Move Completion):
110,752.24 USDT – This is the ultimate price target derived from the height of the head-to-neckline structure. Reaching this level would represent the full realization of the reversal pattern.
4. Key Support and Risk Levels
Risk management is a critical component of any trading strategy. The following support levels should be closely monitored:
106,840.37 USDT (Neckline Support):
Former resistance turned support. Holding above this level post-breakout is essential for sustaining bullish momentum.
105,997.09 USDT:
Acts as a secondary support level and potential stop-loss region for conservative traders.
If price fails to hold above the neckline and falls back below these levels, the breakout could be classified as a false breakout, warranting caution.
5. Strategic Implications for Traders
This setup provides a favorable risk-to-reward ratio for long entries, particularly for traders seeking to capitalize on momentum-based patterns. An optimal trading approach could involve:
Entry: Near the neckline breakout or on a minor retest of 106,840.37 USDT
Stop-Loss: Below 105,997.09 USDT or under the right shoulder to account for volatility
Take-Profit Zones: Partial profits near 108,878.29 USDT, with final target at 110,752.24 USDT
6. Final Remarks
This chart illustrates a textbook example of a bullish reversal pattern in play. While the technical outlook is favorable, traders should remain cautious of potential invalidation scenarios, especially in highly volatile or news-driven markets. Confirmation through volume analysis and supportive macro/fundamental conditions can further enhance confidence in the bullish thesis.
Overall, the current setup indicates a well-structured opportunity for upward price movement, with a clearly defined entry, risk, and reward framework.
Let me know if you'd like this tailored for a trading journal, client report, or automated strategy setup
Shorting Opportunity EmergesBTC has seen significant volatility recently. 📊 After failing to break below 100,000 yesterday, it rebounded sharply to 108,500 immediately. ⚡ Now is precisely the opportunity to go short. 📉
⚡️⚡️⚡️ BTCUSD ⚡️⚡️⚡️
🚀 Sell@ 109000 - 108500
🚀 TP 105000 - 103000
Accurate signals are updated every day 📈 If you encounter any problems during trading, these signals can serve as your reliable guide 🧭 Feel free to refer to them! I sincerely hope they'll be of great help to you 🌟 👇

BTCUSDT: Your Next Move? The Blue Box OpportunityAlright, focusing on BTCUSDT. This blue box is a critical buying zone.
The market's recent moves demand clarity. You need to know where genuine opportunity lies, avoiding the traps that catch most traders.
I've identified this blue box as a prime area where demand could ignite. But don't just jump in. Here's the plan:
Watch the Volume Footprint: Is there real accumulation, or just noise?
Spot CDV Divergences: Hidden strength often appears here, even if price looks weak.
Confirm on LTF: A clear breakout above minor resistance, followed by a retest as support, is your green light.
Be vigilant for liquidity hunts – those quick dips that shake out weak hands before a real move. If this blue box holds, and we get these confirmations, my bias is firmly upwards.
I only focus on assets with sudden, significant volume increases. BTCUSDT's current setup, combined with this potential volume, makes it a high-interest play.
Keep a very close eye on this blue box. Understanding these subtle signals means you can navigate these intricate dynamics, securing your position for potential gains. Miss this, and you might regret it.
📌I keep my charts clean and simple because I believe clarity leads to better decisions.
📌My approach is built on years of experience and a solid track record. I don’t claim to know it all but I’m confident in my ability to spot high-probability setups.
📌If you would like to learn how to use the heatmap, cumulative volume delta and volume footprint techniques that I use to determine very accurate demand regions, you can send me a private message. I help anyone who wants it completely free of charge.
🔑 On my profile, you can find an extensive track record spanning hundreds of analyses and many examples of my strategies in action. To keep things concise here, I'm sharing just a few of my most recent successful calls as a small snapshot of my ongoing work:
📊 FLOKIUSDT - +%100 From Blue Box!
📊 TRXUSDT - I Do My Thing Again
📊 OGNUSDT | One of Today’s Highest Volume Gainers – +32.44%
📊 TIAUSDT | Still No Buyers—Maintaining a Bearish Outlook
📊 Simple Red Box, Extraordinary Results
Feel free to check out my TradingView profile for all of them; listing everything here would genuinely take too long! 😉

BTC Bears Eye 100000 Break; Short at 107000 -108000 ResistanceBTC's downward movement failed to break through 100,000📉, but there is a clear downward trend, and breaking below 100,000 is only a matter of time⏳. In the short term, shorting at high levels can be considered📉. The upward resistance currently has difficulty breaking through 110,000🚧, and shorting can now be considered in the resistance range of 107,000-108,000📉
⚡️⚡️⚡️ BTCUSD ⚡️⚡️⚡️
🚀 Sell@ 107000 - 106000
🚀 TP 102000 - 98000
Accurate signals are updated every day 📈 If you encounter any problems during trading, these signals can serve as your reliable guide 🧭 Feel free to refer to them! I sincerely hope they'll be of great help to you 🌟 👇

Bitcoin B-Wave Trap? Major C-Wave Down Correction Incoming!Bitcoin’s recent bounce has all the signs of a classic B-wave in an ABC corrective structure. After the impulsive A-wave down from the highs, this current rally appears more like a corrective relief move rather than the start of a new bullish impulse. Volume remains weak and the structure looks choppy — not the kind of strength you’d expect from a sustainable uptrend.
I believe we are now completing the B-wave, luring in late bulls before the real drop — the C-wave — begins. This next leg down could be sharp and painful, targeting key support zones and possibly wiping out the complacency that’s built up in the market.
🧠 Watch for signs of exhaustion in this rally.
📉 Potential C-wave targets: 98k 97k
⏳ Timing and structure suggest we’re close to the turning point.
Stay cautious. This could be the calm before the real storm.
---

Will BTCUSD see $90,000 ever again? Phoenix FX mid term analysisBTCUSD 4-Hour Outlook: The Week Ahead
🔴 Key Resistance Zones
First Resistance
$107 000–$108 500
Recent swing highs where price stalled before the last leg down. Clearing and closing above $105 000 on the 4H would open the door toward this zone.
Final Resistance
$111 000–$113 000 (If broken expect a run to $115,000)
The all-time-high area. Heavy sell-side liquidity lives here and past price action shows repeated FVG fills and wicks into this region.
🔵 Critical Support & Buy Zones
Discount Buy Zone:
$92 000–$89 000 (50% at $89 150)
A deeper weekly FVG and longer-term trend support. The ultimate “buy the dip” area if the premium zone gives way.
Premium Buy Zone:
$100 000 – $99 000 (50% at $99 450)
A 4H Fair Value Gap that aligns with our higher-timeframe trend support. The recent bounce here signals strength—and a possible launchpad back into resistance.
📊 Weekly Price Action Scenarios
Bullish Theory:
If BTC can close cleanly above $105 000 on the 4H, look for a run into $107 000–$108 500 (First Resistance). A follow-through push could then target $111 000–$113 000 (Final Resistance) by week’s end with a potential further move to $115 000 where the 8 year trend will be tested again.
Bearish Theory:
Failure to reclaim $105 000, or a clear rejection in the $107 000–$108 500 zone, could usher in a retest of the Premium Buy Zone (~$100 000). A break below $99 000 would shift focus toward the Discount Buy Zone around $92 000–$89 000.
💡 Trade Ideas for the Week
Potential Long Ideas
Entry: 4H candle close above $105 000
Targets: First take-profit at $108 500; stretch target $112 000–$113 000
Stop-Loss: Below $103 000
Zone Re-Entry Long
Entry: Bullish 4H candle close in $100 000–$99 000
Targets: $107 000 then $112 000
Stop-Loss: Below $97 500
Potential Short Ideas
Entry: Bearish price action (e.g., engulfing candle or wick rejection) in $107 000–$108 500
Targets: $100 000→$92 000
Stop-Loss: Above $109 000
Just a Heads-Up:
This is my take on the charts—not gospel, not financial advice, and definitely not a crystal ball 🔮.
Trading is part skill, part patience, and part “what just happened?” 😅
We all see things a little differently, and that’s the beauty of it.
So if you’ve got a hot take, wild theory, or just want to drop some chart wisdom—hit the comments!
Let’s grow, learn, and laugh through the madness together. 🚀📈
Each one, teach one.
— Phoenix FX Team 🔥🦅

"Caught the Dip – Next Stop: Resistance Zone 1. Current Price Action:
The asset has bounced off the demand zone around 101,500 – 102,000 USDT.
It is now trading at 102,204.56 USDT, indicating early signs of the expected bullish move.
A white curved arrow suggests a rounded bottom pattern, often signaling a bullish reversal.
2. Demand Zone (Support):
Remains the same as the previous chart: 101,500 – 102,500 USDT.
Price reacted exactly at this zone and is starting to move upward.
3. Supply Zone (Target Area):
Clearly marked at 104,800 – 105,500 USDT.
This is where the expected bullish move could face resistance or where traders might look to take profit (TP).
4. Visual Reinforcement:
The large blue arrow indicates strong bullish momentum is anticipated.
The meme (Leonardo DiCaprio pointing) emphasizes that the reversal is happening as previously predicted — likely for motivational or engagement purposes in a VIP group.
---
🧠 Technical Sentiment:
Bullish Bias confirmed: Price bounced exactly from the demand zone.
Momentum Shift is underway, as indicated by the reversal pattern.
A potential "Buy Confirmation" is in play with room to ride up to the 105K resistance zone.
---
🎯 VIP Trade Setup Recap:
Parameter Value
Entry Zone 101,500 – 102,000 USDT
Current Price 102,204.56 USDT
Target (TP) 105,000 – 105,500 USDT
Stop Loss (SL) Below 101,000 USDT
Bias Bullish / Reversal
---
📌 Suggested Title:
"Reversal In Motion – Ride to 105K 🎯🚀"

BTCUSD Breakdown Alert | Bearish Momentum Setup in PlayHello traders!
After a strong uptrend, BTCUSD has now broken below the ascending trendline and is retesting from the underside — a classic bearish continuation signal. This could mark a key shift in market structure.
🔍 Key Observations:
Initial consolidation acted as a launchpad for the prior move.
Clean uptrend with higher highs and higher lows.
Recent trendline break suggests weakening bullish momentum.
Price is currently retesting the trendline from below — often a signal of incoming downside if confirmed.
📉 Bearish Scenario:
If this retest holds, BTCUSD may drop toward $105,000, with the next major support around $102,400. A break below that zone could accelerate the downtrend.
Targets / Support levels
Short-term: $105,000
Major support: $102,400
⚠ Risk Management:
Stick to your trading plan — use stop-losses and size positions carefully. No setup is guaranteed. Follow price action, not the hype.
📊 What’s your bias? Bullish or Bearish?
👍 Like & 🔔 Follow for more technical setups!
#CryptoAnalysis #BTCUSD #TrendlineBreak #TechnicalAnalysis #BearishSetup #TradingView #SupportAndResistance #PriceAction

btcusd sell signal. Don't forget about stop-loss.
Write in the comments all your questions and instruments analysis of which you want to see.
Friends, push the like button, write a comment, and share with your mates - that would be the best THANK YOU.
P.S. I personally will open entry if the price will show it according to my strategy.
Always make your analysis before a trade

earish trand analysis Read The ChaptianSMC trading point update
Technical analysis of (BTC/USDT) based on the 4-hour timeframe. Here’s a detailed breakdown of the analysis and the idea behind it:
---
Key Components of the Analysis:
1. Resistance Zone (FVG - Fair Value Gap):
The yellow zone marked as “fvg resistance level” indicates an area where price previously dropped quickly, suggesting inefficiency or imbalance in the market.
Price is approaching this zone again, which acts as a strong resistance.
2. Trendline & Lower Highs:
A descending trendline (with red arrows) shows consistent lower highs, indicating ongoing bearish pressure.
Each rejection from the trendline reinforces sellers’ dominance.
3. CHOCH (Change of Character):
The label “choch” signifies a market structure break, where bullish structure turned bearish.
This marks the transition to a downtrend.
4. EMA 200 (Exponential Moving Average):
The EMA (currently around 102,753) acts as dynamic support.
Price is currently trading above it, but a rejection from the resistance may push it below.
5. Target Zone:
A yellow box near 100,817.99 is labeled “target point”, indicating a possible short-term bearish target if price gets rejected at resistance.
6. RSI (Relative Strength Index):
RSI is around 47.11, slightly below neutral (50), suggesting bearish momentum could be building.
No clear oversold or overbought conditions yet.
---
Trade Idea Summary:
Bias: Bearish
Scenario:
If price reaches the resistance zone (~106,800–107,500) and fails to break above, a sell-off is expected.
First target: 100,800–101,000 zone
Price may also dip below EMA 200 confirming bearish strength.
Confirmation:
Rejection candle or bearish engulfing pattern near resistance.
RSI staying below 50 and starting to dip.
Invalidation:
Clean breakout and close above the resistance zone and trendline (~108,000+).
Mr SMC Trading point
---
Conclusion:
This chart sets up a high-probability short trade around the resistance area, leveraging both structural and momentum indicators. It suggests waiting for confirmation of rejection before entering, targeting the previous support and imbalance zone below.
Pales support boost 🚀 analysis follow)

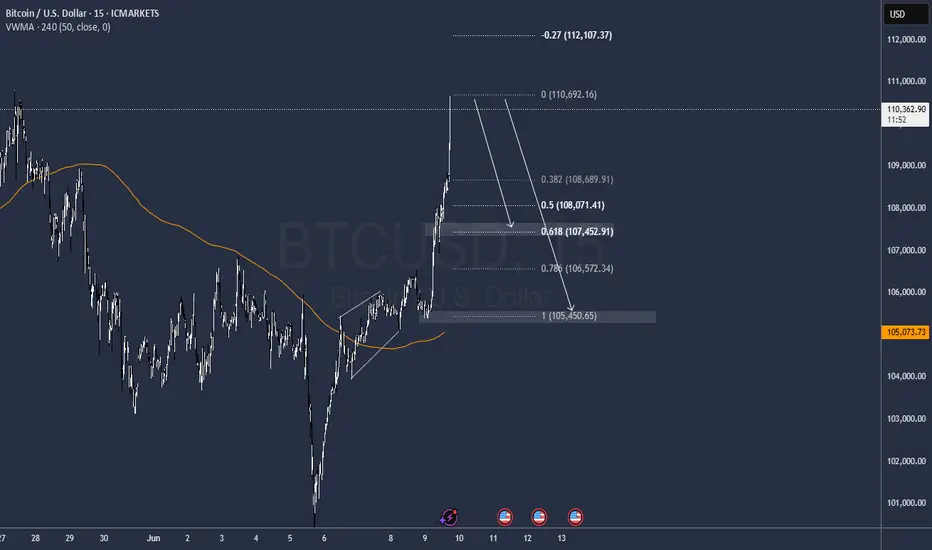
Bitcoin - Ready to go but from lowerAfter breaking out of the marked range, Bitcoin retested the level but is now showing weakness in bullish momentum.
Although the price has broken above the high that created the last lower low, it did so without strong momentum, and is now pulling back.
🔍 We are watching the highlighted zones for potential bullish reactions.
In these areas, we will look for a confirmed long entry trigger.
⚠️ The lower the price drops—especially if it reaches the 4H Fair Value Gap (FVG)—the higher the reward-to-risk ratio for long setups.
Be patient and wait for confirmation before entering. ✅
🔍 Insight by ProfitaminFX
If this outlook aligns with your bias, or if you see it differently, feel free to share your perspective in the comments. Let’s grow together 📈

BTCUSD Bearish Signal | Technical + Custom AlgoSmart Trend Signal | Technical Analysis + Custom Algorithm
This signal is the result of a combination of classic technical trend analysis and a proprietary software I personally developed.

BTCUSDT Hello traders, wishing everyone a great weekend!
I’ve identified a sell opportunity on BTCUSDT and decided to share it with you as well.
🔍 Trade Details:
✔️ Timeframe: 15-Minute
✔️ Risk-to-Reward Ratio: 1:2 / 1:4
✔️ Trade Direction: Sell
✔️ Entry Price: 103,826.28
✔️ Take Profit: 103,428.15
✔️ Stop Loss: 104,025.48
🔔 Disclaimer: This is not financial advice. I’m simply sharing a trade I’ve taken based on my personal trading system, strictly for educational and illustrative purposes.
📌 Interested in a systematic, data-driven trading approach?
💡 Follow the page and turn on notifications to stay informed about upcoming trade ideas and advanced market insights.

BTC/USD – Double Top Breakdown Signals Bearish Wave- 4H chart. 🧨
🔍 Chart Analysis:
🟢 Recent Price Action:
Bitcoin formed a double top pattern near the Recent All-Time High (ATH) 📈 — a strong bearish signal 🔔.
A trendline break occurred right after the second peak, confirming potential weakness ⚠️.
🟠 Supply Zone:
Price re-entered a previous supply zone (resistance area) and failed to hold above it 🧱 — indicating sellers are active again.
🔵 EMA 70 (Blue Line):
The price has dropped below the 70 EMA, signaling momentum shift from bullish to bearish 📉.
🔴 STOP LOSS ZONE:
Positioned above 110,555 🚫 — risk level for this short setup if bulls reclaim control.
🟡 Bearish Pathway (Expected Move):
Price may retest the broken zone 🔁.
Followed by a sharp drop to the 1st support near $101,503 🎯.
Confirmed by large bearish volume spikes 📊.
💥 Trade Idea:
Entry: Near 106,000 (on retest of supply zone).
Stop Loss: Above 110,555 🔺.
Target: $101,500 🎯.
Risk/Reward Ratio: 🔥 Favorable setup for swing short sellers!
📛 Pattern Breakdown:
⚠️ Double Top = Reversal Signal.
🔻 Trendline Break = Shift in Market Structure.
🧊 Supply Zone Rejection = Bearish Confirmation.

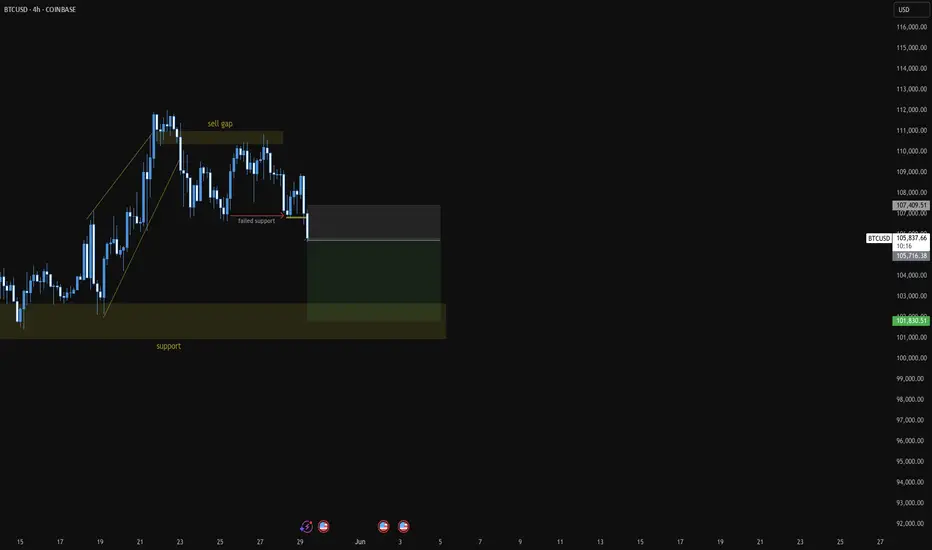
Sell to Bull supportbear pressure is established after the break of TL of the wedge channel. Followed by a strong bear BO that lead to a sell gap. Possible PB after current market made new low.
bitcoin on bearish#BTCUSD price have shown reverse trend which will drop below 106k.
Firstly we await for drop below 109300 for sell, Target 106k, SL 110151
But if prices move above 110151 Firstly then it will reach 110747 which will decline to head bearish.
Bullish is not valid yet.
#BTC

bitcoin needs a long term downward correction Bitcoin right now is in a overbought condition. technically it already gives sign for a downward correction . wait for the marking position. here you need to find the sell confirmation.
Gold Surges, Euro Plunges, BTC at RiskOn May 23rd's U.S. session, Trump's EU/Apple tariff plans sparked market chaos:
Gold surged 💥 as a safe haven.
The euro plunged on EU tariff fears.
If tariffs persist, capital may flood into gold/forex, likely triggering a BTC crash.
⚡⚡⚡ BTCUSD ⚡⚡⚡
🚀 Sell@109500 - 108500
🚀 T P 106500 - 104500
👇Accurate signals are updated every day 📈 If you encounter any problems during trading, these signals can serve as your reliable guide 🧭 Feel free to refer to them! I sincerely hope they'll be of great help to you 👇
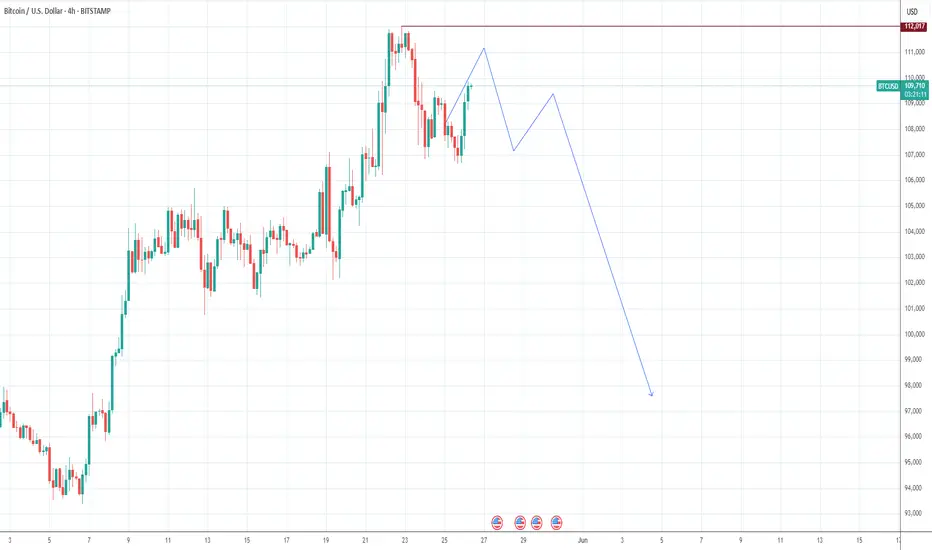
BTCUSD SHORT OPPORTUTY FOR THE WEEKENDBITCOIN SUPPLY ZONE TARGETED - SELL LIMIT SET 🔥
BTC/USD has made a strong move upward but is now approaching a major supply zone, where a Sell Limit is placed at 110997. This level aligns with previous highs and signs of distribution, signaling a potential reversal ahead.
With current price action consolidating around 109034, we are watching for rejection and a possible drop towards the next demand zones at 108551 and 106178.
This setup is ideal for smart traders looking to short the top and ride the retracement. As always, risk management is key. Let’s see how the market reacts.
Precision over prediction. Strategy over emotions.
#BTCUSD #BitcoinAnalysis #CryptoTrading #SellLimit #SmartMoneyConcepts #SupplyAndDemand #TechnicalAnalysis #DayTrading #CryptoSetup #BTCTrade #BearishSetup #PriceAction #CryptoSniper #BitcoinReversal #TradingStrategy #CryptoTraders #MarketStructure #XAUkingCharts

Bitcoin (BTC/USD) – Rising Wedge Pattern Signals & BreakdownThis chart illustrates a Rising Wedge Pattern on the weekly timeframe for Bitcoin (BTC/USD), which is generally considered a bearish reversal pattern in technical analysis. The pattern appears after a strong upward move and typically signals that the price is losing momentum and may be preparing for a significant correction.
📐 What is a Rising Wedge Pattern?
A rising wedge is a chart pattern formed when the price consolidates between two upward-sloping trendlines – the support line (bottom) and the resistance line (top) – with the two lines converging toward each other.
As price climbs higher, it forms higher highs and higher lows.
However, the slope of the highs is less steep than the slope of the lows, showing a loss of bullish strength.
Eventually, the price breaks below the support line, often leading to a sharp move downward.
🔍 Key Highlights from the Chart:
📌 1. Major Resistance Zone (~$110K–$120K):
BTC is currently facing heavy resistance in this area.
This zone has historically acted as a supply zone where bulls have struggled to break through.
Multiple rejection wicks indicate strong selling pressure.
📌 2. Pattern Touchpoints:
BTC has now formed multiple touchpoints on both the support and resistance lines of the wedge, confirming the structure.
This gives the pattern higher validity from a technical analysis perspective.
📌 3. SR Interchange Zone (~$65K–$70K):
This is a key horizontal zone where past resistance could act as future support.
A successful breakdown may first test this level before continuation.
📌 4. Retesting After Breakdown:
After breaking the wedge support, a retest of the broken trendline is often seen.
If the retest is rejected, it confirms the breakdown and opens the door to deeper bearish movement.
🎯 Target Projection:
If the wedge breaks down and the bearish scenario plays out, we could see Bitcoin fall to the $22,000–$25,000 region – marked as the final target zone on the chart. This level aligns with:
Previous macro-support zones from 2021
Fibonacci retracement levels
Psychological price levels where buyers may re-enter
⚠️ Bearish Factors to Watch:
Bearish divergence on indicators like RSI or MACD (not shown on chart but worth checking)
Volume decreasing as price rises – a classic wedge behavior
Macroeconomic headwinds or Bitcoin halving-related exhaustion
Rejection from major resistance with strong bearish candles
🕒 Timeframe & Patience:
This is a weekly chart, which means the pattern will play out over weeks or months, not days. Patience is key. A clear break, retest, and rejection would be the most reliable confirmation to expect further downside.
✅ Invalidation Scenario:
If BTC breaks above the wedge resistance line with strong bullish volume and holds above the $120K level, this bearish thesis becomes invalid.
In that case, BTC could enter price discovery mode, making new all-time highs.
💬 Final Thoughts:
This analysis is a technical outlook, not financial advice. Always use stop-loss strategies and manage your risk carefully. Market sentiment, news, and macro factors can quickly shift the scenario. However, from a purely technical standpoint, the rising wedge pattern is a powerful signal that should not be ignored.

BTCUSDTHello Traders,
Despite it being the weekend, I’ve identified a short trade opportunity on BTCUSDT. The trade is currently active on my end, and anyone interested is welcome to consider entering as well.
🔍 Trade Details:
✔️ Timeframe: 15-Minute
✔️ Risk-to-Reward Ratio: 1:2 / 1:4
✔️ Trade Direction: Sell
✔️ Entry Price: 107,743.42
✔️ Take Profit: 107,181.56
✔️ Stop Loss: 108,119.24
🔔 Disclaimer: This is not financial advice. I’m simply sharing a trade I’ve taken based on my personal trading system, strictly for educational and illustrative purposes.
📌 Interested in a systematic, data-driven trading approach?
💡 Follow the page and turn on notifications to stay informed about upcoming trade ideas and advanced market insights.
