Tariff Shock Sends BTC to 75K — Can Bulls Reclaim 86K?Greetings...
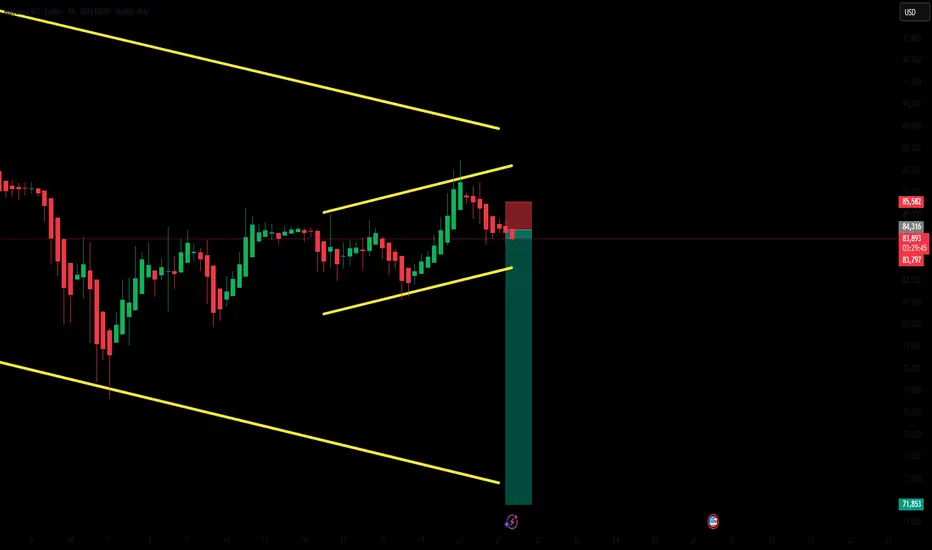
Bitcoin faced a sharp decline to the 75,000 level following the announcement of tariffs, which triggered panic and heightened uncertainty across the crypto market. Currently, BTC is attempting to reclaim the key 85,000 resistance zone. However, a descending trendline is capping upward momentum, adding to the difficulty of a clean breakout. A decisive weekly close above 86,000 could invalidate the bearish setup and open the door for bullish continuation. Conversely, failure to break and close above this level would likely lead to a swift drop toward the 71,000 support zone, with minimal structural support in between.
A weekly close below the 85,000 level would confirm bearish continuation, opening the door for a retest of the 72,000 support zone — a key structural level that previously acted as a demand area. Failure to hold above 72,000 could invalidate the current range and trigger a deeper correction toward the prior macro support around 55,000. Based on current momentum and price structure, a move toward the 55,000 region appears increasingly probable in the near term.
Btcusdshort

Bitcoin (BTC/USD) Long Trade Setup – Breakout Strategy with TargCurrent Price: $80,724.28
Entry Point: $80,671.23 (just above current price)
Stop Loss: $78,052.44
Target Point: $88,573.60
Resistance Point: $82,260.90
📈 Trend & Moving Averages
EMA 30 (red): $80,220.87 — Short-term trend.
EMA 200 (blue): $80,788.61 — Long-term trend.
The price is currently between the EMAs, indicating potential indecision or a shift in trend. A break above both EMAs with momentum would confirm bullish strength.
🔑 Trade Setup Summary
Element Level
Entry 80,671.23
Stop Loss 78,052.44
Target (TP) 88,573.60
Resistance 82,260.90
Risk-Reward ~1:2.7 (approx)
📊 Analysis & Expectations
Bullish Bias: The chart suggests a long trade with a breakout strategy.
Volume and momentum confirmation will be key above resistance.
Resistance at 82,260.90 may cause a brief pullback before continuation to the target.
The stop loss is well-placed below a support zone and the most recent swing low.
✅ What to Watch For
Break and close above EMA 200 and resistance at 82.2K.
Bullish volume increase on breakout.
Price action around the entry zone (wait for confirmation candle if unsure).

BTC | BEARISH Cycle Begins | $71KThere are a few tell signs that BTC has entered the bearish market.
If the price fails to maintain closing daily candles ABOVE the 70k area, there is a likelihood for a nasty Head and Shoulders pattern to form.
A key point to watch are the Bollinger Bands, which gives you an indication of the next possible zone to watch.
_____________________
BINANCE:BTCUSDT

Bitcoin Sell to 73/72k ?There is a potential incoming sell on the 4 hour time frame.
Take profit around : 73/72 k
Stop loss: 85.6k
Short position openedI invest in Bitcoin, and don’t usually trade. However, I can see a pretty bearish setup unfolding.
Trade set up:
Entry price: 85341.66 (black line in 4H)
Stop loss: 87,962 (red line in 4H chart, just above the previous week high)
Target 1 - 80.971 (green line, previous week low and Fib 0.5 level in Daily chart)
Target 2 - 78, 253 (green line in 4H chart, previous month low, approx 50% encroachment zone of fair value gap in daily chart .
Reasons:
Weekly:
MACD is still in the bull territory but MACD lines are clearly moving to the downside.
The price has retraced to 50% of the massively bearish red candle of(March 3rd weekly candle) and now resuming to move to the downside.
Daily:
RSI and MACD are both in the bear territory and it looks like they are rolling back to the downside in the bear territory, which is pretty bearish.
The price has dropped and closed below the ascending trend line.
4H:
The price has been travelling inside the ascending parallel channel, but it is dropped and closed below the bottom line.
Both MACD and RSI are deep in the bear territory.

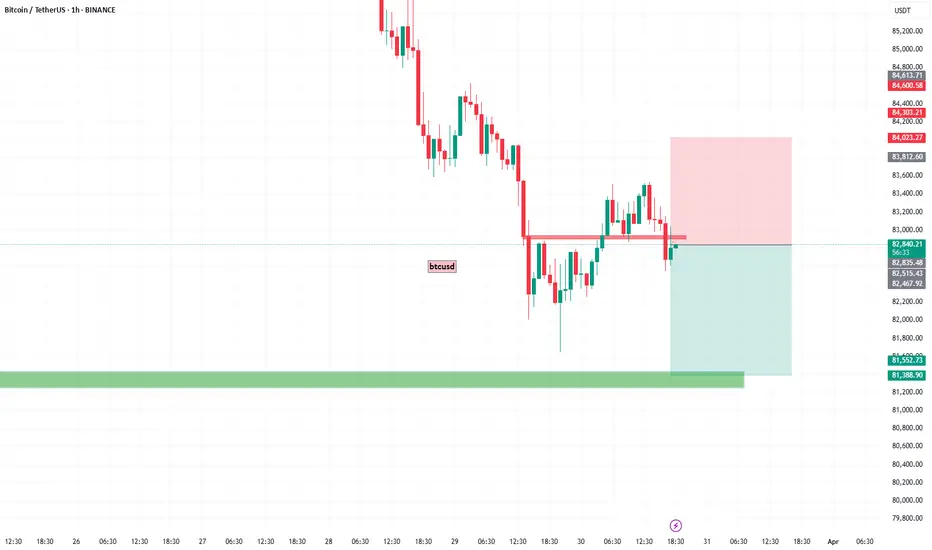
TC/USD Bearish Flag Breakdown Targeting 81,660 Support ZoneThis is a 1-hour BTC/USD (Bitcoin/US Dollar) chart showing a bearish setup. Here's the breakdown:
---
Key Observations:
1. Bearish Rejection Zone (Purple Box - ~83,174.62):
Price is showing rejection at a key resistance zone.
Both the 30 EMA and 200 EMA are above current price, adding downward pressure.
2. EMA Analysis:
30 EMA (Red Line): ~83,174.62 – acting as dynamic resistance.
200 EMA (Blue Line): ~83,715.92 – strong long-term resistance.
Price is below both EMAs, reinforcing bearish sentiment.
3. Pattern Analysis:
Bearish flag/wedge breakdown has already occurred.
Target projection based on measured move suggests a ~1.44% downside.
Anticipated drop towards 81,660.29, which aligns with prior support zone.
4. Price Action:
Recent breakdown from a small rising channel (bear flag).
Pullback to resistance (purple zone) seems complete, and continuation downward is expected.
---
Strategy Summary:
Bias: Bearish
Entry Zone: Near 83,174.62 (already rejected)
Target: 81,660.29
Stop Loss Idea: Above 83,715.92 (EMA 200)

Short The price is consolidating between 89,000 and 76,500 zone. But I can see another downward move to 76,500 is developing.
Where I drew blue rectangular blocks and red vertical lines in the chart (Feb and March 2025) are the very similar set up as the current situation as follows:
1) The market creates the set up where it looks like the price is slowly recovering and pushes above EMA200.
2) The reverses aggressively to the downside (liquidity sweep).
3) The price consolidates in the very tight range.
4) Momentum indicators move into the bear zone.
I already have one small short position, but once RSI and MACD enter the bear zone and the price stays below VWAP (purple line drawn from the August 24 low) and also closes below the buy order block (green box), I will open another short position.
Stop loss - above EMA 200 in 4H chart.
Target - 76,540

btcusd sell scalpingbtcusd sell scaliping
reason is 1hr support touch
so sell side passiblity high change

USDT Dominance Good for Bitcoin price actionHello everyone!
I want share my price analysis at USDT Dominance.
The reason i am making Bitcoin price action analysis at USDT Dominance is here chart is more clear and gives me better view of what is happening at market.
After Trump inauguration day most of retail traders excepted bullish bitcoin, but we saw strong sellers, that means bitcoin will find new strong buyer and it will reach new high then, but i think the new high will be maybe 2026 or 2027. if we will look at USDTD we will see the price action is still uptrend, but not too strong it tested well support after 1D double bottom and went higher.
my price prediction will be it will test 6.75 were it will get huge reaction, but the price will come back second time and we need to wait for that moment, if we will get same price reaction, it will be start of bullish bitcoin, at the moment i think bitcoin will be at 55000 or 60000, but if USDTD will brake 6.75 then we need to wait Bitcoin at 40000-45000.
We will see what will happen that's only my opinion it will happen.
Always make your own research

Bitcoin (BTC/USD) – Bearish Breakdown & Key Levels to WatchMarket Overview:
Bitcoin is trading at $84,185, showing a +1.63% increase. The price action suggests a potential breakout towards the upside.
🔹 Chart Structure:
BTC has been consolidating in a range-bound structure after a sharp upward move.
Previous rising wedge patterns led to corrections, but the price is holding key support levels.
A breakout setup is forming with a target towards $88,500 – $90,000.
🔹 Key Levels to Watch:
✅ Resistance: $85,249, $86,934, $88,500, $90,000
✅ Support: $82,000, $81,400
🔹 Potential Trade Setup:
📈 Bullish Scenario:
If BTC holds above $84,000, a push towards $86,500 – $88,500 is likely.
A breakout above $88,500 could lead to $90,000+.
📉 Bearish Scenario:
If BTC rejects $85,000, a pullback to $82,000 – $81,400 may occur before another move up.
🔹 Conclusion:
Bias: Bullish above $84,000
Target: $88,500 – $90,000
Invalidation: Below $81,400
Would you like a more detailed trade plan with stop-loss and entry points? 🚀

Bitcoin (BTC/USD) 4H Chart Analysis – Professional BreakdownBitcoin (BTC/USD) 4H Chart – Detailed Professional Analysis
This chart presents a Rectangle Pattern, a common consolidation structure in technical analysis. The price has been oscillating between a well-defined resistance level near $88,000 - $89,000 and a support level around $80,000 - $81,000. This pattern suggests an upcoming breakout, with bearish continuation being the most probable scenario.
Understanding the Rectangle Pattern
A rectangle pattern forms when price moves sideways, trapped between two horizontal levels. Traders watch for a breakout in either direction to determine the next trend. In this case, Bitcoin has tested the resistance multiple times but failed to break above, indicating strong selling pressure. Meanwhile, support has been retested several times, which weakens its strength over time.
A bearish breakdown is likely because:
Buyers appear unable to push past resistance, showing exhaustion.
Support has been tested multiple times, which increases the chance of a breakdown.
The dotted black trendline is now being tested, and a break below it would further confirm bearish momentum.
Trade Setup for a Breakdown
A short trade becomes valid only if Bitcoin breaks below the $81,000 - $82,000 support zone with strong momentum. The price must close below this level to confirm the move.
How to Enter the Trade?
Look for a strong bearish candle close below the $81,000 - $82,000 range.
If Bitcoin retests this broken support (now acting as resistance), this can be a secondary short entry point.
Once confirmation is seen, open a short position.
Stop Loss Placement
To protect against false breakouts, a stop loss should be set above the $88,457 resistance zone. If the price moves back into the rectangle and surpasses this level, it means the bearish setup is no longer valid.
Profit Target and Trade Expectation
The expected take profit target is $73,541. This is calculated using the measured move projection, meaning the height of the rectangle is subtracted from the breakdown point. If Bitcoin reaches this level, the trade will have successfully captured the bearish momentum.
Market Psychology Behind This Move
The repeated failure to break above resistance ($88,000 - $89,000) signals weak buying interest. Buyers have been stepping in at support, but each retest of the $80,000 - $81,000 zone makes it more vulnerable.
Once support finally breaks, several factors will accelerate the move:
Long positions will be forced to sell, increasing selling pressure.
Breakout traders will enter new short positions, pushing price further down.
Liquidity below support will be triggered, causing Bitcoin to fall sharply toward the $73,541 target.
Invalidation Scenario (Bullish Case)
If Bitcoin breaks above $88,000 - $89,000 and holds, the bearish setup becomes invalid. In that case:
The price would shift into a bullish continuation pattern.
Traders should avoid shorting and instead look for buying opportunities above resistance.
Final Thoughts
This is a high-probability bearish setup, but patience is key—wait for confirmation before entering.
Risk management is crucial : The stop loss at $88,457 ensures that losses are minimized if the market moves against the trade.
If Bitcoin remains inside the rectangle, traders can buy at support and sell at resistance until a breakout occurs.

BTCUSD hourly trend analysis for April 04, 2025It is in a bearish trend. Sell signal has confirmed the Stop Loss at 83382. This pair has a strong support at 82074 and 80900.

Bitcoin (BTC/USD) Rectangle Pattern Breakdown – Bearish Move1. Overview of the Chart & Market Context
The chart provided represents Bitcoin (BTC/USD) on the 1-hour timeframe, published on TradingView. This analysis highlights the rectangle pattern formation, key support and resistance levels, and a potential short trade setup with defined risk management.
The market structure suggests a bearish outlook, as Bitcoin attempted to break above a resistance level but failed, leading to a sharp decline. The price action now indicates further downside movement, aligning with a rectangle pattern breakdown.
2. Rectangle Pattern Formation
What is a Rectangle Pattern?
A rectangle pattern is a consolidation phase where price moves sideways within a defined range, forming multiple touches at resistance and support before a breakout occurs. It can serve as a continuation or reversal pattern, depending on the breakout direction.
In this case, the pattern has resulted in a bearish breakout, indicating that sellers have taken control of the market.
Key Characteristics of This Rectangle Pattern:
The upper boundary (resistance) is at 88,333 USD, where price repeatedly failed to break higher.
The lower boundary (support) is at 78,044 USD, which acted as a strong floor but is now under pressure.
The price moved within this range for an extended period, showing a balanced battle between buyers and sellers.
A failed breakout at resistance, followed by a sharp rejection, signals a bearish reversal.
3. Breakdown of Key Levels & Market Structure
A. Resistance Level – 88,333 USD
This level has been tested multiple times, but price failed to hold above it.
The recent failed breakout led to a strong bearish rejection, confirming resistance.
The price action formed a bearish engulfing candlestick, adding to the bearish bias.
B. Support Level – 78,044 USD
This zone has previously provided multiple bounces, showing strong buying interest.
However, with the recent break below this level, it may now act as resistance.
If the price retests this area and fails to break above, it confirms a bearish continuation.
C. Price Rejection and Market Structure Shift
The formation of lower highs and lower lows signals a transition from consolidation to a downtrend.
The price broke out of the rectangle pattern to the downside, confirming a bearish breakout.
If the support at 78,044 USD fails, the price may continue dropping toward 73,678 USD.
4. Trade Setup & Execution Plan
🔹 Entry Strategy
A short position is initiated after the bearish rejection at resistance (88,333 USD).
The breakdown of the rectangle pattern strengthens the short setup.
The price may briefly retest the broken support (78,044 USD) before continuing downward.
🔹 Stop-Loss Placement
The stop-loss (SL) is placed above 88,333 USD, ensuring that if price moves against the trade, risk is minimized.
This protects against any unexpected bullish reversal.
🔹 Profit Targets (Take Profit - TP)
TP1: 78,044 USD (previous support level) – A conservative target.
TP2: 73,678 USD (deeper support) – If bearish momentum continues, this is the extended target.
Trade Component Details
Entry Short after rejection at 88,333 USD
Stop-Loss (SL) Above 88,333 USD
Take Profit 1 (TP1) 78,044 USD
Take Profit 2 (TP2) 73,678 USD
Confirmation Breakout & retest of support
Risk-Reward Ratio Favorable (defined SL & TP)
5. Expected Price Action and Market Behavior
🔻 Bearish Scenario (Most Likely Outcome)
The price will continue to fall towards TP1 (78,044 USD) due to selling pressure.
If 78,044 USD fails to hold, Bitcoin is likely to test the next major support level (73,678 USD).
The structure of lower highs and lower lows supports the downtrend.
🔺 Bullish Scenario (Invalidation of the Short Setup)
If Bitcoin breaks above 88,333 USD, the bearish outlook is invalidated.
This could signal a potential trend reversal or bullish breakout.
6. Technical Indicators Supporting the Analysis
Several technical indicators can be used to confirm the bearish outlook:
📉 RSI (Relative Strength Index):
If RSI is below 50, it confirms bearish momentum.
If RSI is oversold (<30), a temporary bounce may occur.
📉 Moving Averages:
If the 50-period MA crosses below the 200-period MA, it confirms a bearish trend.
If price is below both MAs, it strengthens the bearish setup.
📉 Volume Analysis:
A high selling volume during the breakdown indicates strong bearish conviction.
If volume spikes near support levels, a potential bounce could happen.
7. Summary of Key Findings
Pattern Identified: Rectangle pattern with a bearish breakout.
Market Structure: Price formed lower highs and lower lows, signaling a downtrend.
Trade Setup:
Short trade after rejection at 88,333 USD.
Stop-loss above 88,333 USD to manage risk.
Profit targets at 78,044 USD (TP1) and 73,678 USD (TP2).
Risk Management:
Clear stop-loss and take-profit levels ensure a controlled risk-to-reward ratio.
If price moves against the trade, the stop-loss prevents excessive losses.
Technical Indicators:
RSI, Moving Averages, and Volume Analysis confirm the bearish outlook.
8. Final Thoughts & Trading Plan Implementation
This analysis presents a high-probability bearish trade setup using the rectangle pattern breakdown strategy. With proper risk management, traders can execute this short trade with a structured plan.
🔹 Actionable Trading Plan:
Wait for price confirmation – If BTC retests the broken support (78,044 USD) and rejects, this strengthens the trade idea.
Execute the short trade – Once confirmation occurs, enter a short position.
Manage risk appropriately – Stick to the stop-loss above 88,333 USD.
Monitor price action – Adjust take-profit levels based on momentum and support breaks.
If the price invalidates the setup by breaking above resistance, it is crucial to exit the trade and re-evaluate the market conditions.
Conclusion:
This Bitcoin (BTC/USD) rectangle pattern breakdown analysis provides a clear bearish trade setup, supported by market structure, technical indicators, and price action. The well-defined entry, stop-loss, and take-profit levels ensure a structured risk-reward ratio, making this a viable short trade opportunity.

BTCUSD Trading StrategyBTCUSD has experienced a significant decline. While the indicators have yet to show signs of stabilization or a trend reversal, the price action on the candlestick chart indicates that there is support in the range of 82,000-80,000. Therefore, I believe it is an opportune moment to position for a long trade within this range, exercising patience as we await a price rebound to achieve the TP1/TP2 targets.

BTCUSD hourly chart projection till April 03, 2025BTCUSD looks bearish with the given Support and Resistance levels. Once the Dynamic Signal confirms the sell entry with stop loss and targets, that makes the best point to enter into the trade.

BTCUSDT SELL/ SHORTBy utilizing Fibonacci retracement levels, historical patterns, , we can formulate a hypothesis that the market might follow a similar trajectory if bearish sentiment prevails.
Bitcoin (BTC/USD) Breakdown – Rising Wedge Signals Further Drop!1. Chart Overview
This 4-hour BTC/USD chart from BITSTAMP presents a well-defined Rising Wedge pattern, which is a bearish reversal structure typically signaling an upcoming price decline. After a strong upward movement, Bitcoin formed a wedge pattern with higher highs and higher lows converging. This indicates weakening bullish momentum, leading to a confirmed breakdown.
2. Key Technical Elements & Market Structure
A. Rising Wedge Formation (Bearish Pattern)
A rising wedge is a bearish reversal pattern that appears after an uptrend, showing gradually weakening buying pressure.
The chart shows that price action was following an upward sloping support and resistance trendline.
The higher highs and higher lows formed within the wedge indicate a loss of bullish momentum.
Eventually, the price broke below the lower trendline, confirming a bearish breakdown.
B. Breakdown Confirmation
A decisive bearish candle broke below the wedge's lower trendline, confirming the downward move.
After breaking down, the price attempted a small retest of the wedge’s support, which has now turned into resistance.
This successful rejection from the previous support adds to the bearish confirmation.
C. Support & Resistance Levels
Resistance Level ($88,547):
This zone acted as a strong supply area, where previous bullish moves were rejected.
If BTC/USD attempts to recover, this area may provide selling opportunities.
Support Level ($79,193):
This is the next downside target, aligned with previous price consolidation zones.
A break below this support could trigger further selling pressure.
3. Trading Setup & Strategy
A. Short Trade Setup
Entry Point: After BTC/USD confirmed the breakdown of the rising wedge.
Stop Loss: Placed slightly above the $88,547 resistance level to limit risk.
Target Price: A decline towards $79,193, which aligns with the previous major support zone.
B. Bearish Market Sentiment
BTC/USD is currently trading below the wedge, reinforcing bearish bias.
A successful retest of the broken wedge support would validate further downside continuation.
If price remains below the $85,000 level, sellers are likely to maintain control.
4. Market Outlook & Next Price Action
Bearish Scenario
If BTC fails to reclaim the wedge breakdown level, further downside is expected.
A breakdown below $80,000 psychological level could increase selling momentum toward $75,000-$77,000 levels.
Volume analysis suggests that selling pressure is increasing.
Bullish Scenario (Invalidation)
If BTC/USD reclaims the $88,547 resistance and closes above it, the bearish bias could weaken.
Bulls need to break above the rising wedge resistance trendline for a reversal.
5. Conclusion & Trading Plan
The Rising Wedge pattern breakdown confirms a bearish outlook for BTC/USD.
The risk-reward ratio for a short trade is favorable, targeting a move down to $79,193.
Traders should watch for volume confirmation and trend continuation signals before entering.
Key Takeaways
✅ Bearish Bias confirmed after the Rising Wedge breakdown.
✅ Short Position setup with entry, stop loss, and target defined.
✅ Resistance at $88,547 - Failure to break above it strengthens the bearish case.
✅ Target at $79,193 - A strong support area where buyers may step in.
6. Tags for TradingView Post
#BTC #Bitcoin #Crypto #TradingSetup #TechnicalAnalysis #CryptoTrading #BearishPattern #RisingWedge #Breakdown #ShortTrade #PriceAction #SupportResistance #MarketAnalysis
Would you like any further refinements or additional insights? 🚀

Why We Are Expecting a Short Position in BTCUSD: Detailed Analys1. Breakout from Consolidation Phase
BTCUSD has recently broken out of a prolonged consolidation phase, which is a strong indicator of a potential shift in market sentiment. Consolidation typically occurs when price moves within a narrow range, as buyers and sellers remain in equilibrium. This phase often acts as a buildup for a significant breakout in either direction.
Recent Price Action:
BTCUSD was trading in a tight range, forming a horizontal consolidation zone with well-defined support and resistance levels. This range was consistently tested, but no decisive movement occurred until the recent downside breakout.
Significance of Breakout:
The breakout below the consolidation zone signals that the sellers have gained control, leading to an increase in bearish momentum. A decisive breakout from consolidation often results in strong directional movement, favoring the breakout direction.
2. Break of Previous Low – Confirmation of Bearish Trend
One of the most compelling reasons to initiate a short position is that BTCUSD has broken below a significant previous low.
Previous Low as Support:
The prior low acted as a critical support level that was tested multiple times during the consolidation period. When price decisively breaks below this level, it suggests that the support has failed, indicating increased selling pressure.
Breakout Confirmation:
A confirmed breakout below the previous low typically attracts more sellers and triggers stop-loss orders placed by buyers, leading to a further downward push. This kind of price action is a strong confirmation that the bearish trend is likely to continue.
3. Retest and Better Entry Opportunity
Ideal Short Entry:
After the initial breakout, BTCUSD may retest the broken support (now acting as resistance), providing an ideal opportunity to enter a short position.
Retests often occur when price temporarily pulls back toward the breakout zone, giving latecomers a chance to enter at a better risk-reward ratio.
If the retest is rejected near the previous support level (now resistance), it reinforces the validity of the breakout and provides a high-probability short entry.
Low Risk, High Reward Setup:
Entering after a retest allows placing a stop-loss slightly above the previous support-turned-resistance zone while targeting the next key support level, enhancing the risk-reward ratio.
4. Increased Bearish Momentum and Volume Confirmation
Volume Spike on Breakout:
A breakout accompanied by high volume further validates the move. Volume often acts as a confirmation that the breakout is genuine and not a false move. The increase in selling volume confirms that more market participants are aligned with the bearish outlook.
Momentum Indicators:
Momentum indicators like RSI and MACD are showing bearish divergence or have moved below key levels, suggesting that downward momentum is increasing. A break below the consolidation zone with rising bearish momentum adds further conviction to the short trade.
5. Macro and Sentiment Analysis Supporting Bearish Outlook
Macroeconomic Factors:
Broader market factors, such as increased risk aversion in global markets, regulatory concerns, or bearish sentiment surrounding cryptocurrencies, further strengthen the bearish case.
Sentiment Shift:
A shift from bullish optimism to bearish sentiment among traders often accelerates the downtrend, as fear takes over and more sell orders flood the market.
🎯 Target and Risk Management
Primary Target:
Initial target would be the next major support level, which can be identified through historical price levels or Fibonacci extensions.
Stop-Loss Placement:
Stop-loss should be placed slightly above the retested resistance level to minimize risk in case of a false breakout.
✅ Summary:
We are expecting a short position in BTCUSD primarily because:
A strong breakout occurred after a prolonged consolidation.
Price broke below a key previous low, confirming a bearish trend.
A potential retest provides a better entry point with low risk and high reward.
Volume and momentum indicators support the continuation of the downtrend.
This setup presents an excellent opportunity to capitalize on the bearish momentum in BTCUSD. 🚀

Bear cycle begins if this happens. Not the time of buy the dipI have been thinking this Bitcoin cycle has already peaked.
I am using a weekly chart here because I can fit in three BTC cycles on the screen, but it is more clear if you look at it in the Daily chart.
I am analysing the chart by using VWAP - Volume weighted moving average.
When you place VWAP (orange line) at the peak of each cycle you can see the pattern as below:
1) The price goes down steadily from the suspected peak price but eventually breaks above the descending trendline. (please check it in daily chart).
2) The price moves and closes above the descending trendine but the upside move is limited and price gets trapped and consolidate in the sideway for a few months (blue rectangular box).
3) VWAP acts as resistance line and eventually resumes the downside move.
4) By then, all momentum indicators are deep in the bear zone, and the bear cycle begins.
When I look at weekly and daily chart, I can see the same scenario is unfolding now.
I don't think the price will go straight down from here. There are good small swing trade opportunities in lower time frame for the next few months. However, if the price struggles to move above VWAP, the end of cycle scenario becomes more and more convincing.
It is just my humble opinion based on one style of analysis.
Final note:
Bitcoin price action has been very similar to NASDAQ100 and US500, and these charts are looking very dire. If US indices go down in the the next few months, Bitcoin will go with them.

Is Bitcoin going to start rising?The latest U.S. economic data has brought significant impacts. The core PCE inflation witnessed a 0.4% month - on - month increase, hitting the highest growth in a year, with a year - on - year rise of 2.8%, exceeding market anticipations. Meanwhile, the long - term inflation expectation from the University of Michigan has soared to a 32 - year high, intensifying market concerns about inflation's resurgence. Currently, the market remains enveloped in macro - risks, pending a softening of market sentiment.
Turning to the Bitcoin market, as depicted in today's price trend (the current BTCUSDT price is $82,338.01, dropping by $2,086.37, a 2.47% decline), the K - line chart analysis indicates a downward trend. The Williams indicator signals an oversold condition. Additionally, trading volume has contracted recently, with both price and volume decreasing, suggesting a sluggish and inactive market.
Nevertheless, if Bitcoin can stabilize above $82,000 and there are signs of capital reflux, gradual position - building may be considered, with a target price set above $90,000. Investors must recognize that the Bitcoin market brims with uncertainties. Variables such as forthcoming U.S. economic data, regulatory policies, and geopolitical scenarios will all sway Bitcoin prices. In this volatile financial landscape, meticulous analysis and judicious decision - making are of utmost importance for investors navigating the Bitcoin market.
BTCUSDT
buy@82000-83000
tp:84500-86500
I will share trading signals every day. All the signals have been accurate for a whole month in a row. If you also need them, please click on the link below the article to obtain them.

U.S. Econ Shocks: Bitcoin & Profit SignalsThe latest U.S. economic data has brought significant impacts. The core PCE inflation witnessed a 0.4% month - on - month increase, hitting the highest growth in a year, with a year - on - year rise of 2.8%, exceeding market anticipations. Meanwhile, the long - term inflation expectation from the University of Michigan has soared to a 32 - year high, intensifying market concerns about inflation's resurgence. Currently, the market remains enveloped in macro - risks, pending a softening of market sentiment.
Turning to the Bitcoin market, as depicted in today's price trend (the current BTCUSDT price is $82,338.01, dropping by $2,086.37, a 2.47% decline), the K - line chart analysis indicates a downward trend. The Williams indicator signals an oversold condition. Additionally, trading volume has contracted recently, with both price and volume decreasing, suggesting a sluggish and inactive market.
Nevertheless, if Bitcoin can stabilize above $82,000 and there are signs of capital reflux, gradual position - building may be considered, with a target price set above $90,000. Investors must recognize that the Bitcoin market brims with uncertainties. Variables such as forthcoming U.S. economic data, regulatory policies, and geopolitical scenarios will all sway Bitcoin prices. In this volatile financial landscape, meticulous analysis and judicious decision - making are of utmost importance for investors navigating the Bitcoin market.
BTCUSDT
buy@82000-83000
tp:84500-86500
I will share trading signals every day. All the signals have been accurate for a whole month in a row. If you also need them, please click on the link below the article to obtain them.

Observing BTC to down for a whileBTC/USD Forming an Inverted Flag and Pole Pattern – Potential Bearish Signal
Current Market Structure:
BTC/USD is currently displaying a classic Inverted Flag and Pole pattern, which is a bearish continuation formation indicating that the market may be preparing for a downside move. This pattern typically forms after a strong downward price movement (the pole), followed by a period of consolidation or a slight upward retracement that forms the inverted flag.
1. Formation Breakdown:
Pole Formation:
The pole was formed after BTC/USD experienced a sharp decline from recent highs, characterized by strong bearish momentum and high volume.
This steep price drop signifies increased selling pressure, often triggered by a combination of profit-taking, liquidation of leveraged positions, and macroeconomic uncertainty.
Flag Formation:
Following the pole, BTC/USD has entered a consolidation phase, creating a slight upward or sideways retracement. This phase forms a channel or wedge-like pattern that slopes slightly upward or horizontally.
The flag reflects a temporary pause where buyers attempt to regain control, but the low volume and weak bullish pressure indicate a lack of conviction in sustaining the upward movement.
2. Key Characteristics to Note:
Volume Behavior:
During the pole formation, volume was significantly high, confirming strong selling interest.
In the flag phase, volume has tapered off, suggesting that the upward movement lacks the strength to reverse the previous bearish trend.
Resistance and Support Levels:
BTC is currently testing the upper boundary of the flag, near the $ resistance.
If this level holds and BTC fails to break out, a reversal towards the lower end of the flag is likely, followed by a potential breakdown.
Support to watch lies around the $ zone, which aligns with the pole’s base and a potential target for the next bearish leg.
3. Expected Market Behavior:
Bearish Continuation Likely:
If BTC breaks below the lower boundary of the flag, it is likely to resume its prior bearish trend. The next downside target is typically measured by projecting the length of the pole downward from the breakdown point, potentially bringing BTC to levels around $ .
A breakdown with strong volume confirmation would further validate this bearish move.
Invalidation Scenario:
If BTC breaks above the flag’s resistance zone with convincing volume, the bearish pattern may be invalidated, potentially leading to a retest of higher resistance levels around $ .
4. Market Sentiment and External Factors:
Macro Influences: Ongoing concerns regarding regulatory changes, interest rate hikes, and broader economic uncertainty may further weigh on BTC’s price.
Trader Behavior: Institutional selling and retail panic could accelerate the downward momentum once the pattern confirms the breakdown.
Conclusion:
BTC/USD’s current pattern suggests that a period of downside correction is likely. Traders should monitor key support and resistance levels closely, along with volume confirmation to assess the next leg of price action. A confirmed breakdown from the flag structure may signal a continuation of the bearish trend, while a breakout above resistance would invalidate the bearish setup.

Sat 29th Mar 2025 BTC/USD Daily Forex Chart Sell SetupGood morning fellow traders. On my Daily Forex charts using the High Probability & Divergence trading methods from my books, I have identified a new trade setup this morning. As usual, you can read my notes on the chart for my thoughts on this setup. The trade being a BTC/USD Sell. Enjoy the day all. Cheers. Jim
