Bear cycle begins if this happens. Not the time of buy the dipI have been thinking this Bitcoin cycle has already peaked.
I am using a weekly chart here because I can fit in three BTC cycles on the screen, but it is more clear if you look at it in the Daily chart.
I am analysing the chart by using VWAP - Volume weighted moving average.
When you place VWAP (orange line) at the peak of each cycle you can see the pattern as below:
1) The price goes down steadily from the suspected peak price but eventually breaks above the descending trendline. (please check it in daily chart).
2) The price moves and closes above the descending trendine but the upside move is limited and price gets trapped and consolidate in the sideway for a few months (blue rectangular box).
3) VWAP acts as resistance line and eventually resumes the downside move.
4) By then, all momentum indicators are deep in the bear zone, and the bear cycle begins.
When I look at weekly and daily chart, I can see the same scenario is unfolding now.
I don't think the price will go straight down from here. There are good small swing trade opportunities in lower time frame for the next few months. However, if the price struggles to move above VWAP, the end of cycle scenario becomes more and more convincing.
It is just my humble opinion based on one style of analysis.
Final note:
Bitcoin price action has been very similar to NASDAQ100 and US500, and these charts are looking very dire. If US indices go down in the the next few months, Bitcoin will go with them.
Btcusdshort

Is Bitcoin going to start rising?The latest U.S. economic data has brought significant impacts. The core PCE inflation witnessed a 0.4% month - on - month increase, hitting the highest growth in a year, with a year - on - year rise of 2.8%, exceeding market anticipations. Meanwhile, the long - term inflation expectation from the University of Michigan has soared to a 32 - year high, intensifying market concerns about inflation's resurgence. Currently, the market remains enveloped in macro - risks, pending a softening of market sentiment.
Turning to the Bitcoin market, as depicted in today's price trend (the current BTCUSDT price is $82,338.01, dropping by $2,086.37, a 2.47% decline), the K - line chart analysis indicates a downward trend. The Williams indicator signals an oversold condition. Additionally, trading volume has contracted recently, with both price and volume decreasing, suggesting a sluggish and inactive market.
Nevertheless, if Bitcoin can stabilize above $82,000 and there are signs of capital reflux, gradual position - building may be considered, with a target price set above $90,000. Investors must recognize that the Bitcoin market brims with uncertainties. Variables such as forthcoming U.S. economic data, regulatory policies, and geopolitical scenarios will all sway Bitcoin prices. In this volatile financial landscape, meticulous analysis and judicious decision - making are of utmost importance for investors navigating the Bitcoin market.
BTCUSDT
buy@82000-83000
tp:84500-86500
I will share trading signals every day. All the signals have been accurate for a whole month in a row. If you also need them, please click on the link below the article to obtain them.

U.S. Econ Shocks: Bitcoin & Profit SignalsThe latest U.S. economic data has brought significant impacts. The core PCE inflation witnessed a 0.4% month - on - month increase, hitting the highest growth in a year, with a year - on - year rise of 2.8%, exceeding market anticipations. Meanwhile, the long - term inflation expectation from the University of Michigan has soared to a 32 - year high, intensifying market concerns about inflation's resurgence. Currently, the market remains enveloped in macro - risks, pending a softening of market sentiment.
Turning to the Bitcoin market, as depicted in today's price trend (the current BTCUSDT price is $82,338.01, dropping by $2,086.37, a 2.47% decline), the K - line chart analysis indicates a downward trend. The Williams indicator signals an oversold condition. Additionally, trading volume has contracted recently, with both price and volume decreasing, suggesting a sluggish and inactive market.
Nevertheless, if Bitcoin can stabilize above $82,000 and there are signs of capital reflux, gradual position - building may be considered, with a target price set above $90,000. Investors must recognize that the Bitcoin market brims with uncertainties. Variables such as forthcoming U.S. economic data, regulatory policies, and geopolitical scenarios will all sway Bitcoin prices. In this volatile financial landscape, meticulous analysis and judicious decision - making are of utmost importance for investors navigating the Bitcoin market.
BTCUSDT
buy@82000-83000
tp:84500-86500
I will share trading signals every day. All the signals have been accurate for a whole month in a row. If you also need them, please click on the link below the article to obtain them.

Observing BTC to down for a whileBTC/USD Forming an Inverted Flag and Pole Pattern – Potential Bearish Signal
Current Market Structure:
BTC/USD is currently displaying a classic Inverted Flag and Pole pattern, which is a bearish continuation formation indicating that the market may be preparing for a downside move. This pattern typically forms after a strong downward price movement (the pole), followed by a period of consolidation or a slight upward retracement that forms the inverted flag.
1. Formation Breakdown:
Pole Formation:
The pole was formed after BTC/USD experienced a sharp decline from recent highs, characterized by strong bearish momentum and high volume.
This steep price drop signifies increased selling pressure, often triggered by a combination of profit-taking, liquidation of leveraged positions, and macroeconomic uncertainty.
Flag Formation:
Following the pole, BTC/USD has entered a consolidation phase, creating a slight upward or sideways retracement. This phase forms a channel or wedge-like pattern that slopes slightly upward or horizontally.
The flag reflects a temporary pause where buyers attempt to regain control, but the low volume and weak bullish pressure indicate a lack of conviction in sustaining the upward movement.
2. Key Characteristics to Note:
Volume Behavior:
During the pole formation, volume was significantly high, confirming strong selling interest.
In the flag phase, volume has tapered off, suggesting that the upward movement lacks the strength to reverse the previous bearish trend.
Resistance and Support Levels:
BTC is currently testing the upper boundary of the flag, near the $ resistance.
If this level holds and BTC fails to break out, a reversal towards the lower end of the flag is likely, followed by a potential breakdown.
Support to watch lies around the $ zone, which aligns with the pole’s base and a potential target for the next bearish leg.
3. Expected Market Behavior:
Bearish Continuation Likely:
If BTC breaks below the lower boundary of the flag, it is likely to resume its prior bearish trend. The next downside target is typically measured by projecting the length of the pole downward from the breakdown point, potentially bringing BTC to levels around $ .
A breakdown with strong volume confirmation would further validate this bearish move.
Invalidation Scenario:
If BTC breaks above the flag’s resistance zone with convincing volume, the bearish pattern may be invalidated, potentially leading to a retest of higher resistance levels around $ .
4. Market Sentiment and External Factors:
Macro Influences: Ongoing concerns regarding regulatory changes, interest rate hikes, and broader economic uncertainty may further weigh on BTC’s price.
Trader Behavior: Institutional selling and retail panic could accelerate the downward momentum once the pattern confirms the breakdown.
Conclusion:
BTC/USD’s current pattern suggests that a period of downside correction is likely. Traders should monitor key support and resistance levels closely, along with volume confirmation to assess the next leg of price action. A confirmed breakdown from the flag structure may signal a continuation of the bearish trend, while a breakout above resistance would invalidate the bearish setup.

Sat 29th Mar 2025 BTC/USD Daily Forex Chart Sell SetupGood morning fellow traders. On my Daily Forex charts using the High Probability & Divergence trading methods from my books, I have identified a new trade setup this morning. As usual, you can read my notes on the chart for my thoughts on this setup. The trade being a BTC/USD Sell. Enjoy the day all. Cheers. Jim

Bitcoin Weekly Forecast | Rising Wedge Breakdown & Bearish MoveIntroduction
This Bitcoin (BTC/USD) 1-Day Chart Analysis highlights a critical market development: the breakdown of a Rising Wedge pattern, signaling a potential bearish trend. After reaching a new all-time high (ATH) resistance, BTC has shown weakness, confirming a possible reversal. This analysis covers key levels, trend structure, trading setups, and market psychology for traders looking to capitalize on this move.
1️⃣ Understanding the Chart Structure
Rising Wedge Pattern – A Classic Bearish Reversal
A Rising Wedge is a bearish technical formation that develops when prices rise within a narrowing range. It typically features:
✅ Higher Highs & Higher Lows: Suggesting bullish momentum, but the price action becomes weaker over time.
✅ Converging Trendlines: Showing a loss of buyer strength as each rally fails to make significant new highs.
✅ Volume Decline: As the wedge matures, volume decreases, confirming reduced buying interest.
✅ Breakdown Confirmation: A sharp drop below the lower trendline validates the bearish move.
In this case, BTC followed all the classic wedge characteristics, and its breakdown has initiated a potential major correction.
2️⃣ Key Levels & Market Dynamics
🔵 Resistance Level + All-Time High (ATH) (~$110K-$115K)
BTC reached its ATH resistance zone but failed to hold above it.
The red arrow indicates the rejection at the top, where strong selling pressure emerged.
Bulls attempted multiple breakouts but failed, leading to a reversal.
🟢 Support Zone (~$78K-$80K) – Weak Retest Before Breakdown
The price initially bounced off this support but struggled to hold gains.
The blue support level highlights a key zone where BTC found temporary stability.
A weak rally followed, but the price got rejected again, confirming the bearish trend.
🔻 Major Bearish Target (~$48,920)
Using the measured move theory, the projected drop extends to $48,920, a strong historical support.
The black arrow points to the expected downward trajectory.
3️⃣ Trading Setup & Risk Management
🔽 Bearish Trade Setup (Short Position Strategy)
For traders looking to short BTC based on this pattern, here’s an optimal trade setup:
🔸 Entry Point: Around $85K-$90K (post-retest of breakdown)
🔸 Stop Loss: Above $100K (invalidation of the bearish setup)
🔸 Take Profit Targets:
TP1: $75K (minor support)
TP2: $60K (psychological level)
TP3: $48,920 (final bearish target)
Alternative Scenario – Bullish Recovery?
If BTC reclaims $100K+ with high volume, the bearish thesis is invalidated, signaling a continuation of the uptrend.
A break above ATH ($115K) would confirm new bullish strength.
4️⃣ Market Sentiment & Psychological Factors
📉 Bearish Sentiment Strengthens:
Rising Wedges often cause a bull trap, where buyers expect new highs but get caught in a reversal.
Current price action suggests sellers are gaining control.
⚠️ Key Risks for Traders:
False breakdowns can occur if BTC sees unexpected bullish news.
Keeping an eye on fundamental developments (ETF approvals, macroeconomic conditions, etc.) is essential.
Conclusion – BTC Heading for a Deeper Correction?
Bitcoin’s Rising Wedge breakdown strongly suggests a continued bearish trend.
Short opportunities are ideal below $90K, with downside targets near GETTEX:48K -$50K.
If BTC regains $100K+, bearish outlook is invalid.
📊 Trading Recommendation: Monitor price action closely and adjust risk management accordingly!
Would you like me to tweak any part of this analysis? 😊

Bitcoin (BTC/USD) Trading Analysis – Rectangle Pattern Breakdown1. Market Overview
The BTC/USD chart (1-hour timeframe) illustrates a trendline-supported uptrend that eventually transitioned into a rectangle consolidation pattern before breaking downward. The market displayed signs of buyer exhaustion near the resistance level, leading to a rectangle pattern breakdown, confirming a bearish shift.
This analysis will break down the chart structure, key technical levels, potential trade setups, and risk management strategies for traders looking to capitalize on this move.
2. Breakdown of the Chart Structure
A. Trendline Breakout & Shift in Market Sentiment
The chart initially exhibits an ascending trendline, acting as dynamic support for Bitcoin’s price.
As long as BTC/USD remained above this trendline, the uptrend was intact.
However, once the price broke below the trendline with strong bearish momentum, it signaled a significant shift in sentiment from bullish to bearish.
The breakdown of the trendline also coincided with the rectangle’s lower boundary breakdown, confirming bearish strength.
B. Rectangle Pattern Formation (Consolidation Phase)
The price oscillated between resistance at $88,500 and support at $86,000, forming a rectangle consolidation pattern.
This pattern reflects a period of market indecision where buyers and sellers are in equilibrium.
Multiple failed breakout attempts at resistance signaled strong seller dominance, leading to eventual support failure.
The rectangle breakdown suggests that bears have gained control and a downward move is likely.
C. Breakdown Confirmation & Target Projection
The price broke below the lower support of the rectangle ($86,000) with increased selling pressure.
The bearish breakout was confirmed by strong red candles with high volume, reinforcing the downside move.
The height of the rectangle pattern provides a measured move target of around $83,797, aligning with previous support.
The momentum remains bearish, and price is likely to test this level before any reversal attempt.
3. Trade Setup & Risk Management
A. Ideal Trade Entry
Entry Point: After the price retested the broken rectangle support at $86,000, which now acts as resistance.
Confirmation: The rejection from this resistance with a bearish engulfing candle confirmed further downside.
Bearish momentum indicators, such as RSI and MACD crossovers, further validated the setup.
B. Stop-Loss Placement (Risk Management Strategy)
Stop Loss: Placed above the previous resistance zone at $88,969 to protect against false breakouts.
Rationale: If price moves back into the rectangle and surpasses resistance, the bearish setup becomes invalid.
C. Take-Profit Target & Risk-to-Reward Ratio
Target: $83,797, based on the rectangle pattern height projection and key support levels.
Risk-to-Reward Ratio: The setup offers a favorable risk-to-reward ratio, ensuring that potential gains outweigh potential losses.
4. Market Sentiment & Future Outlook
A. Bearish Continuation Outlook
The trendline failure, rectangle breakdown, and bearish candlestick patterns all suggest a continuation of the downtrend.
If price fails to reclaim support-turned-resistance ($86,000), further downside is expected.
Increased selling volume confirms bearish control.
B. Possible Bullish Reversal Scenarios
If BTC/USD bounces strongly from the $83,797 target zone, it could indicate buyer accumulation and lead to a bullish recovery.
A move back above $86,000 would invalidate the bearish outlook.
5. Conclusion
This BTC/USD analysis highlights a bearish rectangle pattern breakdown, reinforced by a trendline break and strong resistance rejections at $88,500. The breakout target is $83,797, where traders should monitor price action for further bearish continuation or potential reversal signs.
Traders should approach with caution, set appropriate stop-loss levels, and follow volume trends for confirmation of further price movements.

Bitcoin Nears Breakout: Can Bulls Push Past $89K?Currently, the key support level for the price of Bitcoin is around $86,000. This level has played a supporting role several times in the recent price fluctuations. If the price can hold this position, it will provide strong support for subsequent upward movements. The key resistance level above is at $89,000. If the price of Bitcoin can break through and firmly stand above this resistance level, it is highly likely to initiate a new round of upward market; if it fails to break through, the price may continue to experience small - scale oscillatory rebounds within the current range.
From a technical indicator perspective, the moving average indicates that Bitcoin has a short - term upward trend. The price has broken through the area where the signal line is located, indicating that the pressure from "digital gold" buyers is relatively high, and the asset value is likely to continue the upward momentum from the current level. However, the MACD indicator experienced a bearish crossover at the beginning of this week. Although the signal line is currently downward, the MACD line has started to move upward. Nevertheless, a trend reversal is unlikely to occur in the short term. In terms of the Relative Strength Index (RSI), this indicator has moved out of the oversold area and is currently in the neutral zone, indicating that the seller's market may have ended. The price of Bitcoin is expected to maintain its current position and may further rise within the next 5 - 7 days.
BTCUSDT
buy@86000-86500
tp:87500-88500
I will share trading signals every day. All the signals have been accurate for a whole month in a row. If you also need them, please click on the link below the article to obtain them.

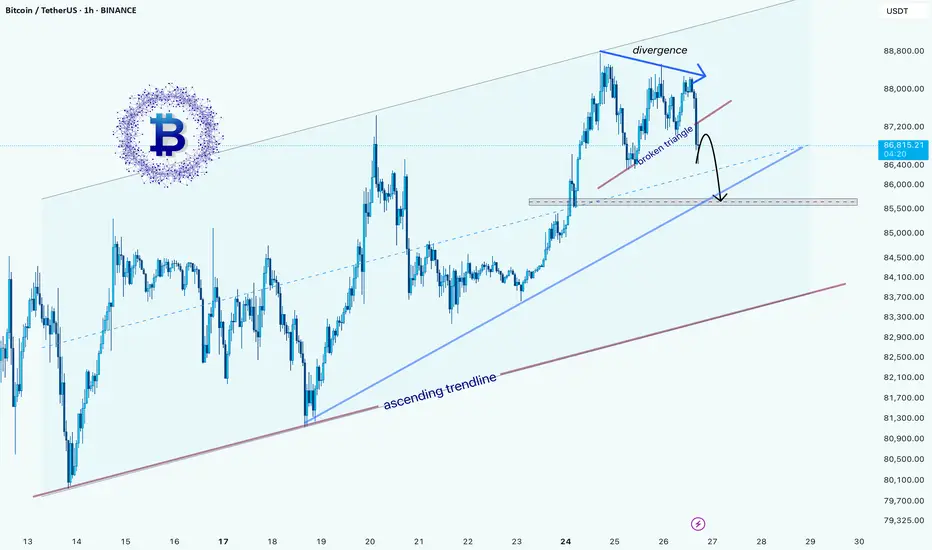
Bitcoin Price Analysis: Potential Correction Ahead?hello guys
The Bitcoin/USDT chart shows an ascending channel with recent price action forming a divergence at the top, indicating potential weakening momentum. A bearish breakout from a smaller triangle suggests a short-term correction. The price may test the ascending trendline around $85,400, where a key support zone exists. If this level fails, a deeper correction toward the major support area around $76,800 could follow. However, if Bitcoin holds above the trendline, the uptrend could resume.
Traders should watch price action around the $85,400 level for confirmation of further downside or a potential bounce.
Bitcoin’s Next Move: Falling to $79K?This detailed technical analysis of Bitcoin (BTC/USD) on the 1-hour timeframe highlights a Rising Wedge pattern, key support and resistance levels, a trade setup, and projected price movements. The chart suggests a bearish breakdown, and traders can use this analysis to make informed decisions.
1. Understanding the Chart Pattern – Rising Wedge Formation
A Rising Wedge is a bearish reversal pattern that occurs when the price moves upwards within two converging trendlines. The slope of the lower trendline is steeper than the upper trendline, indicating weaker bullish momentum and an increasing probability of a downside breakdown.
📌 Key Observations:
The black solid trendlines outline the wedge pattern.
The price action remained inside this wedge from March 11 to March 26, 2025.
A breakdown has now occurred, confirming bearish momentum.
🔺 Why is this Bearish?
Rising Wedges are considered distribution patterns, meaning buyers are losing strength, and sellers are gradually taking control.
The price fails to make aggressive new highs and instead grinds upward weakly.
Once support is broken, a strong sell-off usually follows.
2. Key Chart Levels – Support & Resistance Zones
🔵 Resistance Level (Upper Bound of Wedge & Supply Zone)
The red arrow marks a strong rejection at $88,500 - $89,000, which acted as a major resistance level.
This zone has seen multiple failed breakout attempts, signaling that sellers dominate this area.
Stop-losses for short trades should be placed above this resistance zone.
🟢 Support Level (Lower Bound of Wedge & Demand Zone)
The wedge's lower boundary previously acted as strong support until it was breached.
The blue highlighted box represents a demand zone around $81,000, where buyers previously stepped in.
Losing this level could trigger a much stronger bearish move.
3. Breakdown Confirmation & Trading Setup
With the wedge broken to the downside, we now look for a confirmed bearish setup to enter a trade.
📉 Bearish Confirmation:
✅ The price broke below the wedge’s lower boundary, signaling a reversal.
✅ A retest of the broken wedge trendline confirms the breakdown.
✅ The price is now showing lower highs and lower lows, indicating a new bearish trend.
🎯 Trade Setup – How to Play This Move?
🔴 Entry for Short Position:
Enter short between $86,900 - $87,200 after confirming a rejection at the broken trendline.
🔵 Stop Loss:
Place a stop-loss above $89,282 to protect against a fakeout.
If BTC closes back inside the wedge, the short setup is invalidated.
🟢 Target 1: $81,000 – This is a key demand zone, and price might temporarily bounce here.
🟢 Target 2: $79,031 – This is the next strong support level, making it a final bearish target.
⚠ Risk Management Note:
Adjust position size based on risk tolerance.
Be mindful of short squeezes (where price temporarily spikes before continuing lower).
4. Expected Price Movement – Bearish Projection
🔮 The dashed black lines on the chart indicate a likely price pathway:
1️⃣ A breakdown below the wedge, followed by a minor retest of the broken trendline.
2️⃣ A continuation toward $81,000 (support level).
3️⃣ A small bounce before further decline.
4️⃣ The price reaching the final target of $79,031, where buyers may start accumulating again.
📌 If Bitcoin breaks below $81,000 with high volume, the bearish trend will likely accelerate.
5. Market Psychology & Trading Strategy
📌 Why This Setup Makes Sense?
The market exhibited exhaustion at the top of the wedge.
The break-and-retest confirms seller dominance.
The lower highs & lower lows show bearish momentum.
🚀 Alternative Bullish Scenario?
If BTC reclaims the wedge and breaks above $89,000, then the bearish setup is invalid.
A close above $89,500 would signal strong buying pressure and potential bullish continuation.
6. Conclusion – What to Watch Next?
🔎 Key Points to Monitor:
✔ Retest & rejection at $87,000 – $88,000 (confirming bearish momentum).
✔ Break of $81,000 to signal continuation toward the target.
✔ Stop-loss protection above $89,000 to manage risk.
📊 Final Thoughts:
The Rising Wedge breakdown suggests a shift from bullish to bearish sentiment.
This is a high-probability short trade with well-defined entry, stop-loss, and targets.
Traders should wait for price action confirmation before entering trades.
Would you like any refinements, or do you need further trade ideas? 🚀📉

BTCUSD strategy discussionWe suggest that you observe more and trade less. Keep doing so until it shows a definite breakout direction.

BTC's Bull Run: Profit Realized, Resistance AheadCurrently, BTC is hovering around $88,000. We had already achieved our profit target yesterday. Ever since BTC broke through the $85,000 mark, it has been rising continuously. The market is in a bullish - dominated trend, with strong buying power driving the price up steadily. Although it's in an uptrend, there's uncertainty about its future movement as it hasn't broken through the $89,000 - $90,000 resistance range. If it fails to break through this resistance zone effectively, the price may decline again eventually.
I will share trading signals every day. All the signals have been accurate for a whole month in a row. If you also need them, please click on the link below the article to obtain them.

BTC/USD Rising Wedge – Bearish Breakdown Ahead?Introduction: Understanding the Market Structure
This Bitcoin (BTC/USD) 4-hour chart presents a technical setup with a mix of bullish and bearish formations. The analysis focuses on key support and resistance zones, trendlines, and chart patterns to determine the next possible move.
🔍 The key takeaway? BTC has formed a Rising Wedge, a bearish reversal pattern, signaling potential downside unless a breakout invalidates the setup.
1. Market Structure & Current Trend Analysis
📌 Market in Curve Formation – The Accumulation Phase
Before the recent rally, Bitcoin was in a downtrend, making lower lows and lower highs, suggesting a period of price weakness.
However, price found strong support at around $77,600 - $80,000, forming a curved bottom structure—an early signal of an accumulation phase.
This bottoming pattern transitioned into a bullish uptrend, leading to the formation of a rising wedge.
🔹 Key Observations:
✔ Accumulation near $77,600 created a base for buyers.
✔ The gradual recovery curve suggests a shift from bearish to bullish momentum.
✔ Bitcoin later formed higher lows, confirming a temporary uptrend.
⚠ Shift in Momentum – The Rising Wedge Appears
The price rallied from the support zone but started forming a Rising Wedge pattern, which is typically a bearish signal.
A rising wedge indicates that although buyers are pushing prices up, they are losing momentum.
The narrowing price range suggests that sellers are entering at higher levels, weakening bullish strength.
2. Key Technical Levels to Watch
🔵 Resistance Zone ($92,000 - $94,957)
The shaded area near $92,000 - $94,957 is a major resistance level, where BTC previously failed to sustain a breakout.
This supply zone has been tested multiple times, reinforcing its strength.
The Stop Loss for short positions is placed above $94,957—any breakout above this level would invalidate the bearish setup.
🟠 Support Zone ($77,600 - $80,000)
The strong demand zone between $77,600 - $80,000 aligns with previous support levels.
If the rising wedge breaks down, this is the first major price target where BTC could find support.
A strong breakdown below $77,600 could lead to further declines toward $75,000 or lower.
3. The Rising Wedge Pattern – Bearish Warning!
🔍 What is a Rising Wedge?
A Rising Wedge is a bearish reversal pattern that forms during an uptrend when price moves within two converging trendlines.
It indicates that buyers are losing strength, and sellers are preparing to take control.
Once the lower trendline breaks, it confirms bearish momentum, leading to a price drop.
📝 Current BTC/USD Rising Wedge Analysis:
BTC has formed higher highs and higher lows, but the price range is narrowing.
The lower trendline is critical—a breakdown below this level could trigger a sharp decline.
The bearish target aligns with the support zone near $77,600.
4. Trading Plan – Possible Scenarios
📉 Bearish Breakdown Scenario (High Probability)
✅ Entry: Short BTC if the price breaks below the rising wedge (~$86,000 - $85,500).
✅ Stop Loss: Above $94,957 to protect against invalidation.
✅ Take Profit Target: $77,600 - $80,000 (first support level).
✅ Extended Target: If BTC drops below $77,600, watch for $75,000 - $72,000.
✅ Risk-Reward Ratio: Ideally 1:3 or higher for optimal trade management.
📈 Bullish Breakout Scenario (Low Probability but Possible!)
If BTC breaks and closes above $94,957, the bearish setup becomes invalid.
A confirmed breakout above resistance could push BTC towards $98,000 - $100,000.
Traders should wait for volume confirmation before entering long positions.
5. Risk Management & Final Thoughts
⚠ Risk Factors to Consider:
If BTC breaks the wedge with low volume, the move might be a false breakdown.
Macroeconomic events, such as interest rate decisions, can influence price behavior.
Watch for bullish divergences in indicators like RSI or MACD before shorting aggressively.
🔎 Conclusion:
The Rising Wedge pattern suggests a bearish reversal—a breakdown could send BTC toward $77,600.
Traders should wait for confirmation before entering trades.
If BTC breaks above $94,957, a bullish continuation could push it toward $100,000.
🔥 Bearish Bias Until Breakdown Confirmation!
Would you like an indicator-based analysis (e.g., RSI, MACD, or Moving Averages)? 🚀

BTCUSD:BTCUSD: SHORT, TP86600-85600BTCUSD now has an obvious double-head pattern, and the short opportunity is worth a try. There is support near 86600, followed by 85800. These can be used as two targets. If the support is strong during the fluctuation process, the order can be closed in advance.

BTC/USDT:Pay attention to the resistance zone.BTC fluctuated within the forecast and reached the profit point. However, the 88K-89K resistance area needs to be watched, and if it cannot be effectively broken this week, then it will fall
This week, the BTC trading strategy was completely correct and the account made more than 200% profit in two weeks
We share various trading signals every day with over 90% accuracy
Fans who follow us can get high rewards every day
If you want stable income,You can follow the link below this article

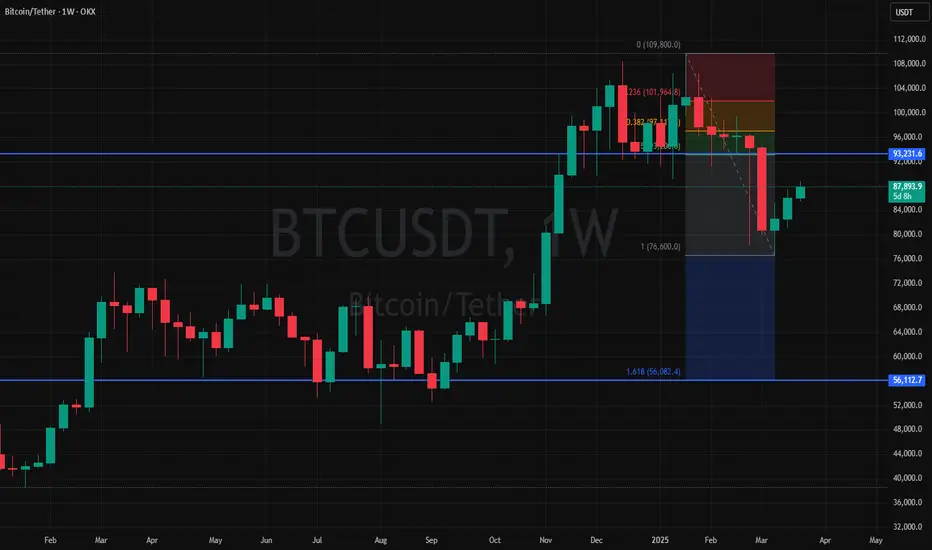
Title: Bitcoin Targeting $56,000? Fibonacci Shows the Way!
On a specific timeframe, it’s clear that the 50% retracement level from Fibonacci has not been tested yet. By applying the Fibonacci retracement tool to the recent downward impulse, we can see that after testing this level, Bitcoin could potentially move toward the 161% extension, which aligns with a target of $56,000 per BTC.
The price dropped impulsively, yet the recovery has been slow and weak. However, in my opinion, this target remains achievable. What do you think? Will Bitcoin reach this level? Share your thoughts in the comments!
BTCUSD:Wait for a rebound before going shortThe fluctuations are not big now, judging from the structure of the 30M icon. The probability of rebounding and then falling later is relatively high. My trading idea is to wait for the rebound to go short. The short orders entered near 88K yesterday are now generally profitable. They can be closed first and then entered after the rebound to prevent the price from rising directly.
Losing profits is a trivial matter, but turning from profit to loss would be very uneconomical.

Bitcoin (BTC/USD) – Rising Wedge Breakdown & Trading Setup 📊 Chart Overview & Market Context
The provided chart represents Bitcoin's (BTC/USD) price movement on the 1-hour (H1) timeframe, highlighting a Rising Wedge pattern. This pattern is generally bearish and signals a potential reversal or breakdown.
Over the past few trading sessions, BTC has been moving inside an ascending wedge formation, making higher highs and higher lows. However, this movement is narrowing, indicating weakening bullish momentum. As BTC approaches a critical resistance level, sellers appear to be gaining control, increasing the likelihood of a sharp decline.
This chart outlines a well-structured bearish trading setup, identifying key areas of resistance, support, stop-loss placement, and potential downside targets.
📌 Technical Analysis & Key Levels
🔹 1. Chart Pattern: Rising Wedge (Bearish Reversal Signal)
A Rising Wedge is a technical pattern characterized by:
✔ Two upward-sloping trendlines, converging over time.
✔ Diminishing bullish momentum, as higher highs become weaker.
✔ Breakdown expectation, where price typically falls below the lower support trendline.
📉 Why is this pattern important?
The rising wedge signals that buyers are losing strength and that a reversal is likely.
When price breaks below the lower boundary, selling pressure increases, leading to a strong downward move.
Traders often anticipate a breakdown from this pattern to enter short positions.
🔹 2. Resistance Level (Key Rejection Zone)
📌 Zone: 88,500 - 89,500 USD
This area has acted as a strong resistance, preventing further upside movement.
Sellers stepped in, causing the price to reject and start declining.
A confirmed rejection from this level adds bearish confluence to the setup.
🔹 3. Rising Wedge Support (Breakdown Level)
📌 Zone: 85,000 - 84,500 USD
This is the lower boundary of the wedge pattern.
If BTC closes below this level with strong volume, it confirms the breakdown.
A retest of this level as resistance after a breakdown would provide an ideal short entry.
🔹 4. Key Support Levels & Bearish Targets
Once BTC breaks down, the next areas of interest are:
📌 First Bearish Target: 80,500 - 79,500 USD
A previous demand zone where buyers previously pushed prices higher.
BTC could pause here before continuing lower.
📌 Final Target (Full Breakdown Projection): 76,802 USD
If the wedge pattern fully plays out, BTC could drop toward this level.
This aligns with a major historical support zone, where significant buying interest could emerge.
🔹 5. Stop-Loss & Risk Management
📌 Stop-Loss: 90,483 USD
If BTC moves above this level, it invalidates the bearish setup.
Keeping a tight stop-loss ensures controlled risk while maximizing potential rewards.
📉 Trading Plan: How to Trade This Setup?
✅ Short Entry Strategy:
Enter a short trade once BTC breaks below 85,000 USD, confirming the wedge breakdown.
If BTC retests the broken support (now resistance), it offers a second entry opportunity.
✅ Stop-Loss Placement:
Place a stop-loss above 90,483 USD, in case of a bullish breakout.
✅ Take-Profit Levels:
First Target: 80,500 - 79,500 USD (Support zone)
Final Target: 76,802 USD (Full wedge breakdown projection)
📌 Key Takeaways & Market Sentiment
🔸 Bearish Structure Formation: BTC is losing momentum inside a rising wedge, signaling a potential downturn.
🔸 Breakdown Confirmation Needed: A close below 85,000 USD with volume confirms the bearish trade setup.
🔸 Risk Management is Key: The stop-loss above 90,483 USD protects against invalidation.
🔸 Watch for Retests: If BTC retests the breakdown level, it can provide an ideal entry point.
🚨 Bitcoin is showing early signs of a bearish reversal! If the rising wedge breaks down, a significant decline toward 76,802 USD could follow. Traders should monitor price action carefully and execute the setup accordingly. 🚀

BTC Today's strategyYesterday's chart already shows an upward channel for BTC, let's continue to hit the resistance area of 88K-89K
btcusdt buy@85.5K-86K
tp:88K-89K
We share various trading signals every day with over 90% accuracy
Fans who follow us can get high rewards every day
If you want stable income, you can contact me

BTCUSD LOOKING MORE BULLISH market take sell side liquidity now going for kill buy side liquidity .we have fvg in daily tf we will use confirmation in daily fvg

Whether BTC can reach 90KWhether BTC can reach 90K
Our strategy has made a profit and now BTC is testing the 88K resistance, let's see if we can break it today

Each wave around 87K is the moment we buyEach wave around 87K is the moment we buy
btcusdt buy@87K-87.5K
tp:88.5K-89K
We share various trading signals every day with over 90% accuracy.
Fans who follow us can get high rewards every day
If you want stable income, you can contact me.

BTC Today's strategyHi guys, it's a new week and the charts show it's moving up the channel
Looking back on the trading strategy we developed last week, we were undoubtedly successful. Now that the price has exceeded 87K, we still need to pay attention to the resistance of 88K, as it is the determinant of whether the upside can be
btcusdt buy@84.5K-85K
tp:87.5K-88K
We share various trading signals every day with over 90% accuracy.
Fans who follow us can get high rewards every day
If you want stable income, you can contact me.
