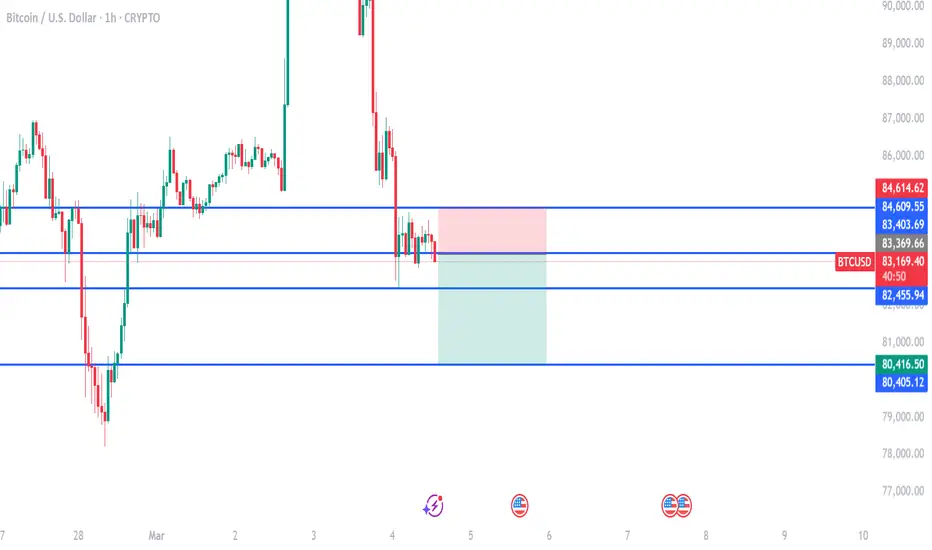
BTC Today's strategyThe balance of long and short power in the market suggests that there may be explosive movements in the short term. At present, the price of Bitcoin is fluctuating in the range of 82,000-85,000 US dollars, and the short-term resistance is at 86,000 US dollars. A break through 86,000 US dollars could trigger a new round of gains
Bitcoin ETF funds have seen net outflows for five consecutive weeks, with demand falling to the lowest level in 2025, indicating that institutional funds are withdrawing and market sentiment is turning cautious. However, institutions such as MicroStrategy continue to buy, providing some support for bitcoin prices
The market is worried about the risk of possible liquidity tightening before the FOMC meeting in March, the uncertainty of the global economic situation and the signs of monetary policy adjustment in some major economies, making traditional financial marekts more attractive, and there is a trend of capital flowing back from the cryptocurrency market to the traditional financial field, which has some pressure on the bitcoin price
btcusdt sell@85500-86500
tp:83K-81K
We will share various trading signals every day. Fans who follow us can get high returns every day. If you want stable profits, you can contact me.
Btcusdshort

BTC/USDT Trade Setup & Analysis – Key Support Bounce & TargetsSupport: The lower purple zone indicates a strong support level where the price has bounced.
Resistance: The upper purple zone marks a resistance area where price has been rejected multiple times.
2. Moving Averages:
200 EMA (Blue): At 82,800.42, acting as dynamic resistance.
30 EMA (Red): At 82,090.72, indicating short-term trend direction.
3. Trade Setup:
A long position is planned from the current support level.
Entry: Around 80,026.98 (near support).
Stop Loss: Around 76,980.09 (below support).
Take Profit Targets:
TP1: 81,636.34
TP2: 82,800.42 (near 200 EMA)
TP3: 84,481.83
TP4: 86,260.26
Final Target: 88,297.36
4. Conclusion:
The setup expects a bounce from support with a target back towards resistance levels.
Breaking 82,800 (200 EMA) is crucial for further bullish momentum.
If the price falls below 80,000, the setup might get invalidated.
Would you like a deeper breakdown on any part? 🚀

btcusd on bearish retrace#BTCUSD price have multiple retest below 81k, now we await for next double rejection to sell.
If price touch 84200 then bearish retracment is active which will drop the price till 81k. Stop loss at 85196.
Above 85196 have bullish breakout which forms new buy to reach 88k-90k limit.

BTC Today's strategyIndustry News: Japanese listed company Metaplanet increased its holdings of 162 BTC, which to some extent reflects institutional optimism towards Bitcoin, and may have a positive impact on market sentiment, attracting more investors to pay attention and buy. However, Bitcoin's real-world application is still relatively limited, and its fundamentals are still relatively weak, which may limit the price of Bitcoin in the long run.
From the supply side, after bitcoin hit its highest price in history, short-term holders (STH) increased their holdings, while long-term holders (LTH) decreased their holdings. This change in supply pattern reflects the growing speculative atmosphere in the market, and short-term traders are more sensitive to price fluctuations, which may lead to increased volatility in bitcoin prices. From the demand side, despite the continued increase in bitcoin holdings by institutional buyers and ETFs, actual spot demand continues to decline. If demand does not recover, bitcoin's continued rally may be difficult to maintain.
Overall, the price of Bitcoin on March 14, 2025 is currently showing a certain upward trend, but the overall trend is still facing many uncertainties. A variety of factors such as the macroeconomic environment, the Federal Reserve's monetary policy, industry dynamics, and market supply and demand are all having an impact on the trend of Bitcoin.
buy:77K-79K
tp:83K-85k
We will share various trading signals every day. Fans who follow us can get high returns every day. If you want stable profits, you can contact me.

BTCUSD buy signal. Don't forget about stop-loss.
Write in the comments all your questions and instruments analysis of which you want to see.
Friends, push the like button, write a comment, and share with your mates - that would be the best THANK YOU.
P.S. I personally will open entry if the price will show it according to my strategy.
Always make your analysis before a trade

Sweet Spot To Sell The BTC Pullback In a strong downtrend. Every pullback on the 4hr and Daily chart will be hyped by the bulls & super cycle evangelists as a "WE'RE BACK" moment.
I will continue to take this same setup, selling Major swing highs on 4HR & Daily chart on BTC until the Daily Chart flips bullish. Until then or some news come out, we will remain in the downtrend until we hit the target shown in my last analysis, see link below.

BTC | 4H - 1W | MACRO UpdateBTC has seen a clear bearish trend in the 4h timeframe, after the cup and handle pattern failed to play out. We also notice consecutive lower lows and lower highs, a key sign of a bearish trend.
The technical indicators have turned bearish, and from a macro timeframe is shows a stairstep down may be on the cards.
The moving averages in the daily has turned bearish as we lose the 200d MA.
I hate to say it - but BTC is in full fledge bear mode 🐻
________________
BINANCE:BTCUSDT

There are no failed investments, only failed operationsI. Trend analysis
🔹 overall trends:
Since the beginning of 2024, Bitcoin has experienced a clear upward trend, peaking at nearly $115,000.
The price has recently fallen below several key support levels and entered a downward trend, with prices testing support in the 80,000-85,000 range.
The short-term trend remains weak, and the market may continue to seek lower support levels.
🔹 moving average system:
The short-term moving average (red, 10th) indicating that the market is still dominated by short-term bears.
The long-term moving average (blue, 60 days) has also started to turn downward, suggesting a weakening of the medium-term trend.
Conclusion: The market is still in a downward trend, and the moving average system shows no obvious signs of stabilization.
Structural analysis (K-line morphology)
📌 head and shoulders may have been completed:
From the high level formed by 93,000 to 115,000, there is a more obvious head and shoulder structure, which is currently falling below the neckline (82,000) and accelerating the decline.
If this pattern holds, the target decline level may test the 77,000-80,000 area.
📌 M head shape:
The previous two highs (around 100,000) formed an M-head and fell below key support, remaining weak in the short term.
📌 support area:
77000 (important support, if broken, the medium-term trend may accelerate to short)
72000~ 75000 (target in extreme cases)
📌 resistance areas:
89000~ 90000 (early neckline, has turned to strong resistance)
93000 (if the market rebounds, it needs to break through this level to reverse the trend)

Bitcoin Collapses $80K, What’s Next?Its price briefly stabilized around $86K over the weekend before heading south at the start of the business week. It dropped to around $80K, leaving millions in liquidations on a 24-hour basis. Later, bulls stepped in and pushed the valuation to nearly $84K. The resurgence, however, was short-lived and was followed by another free fall to as low as $79,500. As of this writing, BTC is trading around $79,000, representing a 5% drop on the day. Its market cap dropped below $1.6 trillion.
While many industry players are hopeful that this is another temporary pullback that can be replaced by a new bull run, others are not so optimistic. Next up is a re-estimation of $78K for BTCUSD, “if that fails, the next $76300, 75,500 in the crosshairs.” BINANCE:BTCUSDT BITSTAMP:BTCUSD COINBASE:BTCUSD BYBIT:BTCUSDT.P

BTCUSD , 4H I see a short oppotunity on BITCOIN
1.The break and retest of an HEAD & SHOULDER pattern
2.TakeProfit at the psycological level 84000.00

The bitcoin will continue decreaseOn the monthly chart it is visible that the turning figure was created. MACD shows divergence, other technical indicators it confirm. I expect decrease the price at least up to 0.5 according to Fibonacci - the purpose for me 62800.
Information provided is only educational and should not be used to take action in the market.

Bitcoin bearish move to 81/80K ?There is a potential incoming bearish move on the 4 hour chart
Stop loss: 87500
Take profit : Around 81k

BTC/USD Ready for a BIG DROP? Next Target: Demand Zone!Bitcoin Showing Weakness – Smart Money Preparing a Move!
BTC/USD is struggling to hold key resistance levels, signaling potential distribution before a larger sell-off. Institutional players have grabbed liquidity, and a Break of Structure (BOS) to the downside confirms bearish momentum.

BTCThe price hit the previous high before falling, in my opinion this blue trend break is fake and the price will hit a new high after small corrections.

BTC/USD Daily Forecast – Sell Setup from Supply Zone🔍 Market Breakdown Analysis:
Bitcoin has broken the key demand zone, indicating potential bearish momentum. As price pulls back, we will be looking for sell opportunities from the supply zone based on institutional order flow.
🎯 Trade Plan:
✅ Entry Zone: Supply Zone (Decision Point)
✅ Target 1: Key Structural Level (Decision Point Zone)
✅ Target 2: Extreme Order Block (Deeper Liquidity Grab)
✅ Confluence Factors: BOS (Break of Structure) + Liquidity Sweep
📊 Technical Outlook:
🔹 Market structure shift confirms a bearish bias.
🔹 Price may retest the supply zone before continuing downward.
🔹 Smart Money Concepts (SMC) suggest a high-probability short setup.
⚠️ Risk Management:
Always use a proper stop-loss and follow your trading plan. Stay disciplined and patient for the best entry.
💬 Drop your thoughts below! Are you bearish or bullish on BTC/USD? 👇🔥

Today btcusd analyisBitcoin Price Trend Analysis (30-Min Chart)
Current Price: 92,005 USD
1. Key Levels & Distances
Resistance Zone: 94,000 USD (+1,995 USD from current price)
Support Zone: 91,500 USD (-505 USD from current price)
Major Support: 90,000 USD (-2,005 USD from current price)
2. Trend Analysis & Possible Scenarios
Bullish Scenario (Uptrend)
If the price maintains support above 91,500 USD and breaks 94,000 USD, it could push higher toward 95,000 USD or more.
Confirmation of higher highs and higher lows will strengthen bullish momentum.
Bearish Scenario (Downtrend)
If the price fails to break 94,000 USD and drops below 91,500 USD, a correction towards 90,000 USD is possible.
Breaking below 90,000 USD could indicate a larger downtrend.
---
3. Trading Strategy Insights
For Buyers (Long Positions):
Look for a breakout above 94,000 USD before entering.
A stop-loss around 91,500 USD.
Target profit at 95,000+ USD.
For Sellers (Short Positions):
If price rejects 94,000 USD, short entries below 91,500 USD could be considered.
Stop-loss near 92,500 USD.
Profit target around 90,000 USD.

btc on bearish#BTCUSD price retrace back 95k which results in a failed bullish strength, now back at 83500.
Firstly we wait for breakout below 83400 to sell, take profit 82300-80400, stop loss 84600.
Above 84600 on double breakout have a strong bullish to recorrect 88k to 90k limit.
Bitcoin / TetherUS
Hello and greetings to dear companions!
This is an updated analysis of Bitcoin. Based on the discussions we've had and the previous analysis we conducted for the entire crypto market, we have observed that Bitcoin has reached the bottom of its daily channel after a severe decline! Now, we expect Bitcoin to reach the $105,000 range, similar to our previous analysis, and then either retrace or rise, which we can support with confirmation.
Our previous scenario remains intact, and our target range is still valid, as we have excellent daily liquidity. In terms of price analysis, $102,500 is the level that convinces buyers that Bitcoin is bullish, leading them to enter buy positions. Sellers, upon seeing this decline, are looking to exit, and we will likely see market consolidation around this level until we determine the winner of this confrontation.
I will elaborate on the analysis. Our current scenario is primarily based on ideal selling conditions.
In the specified range, we will exit the market and wait for the market to make its decision.
Based on this analysis, if our trend line breaks, we will swiftly take action to sell, as this serves as a very strong confirmation of the fake rally, and we will likely see further declines!
We are preparing to observe the market reaction at the price of $73,000 with confirmation and act to capture an excellent swing.
Key Points
Resistance (Daily): 102500
Support (Daily): 69388
Ideal Time to Sell with Confirmation: 105250 & 109588
Wishing you all success!
Fereydoon Bahrami
A retail trader in the Wall Street Trading Center (Forex)
Risk Disclosure:
Trading in the cryptocurrency market is risky due to high price volatility. This analysis is solely my personal opinion and should not be considered financial advice. Please do your own research. You are responsible for any profits or losses resulting from this analysis.

Bitcoin (BTC/USD) Technical Analysis – Daily Timeframe Bitcoin (BTC/USD) Technical Analysis – Daily Timeframe
This chart presents a technical breakdown of Bitcoin (BTC/USD) using supply and demand zones to anticipate potential price movements. It reflects a bearish bias as price action shows rejection from the supply zone (sell zone) and an expected drop toward the demand zone (buy zone).
🔍 Key Chart Elements
1. Supply Zone (Sell Zone) – Resistance Area
The supply zone is highlighted in the upper region, approximately between $86,000 and $88,000.
This area represents a strong resistance where sellers are active, preventing further price increases.
Bitcoin recently tested this zone but failed to break above, leading to a price rejection.
2. Demand Zone (Buy Zone) – Support Area
The demand zone is marked in the lower region, around $69,000 to $67,000.
This is a historical support level where strong buying interest is expected.
If Bitcoin reaches this level, a potential bullish reversal could occur.
📉 Bearish Price Projection
The chart includes a downward arrow, indicating an expected bearish movement from the supply zone toward the demand zone.
Reason for the expected drop:
BTC is struggling to gain momentum above $86,000, showing signs of weakness.
The recent bearish candles suggest increased selling pressure in the market.
A failed breakout above resistance increases the likelihood of a downward move.
Price Targets:
First target: Around $74,000, a potential minor support.
Second target: Around $69,000, which aligns with the demand zone and could act as a strong support level.
🔄 Potential Alternative Scenario – Bullish Breakout (Low Probability)
If BTC manages to break above the $88,000 resistance level, it could trigger a bullish rally.
In this case, the next targets would be $92,000 and $96,000.
However, given the current market structure, this is a less likely scenario unless buying momentum increases significantly.

BTCUSDT, Bearish Scenarios for upcoming days ...Hello Traders, Hope you're great.
for Upcoming days, I anticipate 2 Bearish scenarios :
In First Scenario, I expect price does an upward correction to the nearest broken support level that became to an important supply zone around 91-93K and after that starts to drop.
in Second scenario, I expect price does a further upward correction and goes to the supply zone around 95-97K and after that start a major downward movement.
Targets are 85K, 82K and my final target is 77K.
Don't forget to use proper risk management.
And finally tell me what do you think about BTCUSDT, UP or DOWN ? comment your opinion below this post.

BTC still on bearish movement#BTCUSD on bearish retracment, price is still bearish till 73800 which have bullish reverse.
Firstly we need to see price to break below 79300 which is sell stop on #BTC sell, Target 76k-73800.
Below 73800 holds bullish retracment which will push the price above 81k-82k for new confirmation.
Price bullish on #BTC is not valid yet.

Bitcoin on 2h chart Hello, dear friends! Welcome to my page🫶
Today, let's take a look at the Bitcoin chart on the 2-hour timeframe. There is a fascinating pattern emerging that I'd like to discuss. 🧐
I've drawn long-term support and resistance lines that have been forming since February and March of this year. Today, Bitcoin is attempting to break through a descending trendline. For many, this might seem like a bullish signal, but let's not jump to conclusions just yet. On the 2-hour chart, we can see that the price continues to form a rising wedge, which is typically considered a bearish signal, often resulting in a downward breakout.
At this moment, I see the possibility of the price rising into the blue zone, followed by a sharp decline. To provide a clearer picture, I'll also include a more long-term chart so you can better understand my analysis.
What are Your thoughts? How are You feeling about the market? Where do You think the price will go next? Share Your insights in the comments, I'm looking forward to hearing from You.
Thanks for Your attention💋
Always Yours, Kateryna💙💛

BTCUSDT - vomiting camel pattern? then what's next??#BTCUSDT.. market just going to make a technical formation that is VOMITING CAMEL pattern,
that will be a very dangerous formation if its occur.
you can search that formation on google as well.
then next areas are expected like 80000 or 70000
stay sharp
trade wisely
