Bitcoin - The only 100% probability setup!🔪Bitcoin ( CRYPTO:BTCUSD ) will drop -40% very soon:
🔎Analysis summary:
If we just take a look at previous cycles, Bitcoin is already starting a major -40% correction. If we then also take market structure and price action into account, this becomes a 100% probability setup. The next clear crypto bearmarket is starting right now.
📝Levels to watch:
$100,000
SwingTraderPhil
SwingTrading.Simplified. | Investing.Simplified. | #LONGTERMVISION
Btcusdshort

BTCUSD | Rejected Posted this idea few days ago and worked out a bit to well maybe :).
We are still in a downtrend so that's the reasoning behind the short idea from the red zone.
looking forward to see what happens at the 81.500 level.
What are your insights on Bitcoin?
Stay safe out there and do your own due diligence, this is not investment advise!

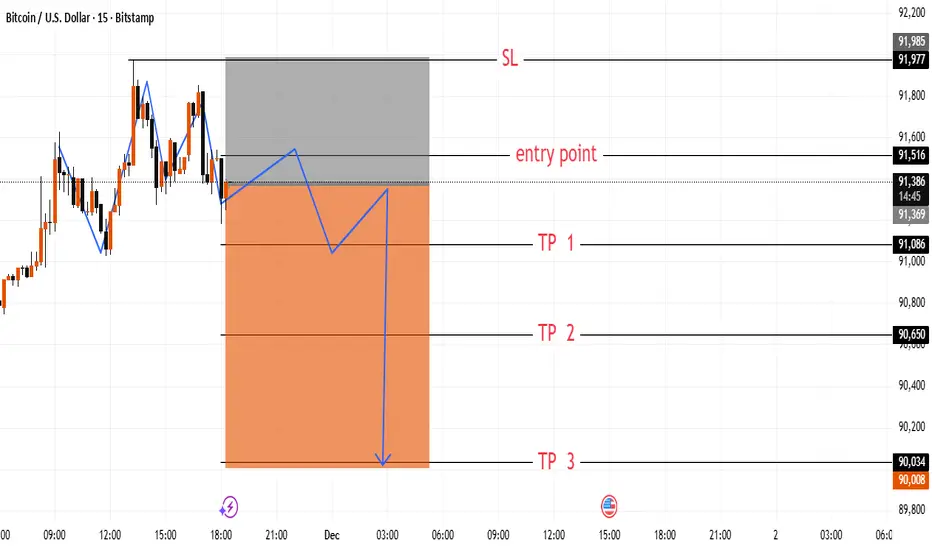
BTC Short-Term Range Reaction SetupThis view highlights how BTC/USD is reacting near a local zone where recent swings show repeated hesitation. The layout marks a clear reaction path with multiple downside targets, illustrating how price behavior is forming within this short-term structure without suggesting any specific action.
BTC pressure and downtrend continueBTC H4 Chart Analysis
Bitcoin on the H4 timeframe is currently showing a corrective pullback after reaching a key resistance zone around 95,500–96,300, which aligns with the descending trendline, previous supply zone, and EMA confluence (200 EMA + 300 EMA). This rejection indicates strong selling pressure and confirms the zone as a major resistance area.
Key Technical Points:
🔹 Strong Rejection at Major Resistance:
Price reacted sharply from the supply zone and failed to break above the descending structure, signaling sellers are still active.
🔹 Break of Short-Term Bullish Structure:
The recent drop has broken the ascending trendline, showing weakness from buyers and a potential shift back to a bearish correction.
🔹 EMA Dynamic Resistance:
Price remains below the 200 EMA (red) and the long-term moving average (white) — suggesting bulls still lack full control and the broader trend remains under pressure.
🔹 Volume Profile Confirmation:
Most liquidity sits below current price levels, hinting the market may revisit demand zones before attempting another move higher.

BTCUSD – Key Level Rejection with Potential Liquidity Sweep TowaChart Analysis
1. Price Context
BTCUSD is trading around $90,675.
The chart shows price rejecting the Key Level and failing to hold above the Daily CLS (daily close level).
Recent candles indicate loss of bullish momentum with a series of lower highs forming.
2. Key Zones on Your Chart
🔴 Daily CLS (Resistance)
Marked in red.
Price tried to break and hold above this level but rejected, showing it is acting as strong overhead resistance.
The shaded gray area above looks like the stop-loss zone for shorts, suggesting a bearish setup.
🟢 Key Level
Marked slightly below the Daily CLS.
Price broke above it earlier but is now retesting from the top, failing to reclaim.
This retest-rejection pattern signals a shift from bullish to bearish sentiment.
3. Trade Bias Indicated by the Chart
Your marked zone suggests a short position setup:
Entry around current price or just under the Key Level.
Stop-loss in the gray shaded box above the Daily CLS.
Take Profit 1 at 50% CLS TP1, a midpoint liquidity target.
Final TP near the green support at the bottom.
This structure reflects a liquidity-based short setup, expecting:
A sweep of local highs → rejection → push down to fill inefficiencies or revisit liquidity pools below.
4. Market Structure
Price printed a strong move up earlier, leaving inefficiency below.
Now forming lower highs and lower lows on the lower timeframe.
Hold below Key Level suggests continuation downward.
5. Bearish Confirmation Signals
✔ Failure to hold above Daily CLS
✔ Break of Key Level and retest as resistance
✔ Weak bullish follow-through
✔ Liquidity target below at 50% CLS

BTCUSD can crash to 24k if ABC correction occurs BTC experiencing the effect of Dead cross at 110000 USD ,which can drag upto 74500 and a support can take place due to price convergence and RSI divergence setup.
If price bounce backed from 74500 around ,then it can reach 0.386/0.618 around 106000 and 108000 USD.
A third try to breach 74500 can break the support and can take leap towards 24k making it drag down of 82% which BTC achieved back in 2017- 2018 .
Disclaimer: this is purely based on previous trends study and speculations according to price moments .i recommend to make your own study before investing or consult your financial advisor .

BTCUSD (2H) – Elliott Wave Completion + Breakout SetupBITSTAMP:BTCUSD
Bitcoin has completed a clear 5-wave corrective structure, currently consolidating near a demand zone after sweeping liquidity around $87,300.
Price is now attempting to break short-term structure, forming a potential reversal setup. A confirmed breakout above the $89,800–$90,300 resistance zone may trigger a bullish continuation toward the descending trendline and mid-range level.
Key Scenarios
✅ Bullish Case 🚀
Break & hold above $90,300
→ 🎯 Target 1: $95,800
→ 🎯 Target 2: $105,100 (Extended target if trendline breaks)
📌 Entry Zone: $88,500–$90,300
📌 Stop Loss: $83,900
❌ Invalidation:
A strong break below $83,900 confirms bearish continuation toward the lower demand at $80,500.
Levels to Watch
Support: $87,300 / $83,900
Resistance: $90,300 / $95,800 / $105,100
⚠️ This chart is for educational purposes only. Not financial advice.

BTCUSD: Wave rhythm on the verge of impulseBased on the current structure, Bitcoin is completing its corrective phase and is preparing to form a new impulse. The chart shows a transition from sideways movement to a more dynamic wave, which could set the direction for the near term.
Primary scenario: after the correction ends, a downward impulse sequence is expected to develop. Alternative scenario: if the market consolidates above recent highs, it could continue to rise, delaying the start of a new downward wave.
Idea for traders: watch for confirmation of the structure on lower timeframes and enter only after clear reversal signals appear.
Friends, more wave analysis is available in our profile.
Subscribe to stay up to date with wave analysis!

Weekly BTCUSD Trend SummaryThis week, BTCUSD launched a strong rebound following a previous sharp decline, but later pulled back after hitting resistance, presenting an overall oscillatory recovery pattern characterized by "rebound – rally – pullback."
1. Early-Week Oversold Rebound with Intense Long-Short Dynamics (November 24)
At the start of the week, BTCUSD extended its oversold rebound after touching a 7-month low of $80,600 the prior week. Prices briefly broke above $88,000 in the morning, with an intraday peak gain of 3.85%; however, the market pulled back in the afternoon, slipping below $86,000 to turn slightly negative.
2. Mid-Week Oscillatory Uptrend as Bearish Momentum Faded (November 25 – 26)
November 25: Prices traded around $88,000, approaching the key resistance level of $90,000, forming a three-day consecutive rebound on the daily chart.
November 26: A bullish rally emerged in the evening, with prices surging approximately 5,000 points to successfully break through the $90,000 mark. However, the rally lacked subsequent volume support, preventing prices from extending further into higher ranges and laying the groundwork for a subsequent pullback.
3. Late-Week Rally Followed by Pullback, Halted at Key Resistance (November 29 – 30)
In the latter half of the week, the market experienced a turning point. On the morning of November 29 (Friday), prices touched a weekly high of $93,092 but immediately pulled back. Subsequently, prices retreated to around $90,000 to seek support, testing the validity of the $90,000 – $91,000 support range. From a market analysis perspective, the area around $93,000 represents the high of a consolidation range following multiple previous pullbacks, featuring strong resistance.
Overall Outlook & Key Drivers
Overall, BTCUSD staged a significant rebound from recent lows this week, but the lack of sufficient volume during the rebound was a prominent issue. Going forward, focus should be on whether prices can hold above the $90,000 support level—if broken, a further pullback may ensue. Conversely, if BTCUSD can regroup and break through the key level of $93,500, it may attempt to challenge the two-month downtrend line around $96,000.

BTC 1H – Bearish Retracement Before Potential ContinuationBTC is currently pulling back after rejecting the upper volatility band, forming a clear lower high on the 1H timeframe. Price is trading back under the EMA ribbon, signaling a short-term bearish retracement within the broader bullish structure. This cooldown is healthy and expected after the recent impulsive move up.
Downside targets are aligned with the Fibonacci retracement levels:
🔻 TP1 – 38.2% Fib: ~$89,766
🔻 TP2 – 61.8% Fib: ~$88,923
🔻 TP3 – 100% Fib: ~$87,658
As long as BTC holds above the deeper Fib zones and maintains higher-timeframe structure, this move is likely just a corrective dip before buyers step back in. Once the retracement completes, a continuation to the upside remains the more probable scenario.

BTCUSD | Rejected BTCUSD dropped when reaching my zone I posted in one of my other ideas.
Looking for BTCUSD to make move down from here and make a new low.
Let me know what you think!
Stay safe out there and do your own due diligence, this is not investment advise!

BTCUSD | short ideaLooking for bitcoin to get into this zone and make a move downwards. I don't think this downtrend is over just yet.
Let me know what you think!
Stay safe out there and do your own due diligence, this is not investment advise!

BTCUSD Relief rally before another drop.BTCUSD is currently completing 5 wave bearish structure, I'm expecting a wave 4 retracement before another wave down.
Sell Zone: $92,150 – $96,700
I expect BTC to continue climbing into this zone before distribution begins. Beware that BTC's bullish momentum is exhausted and it might not reach that high. Reaching this sell level might be a complex correction not a simple one.
Buy Zone: $72,100 – $75,990
If this analysis plays out well, and market starts showing bullish signs, I'm expecting it will be the local low for this bearish bitcoin move. Otherwise, price might continue dropping to $62,000 area.
I will update this idea later.
Good Luck!

BTC/USD (1H Timeframe) ...📌 BTC/USD (1H Timeframe) – Target Analysis
My chart shows:
Price moving above an ascending trendline
Price breaking above the Ichimoku cloud
A clean space above for an upward move
This setup indicates bullish continuation.
---
🎯 BTC Target (Based on my Chart)
✔ Main Target
$91,500 – $92,000
This matches the “Target Point” my marked and is a valid resistance zone based on the chart structure.
---
📈 Why This Target Is Valid
Price is holding above my trendline support
Price has broken out of the cloud, indicating bullish momentum
No major resistance between $87,500 → $91,500
---
📌 Suggested Trade Plan
Entry: Already near breakout zone ($87,000 – $87,600)
Stop-Loss: Below trendline / cloud → $85,800 – $86,200
Take Profit: $91,500 – $92,000

BTCUSD It is Inevitable...I hate to say it… but this chart is giving me flashbacks.
When you zoom out on BTC’s weekly structure, you see similarities between 2021 and what’s happening right now in 2025. This doesn't look good to me.
After the double-top formation in 2021, we got a relief rally that tricked everyone into thinking new highs were coming. But it was just a Bull Trap.
Fast forward to today:
Price is crawling back into the identical type of bull trap zone we saw last cycle at 0.38 Fibonacci (same as 2021).
If the market keeps repainting the same structure, BTC could deliver one more “hope” bounce into the red circle (which will be another bull trap)…only to roll over again and start a deeper correction.
No hopium here… just the chart speaking for itself.
I would recommend avoiding swing trades that leaves you exposed you to an uncertain market. Day trading remains effective but only on smaller timeframes.
Good Luck!

BTC: Bullish Trend, 900000 Breakout AheadFollowing Black Friday’s plunge, BTC’s uptrend is now confirmed—holding firmly above 85000 and awaiting a direct breakout above 90000
Buy 86500 - 87500
TP 88500 - 89000
Accurate signals updated daily. They serve as a reliable guide for trading issues – feel free to refer to them. Hope they help!

Bitcoin Target 60K - Here's why (...you should hedge now)🔱 Bitcoin is behaving like a model student when it comes to the fork framework. 🔱
The first re-test at the white centerline, followed by a drop down to the red centerline, and then to the white lower median line parallel was already impressive. And the story isn’t over yet!
In the past days we’ve seen a re-test at the white L-MLH. Bitcoin failed to trade its way back into the fork. That leaves further price losses as the likely outcome.
The next targets are:
👉 the 1/4 level at around 76,000
👉 the white warning line at about 70K–72K
👉 the final move to the red L-MLH at around 60K
This decline would go hand in hand with continued sell-offs in the major indices like the Nasdaq and S&P 500. It would also support my previous post regarding a massive rise in TLT.
(props to @coinwide for the heads-up!)
🚨 A hedge would be appropriate now, before the VIX ignites its rocket and option prices explode.
Wish you all the best out there!

BTCUSD today BTCUSD is in a narrow-range consolidation phase. While it benefits from the boost to risky assets amid expectations of a Federal Reserve rate cut, persistent pressure from capital outflows in spot markets and ETFs has kept bullish and bearish forces temporarily balanced, with the price oscillating between key support and resistance levels.
On the daily timeframe, the price is trapped in a tight trading range of $86,500 - $88,000, and the Bollinger Bands have contracted to their narrowest level this month. This pattern indicates the market is at a critical juncture for directional selection, with little probability of a sharp one-sided move in the short term.
Support Levels: The primary support zone is $86,000 - $86,500. This range not only served as the stabilization area following the intraday pullback but also acts as a crucial trendline underpinning the long-term structure. Holding this level is expected to sustain the short-term consolidation; if breached, the next core support will be $83,000, with a further breakdown potentially testing $78,500.
Resistance Levels: The key short-term resistance zone is $89,000 - $90,000, where the $90,000 mark forms a strong psychological resistance. Previous attempts to rally above $90,000 have consistently faced selling pressure from capital outflows. A breakout above this zone would target subsequent resistance levels around $90,450 and $92,300.
Buy 86000 - 86200
SL 85800
TP 87500 - 88000 - 88500
Sell 88000 - 88500
SL 89200
TP 87000 - 87500 - 88000

BTCUSD: Test the resistance zone of 89,000 - 90,000BTC is in a phase of sideways consolidation following a rebound. Its price fluctuates within the trading range of 88,000 - 89,000. Although the bulls still possess upward momentum, the obvious resistance lies ahead. Meanwhile, the market sentiment has been gradually recovering from the previous panic, and the overall market is in a pattern where both bulls and bears are conducting cautious tentative moves.
After stabilizing around the 85,000 level earlier this week, the asset has launched a three - consecutive - day rebound, with a relatively solid support level in place.
Focus on the short - term resistance zone of 89,000 - 90,000 ahead. If this zone is broken through, the price may surge towards the range of 92,000 - 94,000.
Buy 85500 - 86000
SL 85000
TP 87000 - 88000
Sell 89000 - 89500
SL 90500
TP 86000 - 85000

BTC - NEW ATH in December or DROP?Hello BTC Watchers 📈
Bitcoin has, historically, been very bullish in Decembers. We see the most drastic increase in 2020, when BTC climbed over 140%.
During the times that BTC corrected over December, it's been 10% and 31%.
This makes it hard to predict seeing that it seems to be different every year with one year even trading in a tight range.
A few things we can do to clarify the possible direction of BTC This December:
1️⃣ Check the Macro
From a macro perspective, Bitcoin has increased and been increasing since April, with the hard drop only showing now in November.
This could mean two things - the correction before a final leg up or, the beginning of the bearish cycle.
2️⃣ Check Technical Indicators
a) The moving averages is pointing towards short-term BEARISH, since we are trading UNDER the 200d Moving averages(green line):
b) The Bollinger bands are showing an expansion (aka widening) but to the bottom, as the price is trading on the lower BBands, also indicating strong selling pressure for the short to near term:
3️⃣ Watch the News
Bitcoin has been coming up in many seemingly "bullish" articles. This is usually a bad sign before the liquidation - create hype, and then short the market.
Conclusion:
I'm leaning towards a soft pump in December to soften the blow of the current correction , but not a new ATH. The next increase will likely be a "fake-out" before the real bearish season starts in the new year.

BTC’s 85k-87k Range: 80k Risk or 100k Rebound Next WeekBTC plummeted to around 80,000 last Black Friday, now ranging between 85,000 and 87,000. A breakdown below 85,000 risks breaching the 80,000 support; holding above confirms a rebound, with a potential retest of 100,000 next week
Sell 88000 - 87500
TP 86500 - 86000 - 85000
Accurate signals updated daily. They serve as a reliable guide for trading issues – feel free to refer to them. Hope they help!

BTCUSD Relief rally before another dropBTCUSD is currently completing 5 wave bearish structure, I'm expecting a wave 4 retracement before another wave down.
Sell Zone: $92,150 – $96,700
I expect BTC to continue climbing into this zone before distribution begins. Beware that BTC's bullish momentum is exhausted and it might not reach that high. Reaching this sell level might be a complex correction not a simple one.
Buy Zone: $72,100 – $75,990
If this analysis plays out well, and market starts showing bullish signs, I'm expecting it will be the local low for this bearish bitcoin move. Otherwise, price might continue dropping to $62,000 area.
I will update this idea later.
Good Luck!

BTCUSD – 1H Short Setup BITSTAMP:BTCUSD has pushed into a local resistance zone near 87.8k, aligning with the upper volatility band and showing early signs of exhaustion. Price is also interacting with the 38.2% retracement level, which often acts as a reversal pivot in corrective structures.
Bearish Confluences
Overextended into upper band resistance, historically a fade zone on this timeframe.
Lower-timeframe momentum slowing, with smaller-bodied candles and wicks rejecting the highs.
Fibonacci alignment at 38.2%, matching the start of prior impulsive sell-offs.
Trend ribbon overhead still angled downward, suggesting broader trend pressure remains bearish.
A rejection from the current zone may initiate a pullback toward deeper fib targets as BTC resets from its overextended push.
🎯 Fibonacci Targets
TP1 — 38.2%: ~86,587
TP2 — 61.8%: ~85,784
TP3 — 100% extension: ~84,483
SL above 87,887
