BTC/USD – Intraday Structure Update (1H)🟠 BTC/USD – Intraday Structure Update (1H)
Price has just swept local highs (SWFTH) and is now showing a reaction from the critical resistance zone (CRTH–TS).
Current structure suggests a possible short-term pullback before continuation, with key levels marked below:
Resistance: 115,016 – 115,532
Support: 113,737 – 114,134
Current Price: 114,670
A sustained move above 115K could open room toward 115.5K+, while rejection from this area could bring 113.7K back into focus.
📊 Watch for liquidity grabs and confirmation wicks before entering any position.
💬 What’s your bias here — continuation or correction?
Follow for more.
Greetings,
MrYounity
Btcusdshort

BTC: Oscillate and ConsolidateAlthough BTC rose in oscillations today, it encountered resistance near 112,500 and failed to break through after several attempts. This position has gathered a certain number of trapped orders and active sell orders, forming a short - term resistance range. If the bulls can gather enough strength to break through the 112,500 with increased volume, the upward space will be opened, and the price may further challenge the resistance levels of 115,000 or even 120,000.
However, due to the sharp decline in the early stage, the market sentiment is still relatively fragile, and investors are generally cautious. From a technical point of view, Bitcoin is likely to continue to oscillate and consolidate in the range of 108,000 - 115,000 today, and the long and short sides compete around key levels.

BTC: Oscillating to build a bottomOver the weekend, after a sharp decline in the early stage, the Bitcoin price is currently in a shock - bottoming phase. In the early stage, the short - selling force was strong, pushing the price down rapidly. However, over the weekend, the price fluctuation range gradually narrowed, indicating that the strength of the long and short sides tends to be balanced in the competition, and the market is looking for a short - term direction.
Although Bitcoin rose in oscillations today, it encountered resistance near 112,500 and failed to break through after several attempts. This position has gathered a certain number of trapped orders and active sell orders, forming a short - term resistance range. If the bulls can gather enough strength to break through the 112,500 with increased volume, the upward space will be opened, and the price may further challenge the resistance levels of 115,000 or even 120,000. However, due to the sharp decline in the early stage, the market sentiment is still relatively fragile, and investors are generally cautious. From a technical point of view, Bitcoin is likely to continue to oscillate and consolidate in the range of 108,000 - 115,000 today, and the long and short sides compete around key levels.
Buy 108000 - 110000
TP 113000 - 115000
SL 106000
Daily-updated accurate signals are at your disposal. If you run into any problems while trading, these signals serve as a reliable reference—don’t hesitate to use them! I truly hope they bring you significant assistance
BTC:Flash crashToday Bitcoin suffered a "flash crash", plummeting by over 13% in the early hours and falling below the $110,000 mark, which triggered forced liquidations for more than 1.6 million traders.
The core market situation can be summarized as leverage-driven cascading liquidations led by policy negatives. While short-term volatility has intensified, long-term key factors remain unchanged. Before the crash, Bitcoin’s leverage ratio soared to 50x, and high-leverage trading was prevalent among retail investors. Price fluctuations triggered forced liquidations, amplifying the decline.
We judge that the 103,000 level and the psychological threshold of 110,000 serve as crucial short-term support levels. If the price breaks below 100,000, a deeper correction may be triggered.
The Federal Reserve’s October interest rate decision, the progress of the U.S. government shutdown, and the follow-up developments of Trump’s trade policies will become core variables in the next phase.

BTC:Performance Recap for the weekThis week, the Bitcoin market witnessed an extreme price movement characterized by "a frenzy-driven rally – panic-induced volatility – a cliff-like crash", with a weekly volatility of 21.3%, marking the most drastic fluctuation record since 2025. Market sentiment oscillated repeatedly between greed and fear, and the trend can be specifically divided into three phases:
Monday: A momentum-driven rally to a phased peak
Tuesday to Wednesday: The first pullback after hitting a new high
Thursday to Friday: A black swan event triggering a crash-like decline
We judge that the 103,000 level (this week’s low) and the psychological threshold of 110,000 serve as crucial short-term support levels. If the price breaks below 100,000, a deeper correction may be triggered. The Federal Reserve’s October interest rate decision, the progress of the U.S. government shutdown, and the follow-up developments of Trump’s trade policies will become core variables in the next phase. Uncertainties surrounding geopolitics and macro policies may continue to intensify market volatility.

Bitcoin (BTC/USD) – Short SetupHi guys!
let's dive into btc:
BTC has recently broken down from its ascending channel, signaling a potential shift in short-term momentum. After the breakout, the price could go toward the previous structure zone around $122,000–$123,500, which now acts as a potential supply area.
There are two potential entry zones for short positions:
First Entry: Around $122,000, where price may face initial rejection from minor resistance.
Second Entry: Toward $123,500, aligning with the upper boundary of the recent supply zone for a better risk–reward ratio.
Both setups target the $118,400–$118,000 demand zone, which overlaps with the previous consolidation base and channel support.
As long as BTC trades below $125,500, bearish momentum is likely to remain dominant in the short term. However, a confirmed close above this level could invalidate the short setup and signal a possible re-entry into the ascending structure.
Disclaimer: As part of ThinkMarkets’ Influencer Program, I am sponsored to share and publish their charts in my analysis.

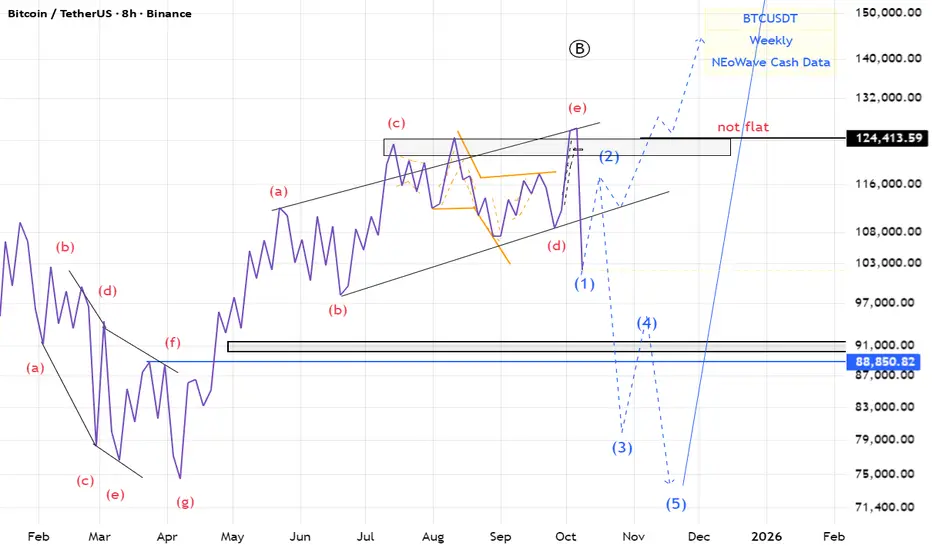
BTC(based on NEo wave)there is a good possibility for the irregular flat.
I think 2-3 month we will see the red market
BITCOIN'S FALL HAS BEGUN ! DON'T GET CAUGHT UP IN THE BLOODBATH JPowel's rate cut hints that something bad is about to happen. All Fed Rate cuts have been marked by devastating market crash and this time will be no different. Don't lose your hard-earned money to the upcoming carsh !! You have been warned.
Disclaimer: Not financial advice.

BTC: Range trading & event-driven tradingToday's BTC market demonstrates the dual characteristics of "rallying and then pulling back and range-bound fluctuation". In the short term, it will most likely remain in a range-bound state, and the probability of breaking out of the range before the option expiry is relatively low.
If the U.S. Dollar Index breaks below 99.2, BTC is expected to move upward to test the resistance level; if whales show signs of closing long positions, it may continue to decline.
Given that whales' 40x highly leveraged positions may trigger liquidity squeezes, it is recommended that retail investors limit their leverage ratio to no more than 5x and avoid chasing longs above 121,800.
Based on the current market conditions, it is advisable to adopt a composite strategy of "range trading & event-driven trading".
Buy 120500 - 121000
TP 121500 - 122000
SL 120000
Daily-updated accurate signals are at your disposal. If you run into any problems while trading, these signals serve as a reliable reference—don’t hesitate to use them! I truly hope they bring you significant assistance

BTC: In a weak consolidationCurrently, BTC is in a weak consolidation phase following a pullback. After touching an intraday low of 120,804.39, it rebounded sharply, indicating that the 120,800-121,000 range has short-term buying support. This level is close to the upper edge of the previous consolidation platform at 120,500 and forms a joint support zone with the key concentrated price level of 120,000 in the options market. However, the current price of 121,000 is still on the edge of the support level, and no clear stabilization signal has been formed yet.
Buy 120000 - 120500
TP 121000 - 121500 - 122000
SL 119500
Daily-updated accurate signals are at your disposal. If you run into any problems while trading, these signals serve as a reliable reference—don’t hesitate to use them! I truly hope they bring you significant assistance
BTC: Three-stage trajectorToday's BTC market shows a pattern of high-level consolidation with a pullback, characterized by a three-stage "surge - retracement - consolidation" trajectory. In the early session, it attempted to break through the 124,000 resistance level but failed. Subsequently, it pulled back to around 121,000 to seek support, and later, a bull-bear tug-of-war unfolded within the 122,000 range.
Close attention should be paid to the October 15 deadline for the U.S. government shutdown (Polymarket predicts a 56% probability of it lasting until that date). If the shutdown is extended, leading to further delays in ETF approval, Bitcoin may retrace below 120,000, and in extreme cases, test the support level at 118,000.
The current market is suitable for a "low-leverage + position-splitting strategy": Holders can set 121,000 as the trailing stop level. Given that the current support level has moved upward and trading volume has not contracted, the stop-loss range can be appropriately widened. On the other hand, observers may wait for the price to stabilize above 123,600 or for signs of stabilization with reduced volume after retracing below 120,500 before considering entry, avoiding chasing gains or selling in a panic within the consolidation range.
Buy 121000 - 121500
TP 122000 - 122500 - 122300
SL 120000
Daily-updated accurate signals are at your disposal. If you run into any problems while trading, these signals serve as a reliable reference—don’t hesitate to use them! I truly hope they bring you significant assistance
Bearish outlook for Bitcoin!Bitcoin Cycle Analysis and Trade Thesis
For more than a decade, Bitcoin has evolved through recurring cyclical patterns, consistently respecting long-term moving averages and two logarithmic regression curves — one defining market peaks and the other defining troughs. I expect this structural behavior to persist over the coming years.
On Friday, as INDEX:BTCUSD briefly topped 123,000, I initiated a bear put spread on NASDAQ:IBIT (50/45 strike), expiring January 2026.
Target: BTCUSD ≈ 70,000.
If this target is not reached by late 2026, I will close the position regardless of price.
Bearish Counterpoints
“Never trade against the trend” — Bitcoin has remained structurally bullish since inception.
“No parabolic top” — Historically, bear markets have emerged only after parabolic blow-offs, which are not currently visible.
“No fundamental trigger” — Major bear phases have often begun with clear catalysts (e.g., Mt. Gox invalid transaction issues, Mt. Gox collapse, China’s mining ban…), none of which are present now.
I admit it feels somewhat awkward to go short while everyone else is buying.
But in trading, profit often comes from being contrarian — buying near the bottom when fear dominates, and selling near the top when euphoria takes over.
And one last thought: even if I believe crypto will still exist in 50+ years — stablecoins, for example, are undeniably useful for fast money transfers and cross-border payments — I expect many of the most speculative assets to trade far closer to zero than to today’s prices.
Bitcoin, along with others tokens, remains, in my view, vastly overvalued.

Why MY “Big Dump” THESIS STILL STANDS. BITCOIN WILL BLEEDHappy Monday traders,
I’ve reviewed the latest data again and nothing has changed my view. The structure still looks weak underneath the surface and the setup for downside remains strong.
Summary:
• Price rising → Market pushing higher, looks strong on the surface.
• Stablecoin OI increasing → New leveraged perp positions opening. Speculative money is driving the move, not real buyers.
• Coin-margined OI dropped, then slightly increased → Shorts were closed during the breakout, and now new shorts are opening near the highs.
• Spot CVD flat or slightly negative → Real demand is still missing. Spot traders aren’t supporting this move.
• Stablecoin CVD rising → Perp traders are aggressively buying, lifting price artificially.
• Long/Short ratio falling (2.05 → 1.02) → Fewer longs and more shorts entering. Shorts are fading strength while price keeps rising.
• Price up + OI up + Spot CVD flat → Buyers are being absorbed by new shorts. This is distribution forming at the highs.
• Possible short-term move to 126K → Could sweep weekend highs during RTH for liquidity before a potential reversal.
• If Spot CVD stays flat while OI rises on that move → That would likely be the final squeeze before a deeper dump.
-------------------
1️⃣ The same leverage-driven structure
The breakout on September 25 looked impressive, but it was built on leverage rather than real spot demand.
Stablecoin OI (aggregated) increased from 257K → 285K contracts (+10.9%)
This shows fresh leveraged exposure coming from perps, not genuine buyers
Coin-margined OI dropped from 7.58B → 7.29B during that breakout as shorts were closed out
It has now started to rise slightly again at current prices, meaning new coin-margined positions are opening near the highs, most likely shorts fading strength
2️⃣ Spot demand is still missing
Spot CVD moved from -18.38K → -16.44K (about +10.5%), while futures OI rose almost the same amount. That tells you everything: the breakout was driven by futures leverage, not real spot buying.
Everyone’s renting Ferraris (perp longs), but no one is actually buying one (spot BTC). Once the rental stops, the cars vanish and prices drop.
3️⃣ The long-short ratio collapse
On September 25, the aggregated long/short ratio (Binance + Bybit) was 2.05, meaning twice as many longs as shorts. Today it sits near 1.02, even though price is higher.
Early breakout longs have been closed or liquidated
New traders entering the market are mostly shorts
OI is still rising, showing new short positioning, not liquidation exits
Stablecoin-perp CVD is still climbing, meaning buyers are pushing price up but every uptick is met with new short liquidity
This is a classic case of perps pushing while smarter money fades.
4️⃣ Why I still think Bitcoin will bleed
This looks like distribution, not accumulation.
Perp traders are driving the move
Spot buyers still haven’t shown up
Shorts are building into the highs
That’s not a healthy uptrend. It’s a top-heavy market waiting for the bid to dry up. When it does, the unwind will likely be quick as leveraged positions are forced out.
Think of it like a rubber band. The more it’s stretched by leverage without real demand, the harder it snaps when buying power runs out.
⚖️ TL;DR
Stablecoin OI +10.9% → leverage driven
Coin OI fell, then rose slightly → shorts covered, new shorts forming near highs
Spot CVD flat → no real buyers
Long/Short ratio 2.05 → 1.02 → longs out, shorts in
The move up was built on leverage, not ownership.
Spot hasn’t confirmed, and shorts are stacking into strength.
🎯 Short-term note
There’s a chance we see one more push toward the 126K region during RTH to sweep the weekend highs before rolling over. If that happens with spot CVD still flat and OI climbing, it’ll likely be the final liquidity grab before a larger move down.
Until spot CVD turns positive and OI stabilizes, my view remains the same: Bitcoin will bleed.
Interested in the Order Flow data that I used for this Analysis? Check it out here => ibb.co
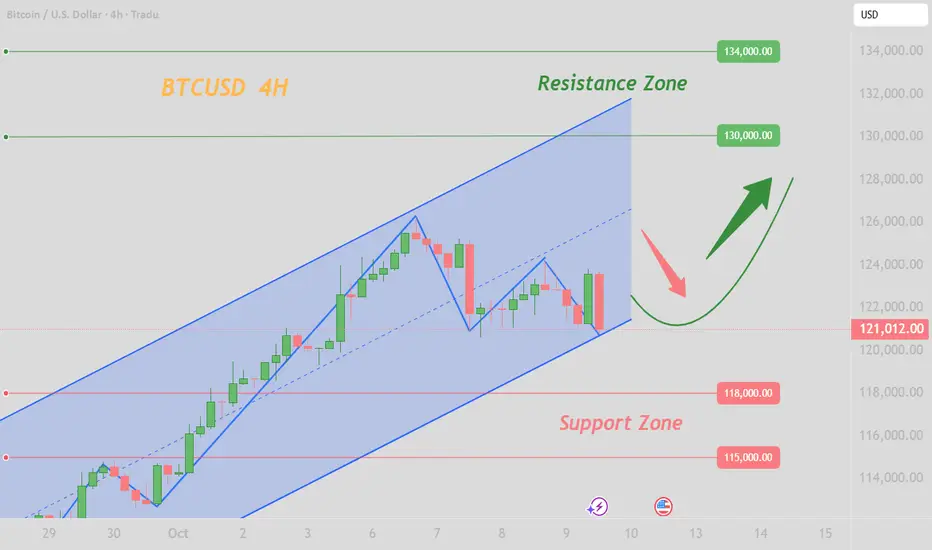
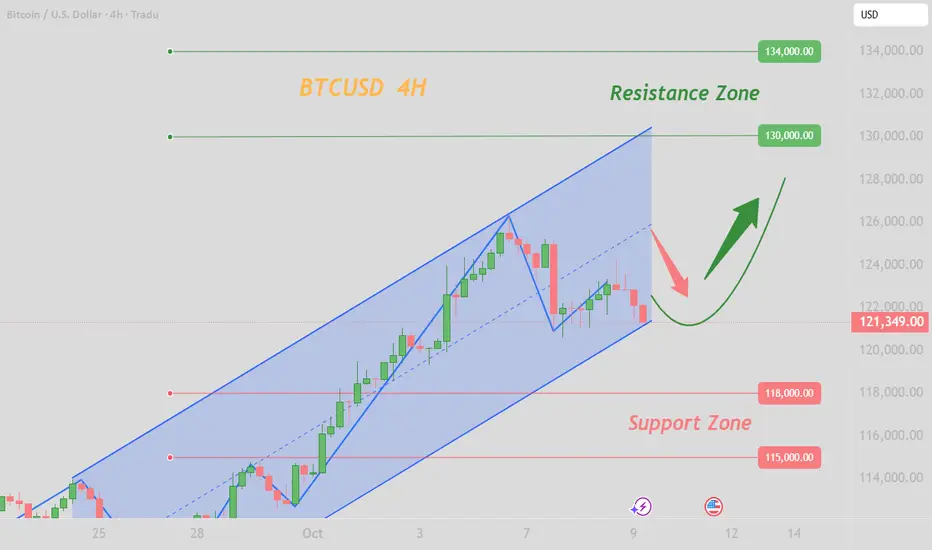
BTCUSD – Bulls Strong but Overbought! | 4H AnalysisBitcoin (BTCUSD) has rallied sharply from $110K to $124K, gaining strong bullish momentum. Price is now trading well above the 20/50/100/200 SMAs, confirming the uptrend. However, RSI is entering the overbought zone, suggesting a possible short-term pullback before continuation.
🔹 Technicals
Trend: Strong Bullish (above all major SMAs)
Resistance: $124,500 – $126,000
Support: $122,500 (20 SMA), $120,000, $118,000
RSI: Near 70–75 → Overbought, slight bearish divergence
✅ Bullish Case:
If price sustains above $122,500 and breaks $126,000, we may see an extension toward $128,000 – $130,000.
⚠️ Bearish Case (Pullback):
Failure to break $126,000 could trigger a correction toward $120,000 – $118,000 before another leg higher.
📌 Trading Plan
Long Entry (dip-buy): $122,500 – $120,000
Target: $126,000 → $128,000 → $130,000
Stop Loss: Below $118,000
🔑 Summary
Bitcoin remains in a strong bullish trend, but the market is short-term overheated. Best opportunities are on dips or a confirmed breakout above $126K.

BTC/USD – 15m Symmetrical Triangle SetupPattern: Symmetrical triangle after a strong bullish impulse. Market is consolidating inside narrowing support & resistance. A breakout is likely soon.
Bullish Scenario
• 📈 Entry: Buy above 123,000–123,100 (confirmed breakout)
• ⛔ Stop-Loss: Below 122,500
• 🎯 Take-Profit 1: 123,892 (major resistance)
• 🎯 Take-Profit 2: 124,500+ if momentum continues
• 🔄 Option: Wait for retest of 122,750 zone before entry
Bearish Scenario
• 📉 Entry: Sell below 121,700–121,800 (confirmed breakdown)
• ⛔ Stop-Loss: Above 122,300
• 🎯 Take-Profit 1: 120,764 (major support)
• 🎯 Take-Profit 2: 120,000 psychological round number
Break up = aim for 123,892+
Break down = aim for 120,764

BITCOIN HIGH PROBABILITY SETUP SOON!!!🚨 BTCUSD HIGH PROBABILITY SELL SETUP 🚨
* Here We Can See Clearly The Next Potential Moves For BTC Coming Hours/Days.
* Keep Your Eyes Close On Your Trading Positions.
* Happy PIP Hunting Traders.
FXKILLA.

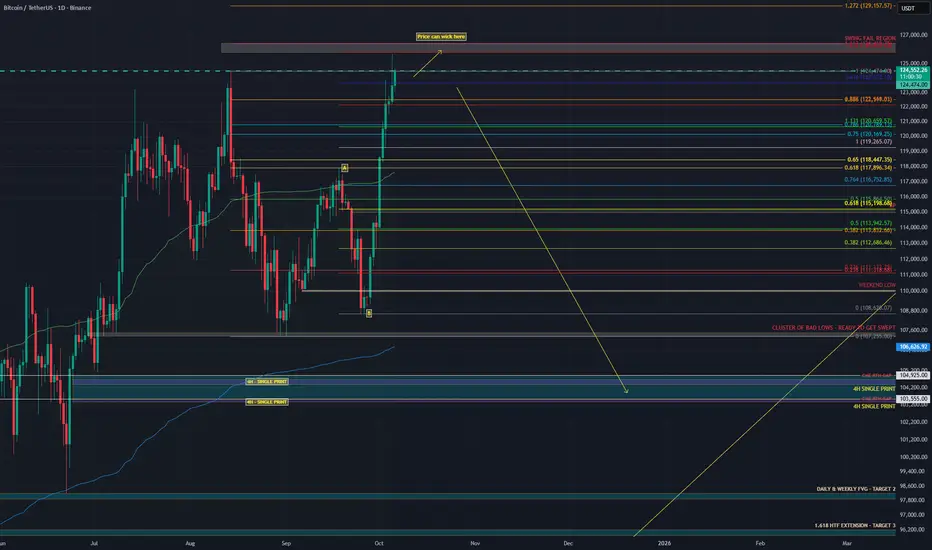
BTC/USD – Short Setup from Resistance Zone (Oct 2025 Analysis)Trend & Channel
The price has been moving inside an ascending parallel channel (highlighted in pink).
Current price is $122,395, approaching the upper boundary of the channel, where resistance typically appears.
Key Levels
Entry Point: Around $124,257 – suggested short-entry zone.
Support/Resistance Zone (Blue Box): Between $128,000 – $130,442. This is where rejection is expected.
Stop Loss: Above $132,000 – just outside the resistance zone to protect against a breakout.
Target Point: $104,097 – near the lower boundary of the channel, aligning with prior support levels.
Price Action Setup
The chart suggests a short trade setup (sell) if BTC/USD hits the $124K–$130K zone.
Expectation: After touching this resistance area, price could reverse downward toward the $104K target.
Risk-to-Reward Ratio
Risk: About $8,000 (132K - 124K).
Reward: About $20,000 (124K - 104K).
Approximate R:R = 2.5 : 1, which is favorable for a swing trade.
✅ Summary:
This is a bearish short-term outlook for BTC/USD. The strategy is to wait for price to reach the 128K–130K resistance zone, enter a short position, keep a stop loss above 132K, and aim for a target around 104K

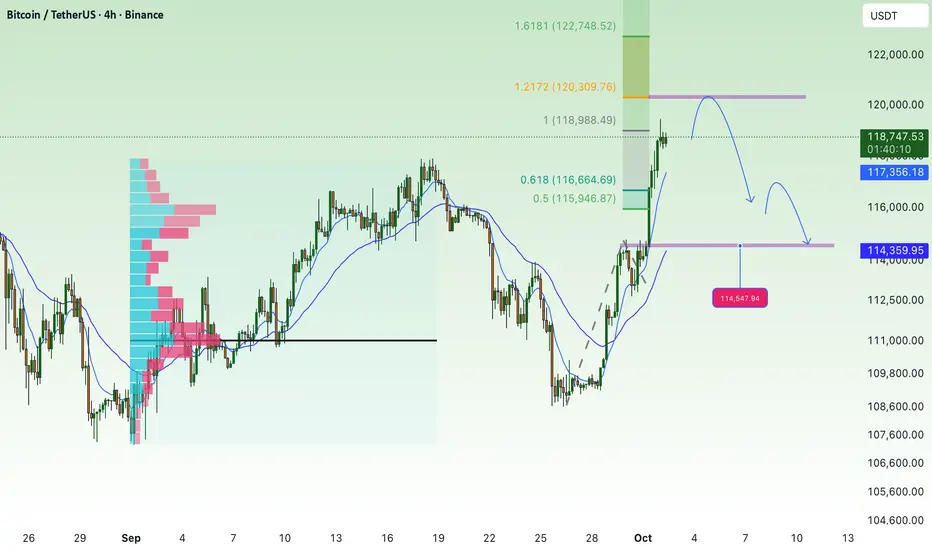
Be careful with the continued downward correction.BTC Plan Analysis
Currently, BTC has rallied strongly toward the 118,700 – 118,800 zone and is testing the 1.0 Fibonacci resistance. This area may trigger short-term profit-taking.
Main outlook: After a sharp rally, the market is likely to see a corrective move.
Key Levels
Resistance:
118,800 – 119,000 (near-term resistance, currently being tested)
120,428 (strong resistance on the higher timeframe)
122,500 (major resistance, extended wave target)
Support:
116,485 (Fibo 0.786, important confluence support)
114,837 (previous resistance turned support + EMA200)
114,150 – 114,050 (lower support, Fibo 0.236)
Possible Scenarios
BTC may face selling pressure at 118,800 – 119,000, leading to a correction back to 116,500.
If 116,500 breaks, the next support zone is 114,800 – 114,000.
If BTC holds above 116,500 and bounces, the market will likely retest the higher resistance at 120,400 – 122,500.
👉 Summary: Price is currently at short-term resistance. It’s better to wait for a reaction before making decisions. The correction toward 116.5K remains the primary scenario before the next clear move.
BTC/USDT Bearish Trend analysis Read The captionSMC Trading point update
Technical analysis of BTC/USDT (4H timeframe) chart analysis:
---
Bearish Bitcoin Setup
Trend: The market is clearly in a downtrend, with price respecting the descending channel.
Fair Value Gaps (FVG): Two FVG zones are highlighted where price retraced to fill imbalances.
Moving Averages:
50 EMA (red) and 200 EMA (blue) are above price, confirming bearish momentum.
Key Resistance: Price is currently retesting the FVG supply zone around 111,000 – 111,500, which aligns with the descending trendline.
Rejection Expected: If sellers defend this zone, price is likely to continue its bearish trajectory.
---
Target Point
A measured move suggests a potential drop towards 106,218 (next support / target zone).
This aligns with the channel’s lower boundary.
.
Mr SMC Trading point
---
Trading Idea
Bias: Bearish.
Entry Zone: Around 111,000 – 111,500 (FVG supply & trendline confluence).
Target: 106,218.
Invalidation: A breakout above 113,000 (200 EMA) would weaken the bearish setup.
---
Please support boost 🚀 this analysis

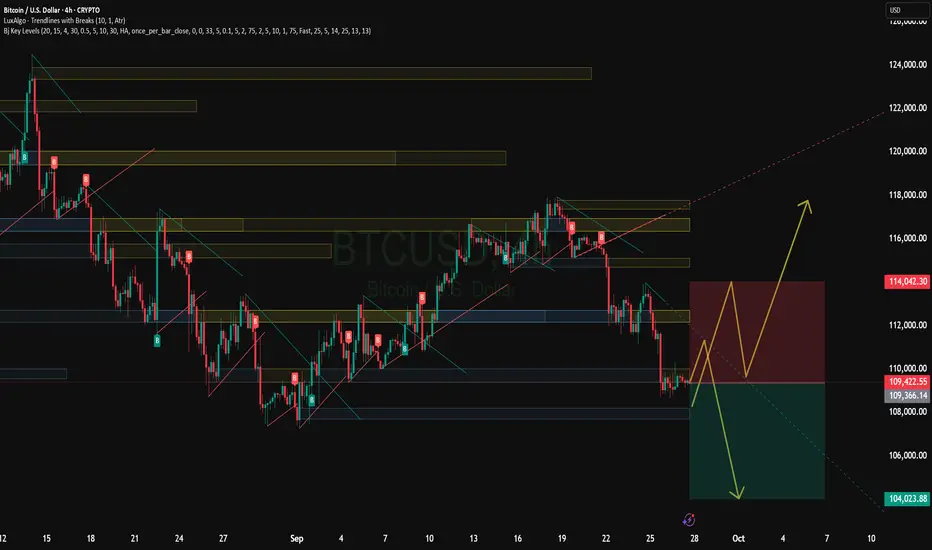
BTC SWING SELL IDEA 🟥 BTCUSD – SELL (SWING SETUP)
🚦 Bias: BEARISH (Short)
🎯 Entry Zone: 109,200 – 109,600 (Current Price ~109,400)
🛑 Stop Loss Options:
• Conservative (tighter risk): 116,465
• Original swing stop: 124,619
🏁 Take Profits:
• TP1: 108,000
• TP2: 101,500 – 100,800
• TP3: 94,000 – 93,200
• TP4: 85,500 – 84,700
• TP5: 75,250 (Final Target)
📊 Setup Notes:
Two stop options depending on your risk appetite.
Larger RR if using the wide swing stop, but the tighter stop offers reduced downside exposure.
Structure remains bearish as long as price stays under 113.5k – 115k zone.

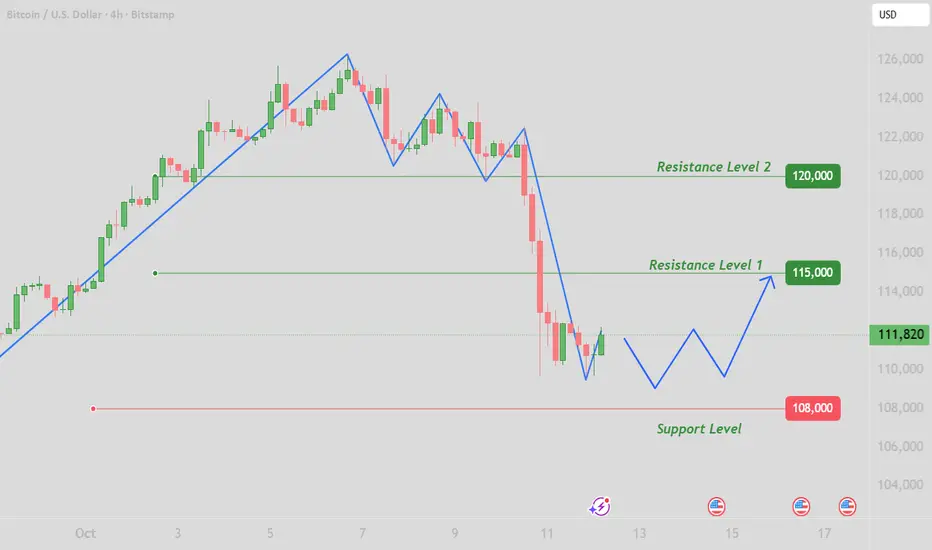
BTC Possible Scenarios for the WeekPossible Scenarios for the Week
Bullish scenario: BTC holds support at $110,000, breaks through $120,000, and heads toward $125,000-$130,000.
Sideways/consolidation: Movement between $110,000 and $120,000 without a clear direction.
Bearish scenario: Break below $110,000 — test of $105,000 and below.
Risks and factors to monitor
Fed policy and rate announcements can significantly influence the trend (as a driver for the USD).
Trading volumes: Weak volumes during breakouts may be false.
US macroeconomics, inflation, geopolitics — increased tensions could trigger volatility.
BTCUSD Bearish Flag Continuation: Short Setup Targeting $100,000Bearish Flag/Channel: The chart shows price action forming a downward-sloping, parallel channel after a prior drop (which isn't fully visible but implied by the setup). This pattern is commonly referred to as a bearish flag or descending channel, which is typically a continuation pattern.
Implication: A bearish flag/channel suggests that after this consolidation phase, the price is likely to break to the downside and continue the previous move lower.
Short Trade Plan
The chart outlines a specific short entry, stop loss, and profit target based on the potential bearish continuation:
Entry Point: $118,228.59
Interpretation: The trader is looking to enter the short trade on a retest of a previous resistance level or the top of the consolidation range, specifically a level around the potential breakdown area.
Stop Loss: $121,395.17
Interpretation: This is the price level where the trade would be closed to limit losses. It sits just above the entry point and the consolidation high, likely to protect against a false breakdown or a strong move back up.
Target Point: $100,481.05
Interpretation: This is the profit-taking level. It appears to be based on a measured move of the bearish flag pattern, projecting the distance of the "pole" (the move before the flag) downward from the breakdown point. It also aligns closely with the major psychological level of $100,000.
Risk/Reward
The setup, as drawn, shows a relatively favorable risk-to-reward ratio, which is generally a good characteristic for a trade:
Risk (from Entry to Stop Loss): $121,395.17 - $118,228.59 ≈ $3,166.58
Reward (from Entry to Target Point): $118,228.59 - $100,481.05 ≈ $17,747.54
Approximate R:R: 17,747.54/3,166.58≈ 5.6 to 1
Current Price Context
The current price at the time the chart was taken is $109,401.93.
This means the price is currently well below the proposed entry point of $118,228.59.
The price is sitting within the lower half of the drawn descending channel (bearish flag).
Possible Scenarios from Current Price:
Immediate Continuation: The price could break the lower boundary of the channel from its current position and head directly toward the target. In this case, the drawn trade setup would be missed, and the trader might look for a different entry on a retest of the broken channel.
Execution of Setup: The price could rally back up toward the upper boundary of the channel and the $118,228.59 entry point before reversing and heading down. This would allow the trade plan to be executed as intended.

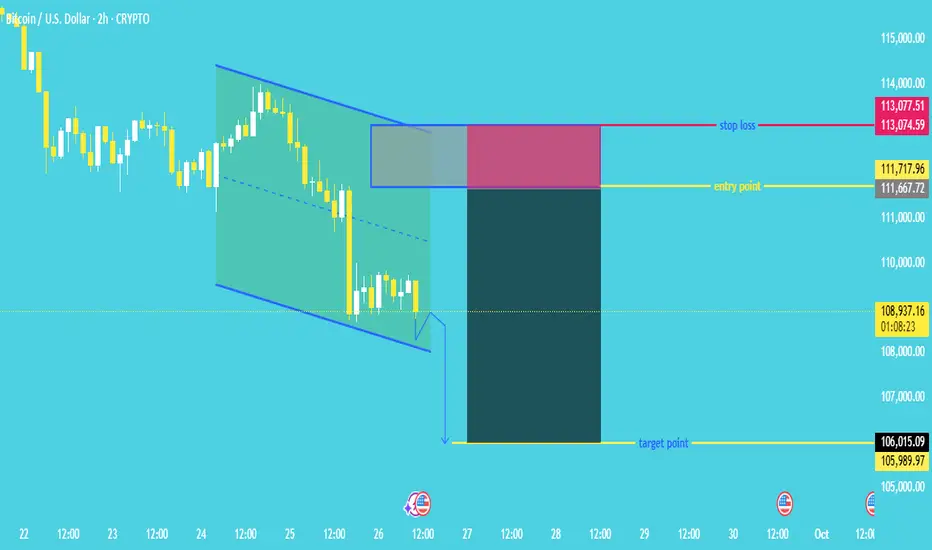
"Bitcoin Bearish Continuation Pattern: Short Entry on Retest"Chart Pattern
The price is moving within a descending channel (highlighted in blue and green), which typically signals continuation of the current downtrend.
A breakout to the downside of the channel seems to be forming (small breakout candle drawn outside the channel).
🔽 Trade Setup: Short Position
This is a short trade setup, meaning the trader expects the price to go down.
🔸 Entry Point
Entry Zone: Between 111,667.72 and 111,717.96 USD
This is above the current price, suggesting a pullback entry (waiting for a slight retracement before shorting).
🔹 Stop Loss
Stop Loss Zone: Between 113,074.59 and 113,077.51 USD
Placed above the channel and the entry point to protect against invalidation.
🟢 Target Point (Take Profit)
Target Zone: Between 105,989.97 and 106,015.09 USD
The expected price move is based on a measured move or projected breakdown from the channel.
🧮 Risk to Reward Ratio
The risk/reward box (red for risk, green for reward) shows a positive risk-reward ratio, likely around 1:2 or better, which is favorable in trading.
✅ Analysis Summary
Trend: Bearish (descending channel, lower highs and lower lows).
Setup: Short position on pullback into resistance zone.
Target: 106,000 area.
Stop: 113,000 area.
Current Price: Around 108,905.09 USD.
📌 Final Thoughts
The setup assumes the breakdown from the channel is valid.
A retest of the breakdown zone (entry point) is anticipated before continuation downward.
Be mindful of potential false breakouts or sudden bullish reversals.