BTCUSD: Narrow-range consolidationToday, BTCUSD overall showed a trend of bottoming out with a slight rebound followed by a narrow-range consolidation, with price movements being volatile and fluctuating. In the morning, prices remained under pressure, fluctuating below 103,500, then rebounded quickly, but the upward momentum was weak, encountering obvious resistance below 105,500.
The short-term resistance above focuses around 106,000. Only a breakthrough of this level accompanied by increased trading volume can confirm a short-term reversal signal. Further resistance can be watched at 108,000; a firm hold above this level would give bulls the opportunity for a sustained rebound.
For support below, close attention should be paid to 102,000. If this support level is breached, prices may further test 99,800. As a key psychological and technical support level, a break below 100,000 could trigger more stop-loss orders, exacerbating downward pressure.
Currently, BTC's short-term trend is relatively weak but supported, and it is likely to consolidate in the 102,000 - 105,500 range.
In terms of operation, it is recommended to adopt a strategy of buying low and selling high with quick entries and exits. Do not blindly chase the upward trend; instead, patiently wait for prices to break through key ranges with increased volume and for the trend to clarify before adjusting positions to reduce trading risks.
Trading Strategy:
Buy 103,000 - 103,500
SL 102,500
TP 104,500 - 105,000 - 105,500
Sell 105,500 - 106,000
SL 106,500
TP 104,500 - 104,000 - 103,500
Btcusdshort

Will Bitcoin goes for 14500? WeeklyThis is the last analysis's weekly time frame chart.
Everything is clarified in the chart you can see upgoing and downgoing cycles after every bitcoin halving.
RSI had a downward breakout the red RSI trend line named T1 and pull backed to it in the weekly timeframe where you can see a little red rectangle and arrow there. The continuation of the RSI path is probably like the blue line drawn named R1.
About the BTC price, I am expecting the price to reach 14500 - 19000 dollars until Dec 2022. of course, it can reach that target a few months earlier or late.
Note that before Halving 2024 bitcoin will not have ATH. It means before Apr 2024 bitcoins price will be under the 69000 and even maybe 50000 dollars. After that time the price will go to 120000 dollars.
Do not forget that the trend of the bitcoin and crypto market is still downward and bearish.
You can see my idea about this analysis in a monthly time frame in another published idea on my profile page.

BTC/USD Bullish Pennant – Breakout Entry Setup✅ BTC/USD Pennant Breakout – Technical Analysis
Chart Breakdown
The chart shows Bitcoin forming a bullish pennant pattern on the 45-min timeframe.
A pennant typically forms after a strong impulsive move (pole), followed by price compression between:
Descending trendline (upper)
Ascending/flat trendline (lower)
This usually signals continuation in the direction of the previous trend, which in this case is upward.
Key Levels
Entry Zone: Just above the pennant resistance (breakout zone).
Stop-Loss: Below the pennant support — good risk management.
Target: Projected by measuring the previous impulse (the pennant pole) and extending it upward.
Market Signals
✔ Price is squeezing near the apex — breakout imminent.
✔ Buyers appear to be defending the lower trendline.
✔ If price breaks and closes above resistance, upside continuation becomes likely.
✘ But if price rejects and falls below support, the setup invalidates.
Bias
Bullish Continuation – If breakout occurs with strong volume.
✅ Title Suggestion
“BTC/USD Bullish Pennant – Breakout Setup Forming”

BTCUSD: Stabilize above 105,000BTC rose to break through and stabilizing above 105,000 today, surpassing last week's short-term resistance level. Next, we will focus on whether the key resistance level at 108,000 can be broken.
We predict that Bitcoin's movement today will fluctuate within the range of 104,000-108,000. If it can sustain a breakthrough above 108,000, we expect an upward trend to emerge this week.
Buy 103,000 - 103,500
SL 102,500
TP 104,500 - 105,000 - 105,500
Sell 105,500 - 106,000
SL 106,500
TP 104,500 - 104,000 - 103,500


Bitcoin Faces Rejection — Targeting 101,300 SupportBitcoin (BTC/USD) is showing a potential bearish setup around the 103,000 level, with resistance near 104,500. A pullback is expected, targeting the 101,300 support area for a possible short-term decline.
Title: Bitcoin Bearish Rejection Toward 101,300 Target

BTCUSD: The resistance level at 105,000 remains firmBTC rebounded above 104,000 on Friday but then came under pressure and pulled back. It traded in a narrow range between 101,400 and 104,000 throughout Saturday, which also confirms the accuracy of our prediction about the resistance level at 105,000. Bitcoin can only see sustained gains if it breaks through 105,000 and stands firmly above 108,000.

BTCUSD: Overall trend is moving downwardLooking at the candlestick chart, Bitcoin has formed a potential M-top or double top pattern, which is a typical top reversal signal. Currently, the price has broken below all short-term moving averages, indicating obvious weakness.
Yesterday, it is consistent with my analysis. BTC broke below the short-term support at 102,000, fell to around 100,000 where it found support and rebounded. However, this also showed an overall downward shift in the trend, with yesterday’s short-term support at 102,000 having turned into today’s resistance.
Overall, I predict that Bitcoin will continue its overall downward trend today. The short-term support is at 100,000, and a break below this level would target 98,000.
For resistance above, we still focus on 105,000 in the short term, with key attention on 108,000. Only a breakthrough and a firm hold above 108,000 could lead to sustained gains.
Buy 100,000 - 100,500
SL 99,000
TP 102,000 - 102,500 - 103,000
Sell 103,500 - 104,000
SL 104,500
TP 102,000 - 101,500 - 101,000

BTCUSD: Consolidation is the main theme todayYesterday, BTC saw intense battles around the psychological threshold of 100,000. During the session, it once broke below the key support at 99,500, then rebounded to around 104,000.
Today, it pulled back to around 102,000 at the opening of the Asian session and began to consolidate again.
On the upside, the 105,000-105,500 zone forms a crucial resistance range. Only a daily close firmly above this level can confirm the reversal of the short-term downtrend. For today's short-term support, we still focus on 100,000. If it breaks below 100,000, we need to pay key attention to the supporting role of 98,000.
Buy 100,500 - 101,000
SL 100,000
TP 102,000 - 102,500 - 103,000
Sell 103,000 - 103,500
SL 104,000
TP 101,500 - 101,000 - 100,500

BTC/USD) Bearish trend analysis Read The captionSMC Trading point update
Technical analysis of BTC/USDT (4-hour timeframe). Here's the idea breakdown:
---
1. Overall Structure
The price is moving within a descending channel, suggesting a broader downtrend.
The two black trendlines show clear lower highs and lower lows forming.
---
2. Key Zones & Indicators
Blue Zone (104,000–106,000 region):
This is a major supply/resistance zone where price has repeatedly rejected.
The two red arrows mark failed attempts to break above it — confirming strong bearish pressure.
EMA 50 (blue line) and EMA 200 (black line):
Price is trading below both EMAs, confirming bearish market structure.
The 50 EMA is below the 200 EMA, indicating a bearish crossover (momentum continuation signal).
---
3. Expected Move
After the recent rejection from the supply zone, the chart projects a bearish continuation:
A possible small pullback or consolidation.
Then a drop toward the target area near $90,099, which aligns with the lower boundary of the channel (major support).
---
4. Target
Target Point: Around $90,100, which could be the next liquidity zone or potential demand area.
---
5. Summary
Trend: Bearish
Structure: Lower highs & lower lows (descending channel)
Bias: Continuation to the downside
Confirmation: Rejection from supply + EMA resistance alignment
Target: $90,100
Mr SMC Trading point
---
Trading Idea Summary:
“BTC is maintaining a bearish structure under EMA resistance and rejecting the 104–106K supply zone. Unless price reclaims that level, continuation toward 90K support remains the high-probability scenario.”
Please support boost 🚀 this analysis

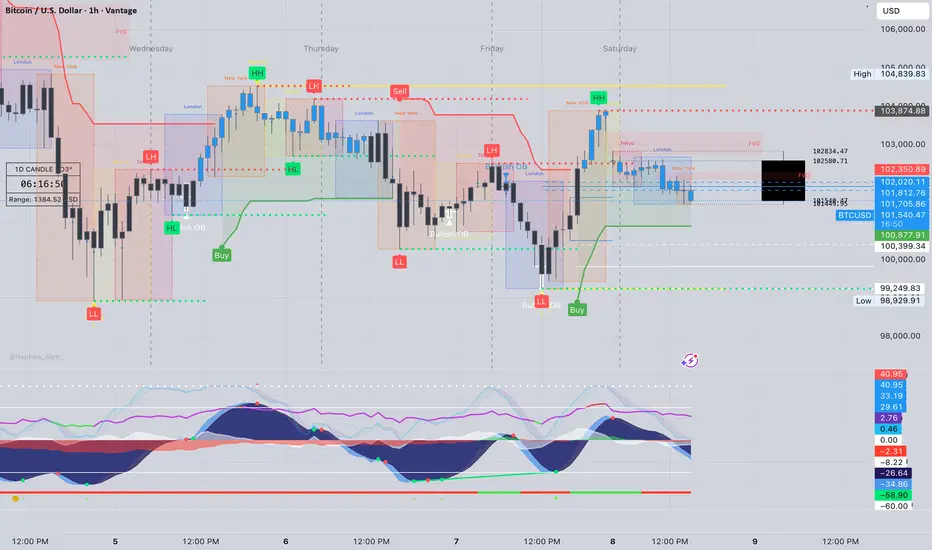
ElDoradoFx – BTCUSD ANALYSIS (09/11/2025, WEEKEND EDITION) (09/11/2025, WEEKEND EDITION)
⸻
1. Market Overview
Bitcoin (BTCUSD) remains under bearish pressure around $101,500, extending its correction from the recent $103,800 recovery peak. Price action confirms a sustained rejection at the $102,600–$103,000 supply zone, with downside continuation now favored as sellers maintain control.
The broader market context shows BTC trapped between the $102,600 ceiling and $99,200 floor, forming a descending channel. Unless bulls reclaim $102,600+, momentum remains bearish heading into next week’s macro calendar (CPI & PPI releases).
⸻
2. Technical Breakdown
🔹 Daily (D1):
• BTC continues trading below the 20EMA, 50EMA, and 100EMA — confirming sustained bearish structure.
• RSI ~38, indicating weak momentum and no signs of trend reversal.
• MACD histogram continues printing red bars, showing continuous sell-side pressure.
• Price remains within a macro range between $99,000–$108,000, with downside favored until structure shifts.
🔹 H1:
• Strong rejection from descending trendline at $102,300–$102,600.
• CHoCH confirmed to the downside below $101,800.
• EMAs aligned bearish (20 < 50 < 200).
• RSI below 45; MACD momentum fading — signals bearish continuation likely.
🔹 15M–5M:
• Structure shows lower highs and weak pullbacks.
• Minor demand zone at $101,000–$100,900; break of this level could trigger a liquidity sweep toward $99,200.
• RSI near 36 with weak MACD cross — short-term bounce possible but unsustainable without strong volume.
⸻
3. Fibonacci Analysis (Last Swing: 103,896 → 99,249)
Level Price (USD) Comment
38.2% 101,037 First retracement / initial resistance
50.0% 101,570 Mid-zone equilibrium
61.8% 102,090 Key reaction level within supply zone
🎯 Golden Zone: 101,000 – 102,090 → Acting as intraday supply zone for high-probability sells.
⸻
4. High-Probability Trade Scenarios
📉 Bearish Continuation Setup (Main Bias)
• Entry Zone: 101,900 – 102,400 (Golden Zone retest)
• TPs: 101,000 → 100,000 → 99,200 → 98,800
• SL: Above 102,600
• Confirmation: Rejection candle + RSI failure to cross 50
• Rationale: Retest of former support turned resistance within descending structure; EMAs and momentum indicators favor continuation.
💥 Breakout SELL Setup
• Trigger: 1H candle close below 100,900
• Retest Zone: 101,100 – 101,300
• TPs: 100,000 → 99,200 → 98,500
• SL: Above 101,600
• Rationale: Structural break of key demand; confirms continuation of broader downtrend.
📈 Countertrend BUY Setup (Low Probability)
• Entry Zone: 99,200 – 98,900 (Liquidity Sweep Zone)
• TPs: 100,800 → 101,600 → 102,400
• SL: Below 98,700
• Confirmation: Bullish divergence on RSI or MACD + absorption wicks
• Rationale: Potential liquidity collection zone where short covering may occur; low conviction long setup.
⸻
5. Fundamental Watch
• Weekend volatility remains thin; potential for stop-hunts before Monday’s open.
• DXY holding above 105 supports bearish sentiment in BTC.
• No major macroeconomic catalysts until early next week — expect range-bound but reactive price behavior.
• CME futures gap near $102,800 could attract a brief fill before resumption lower.
⸻
6. Key Technical Levels
Type Levels (USD)
Resistance 102,400 / 102,600 / 103,000 / 105,800
Support 101,000 / 100,000 / 99,200 / 98,900
Golden Zone 101,000 – 102,090
Break Buy Trigger > 102,600
Break Sell Trigger < 100,900
⸻
7. Analyst Summary
BTC is consolidating under the 102K–103K ceiling, showing clear exhaustion from buyers and renewed strength from sellers. The Golden Zone (101,000–102,090) offers the highest-probability sell opportunities for continuation to 99K.
Momentum, EMAs, and trend alignment all support a bearish outlook unless price cleanly reclaims 102,600+ on H1 structure.
⸻
8. Final Bias Summary
✅ Primary Bias: Bearish below 102K — selling rallies within the 101–102K zone targeting 99K.
⚠️ Secondary Bias: Bullish recovery only if 102,600 breaks with volume and structure shift confirmed.
⸻
— ElDoradoFx PREMIUM 3.0 Team 🚀
BTC is pulling back to test support levelsToday, BTC has shown an overall volatile trend. A death cross signal has appeared on the daily chart, with short-term moving averages forming a bearish alignment, indicating a short-term bearish trend.
Overall, BTC has clearly entered a correction phase in the short term, and the price may continue to test lower support levels. We will pay short-term attention to the support at 102,000, with key focus on the critical support at 100,000.
For resistance above, the short-term level is at 105,000, and the key level to watch is 108,000. If it can stand firmly above 108,000, a rebound into an upward trend may occur.
Buy 102,000 - 102,500
SL 101,000
TP 103,500 - 104,000
Sell 104,500 - 104,000
SL 105,000
TP 103,000 - 102,500

Bitcoin Sitting on Crucial 50 EMA Support!Finally, CRYPTOCAP:BTC has reached a key confluence zone, sitting right on the 50 EMA support, a level that has acted as dynamic support since 2023.
Technically, I’m expecting a potential bounce from here. However, if the current candle fails to reclaim this support, we could see a deeper correction, especially with ongoing geopolitical uncertainty weighing on the market. 📉
DYOR, NFA
Thanks for reading! Appreciate your support and engagement

Important Buy Signals and Analysis for BTCUSDBitcoin Technical Analysis and Signals: After Bitcoin's sharp drop below the $100,000 mark, it has recovered. However, a pullback to confirm support cannot be ruled out. Traders should pay close attention to the $102,300-$101,400 support level for potential buying opportunities. This support area is crucial; a valid reversal here could lead to a price increase towards the $105,400-$106,500 resistance zone. Selling opportunities may arise upon reaching this resistance zone, depending on real-time market conditions.

Educational BTC Analysis: Decoding BTC's Wave (C) DownHello Friends, Welcome to RK_Chaarts.
Today we are going to understand Elliott Wave Teaching Points from the BTCUSD Daily Chart,
This chart sequence perfectly illustrates the difference between motive (impulse) and corrective waves, as well as the important structures and rules of a larger correction.
1. The Structure of a Corrective Pattern (A-B-C)The Big Picture: The overall movement, labeled Intermediate Wave (A), (B), and (C) (Blue), is a three-wave corrective pattern. This type of pattern moves against the trend of one larger degree (which have been an uptrend). The three-wave (A-B-C) structure is the classic way markets move in a counter-trend. Wave (A): The initial counter-trend move.Wave (B): A bounce or retracement that moves back in the direction of the previous trend, but fails to reach the start of Wave (A).Wave (C): The final, and often most powerful, leg of the correction, which is designed to complete the retracement. This wave is always structured as a five-wave impulse.
2. The Rule of Subdivisions: Corrective Waves are Internally Motive, Wave (C) is an Impulse: The report states that Intermediate Wave (C) is expected to unfold as a five-wave impulse sequence of a Minor Degree (Red) (Minor Wave 1, 2, 3, 4, 5).
Learning Point: This highlights a fundamental Elliott Wave rule: the C-wave of an A-B-C correction is a motive wave (it has a five-wave internal structure) because its purpose is to create strong directional progress and complete the larger correction. This is commonly known as a Zigzag correction (which has a 5-3-5 internal count for A-B-C).
3. Identifying the Strongest Move (Wave 3)
The Current Phase: The market is currently in Minor Wave 3 (Red) downwards.
Learning Point: In Elliott Wave theory, Wave 3 is typically the longest and never the shortest of the three motive waves (Waves 1, 3, and 5). This means the analysis anticipates the current move to be the most directional, high-momentum, and volatile part of the entire Intermediate Wave (C) correction. This is the "sweet spot" for trend traders.
4. The Principle of Alternation (Predicting Wave 4)
Upcoming Wave: The analysis projects a shallow Minor Wave 4 (Red) rebound.
Learning Point: While the chart doesn't show Wave 4 yet, this prediction is often guided by the Principle of Alternation. If the preceding corrective wave (Minor Wave 2) was a sharp, deep correction, the next corrective wave of the same degree (Minor Wave 4) is expected to be a sideways, shallow, or complex correction (like a flat or triangle). The prediction of a "shallow" wave 4 suggests Minor Wave 2 was likely a deeper, sharper retracement.
5. The Critical Invalidation Rule
The Invalidation Level: The report sets the critical invalidation price at 74,223, which represents the low or starting point of wave ((1)).
Learning Point: Wave ((2)) can never retrace more than 100% of Wave ((1)). By identifying a specific price level, we can assume that our study says price should not broke below that particular level, it provides traders with clear risk management parameters.
I. Current Wave Count Status
The analysis indicates that the previous upward corrective structure, designated as Intermediate Degree Wave (A) and Wave (B) (Blue), is complete. The market is now engaged in a significant downward movement within the larger Intermediate Degree Wave (C) (Blue).
This Intermediate Wave (C) is expected to unfold as a five-wave impulse sequence of a Minor Degree (Red) to the downside, fulfilling the final leg of the overall corrective cycle.
II. Detailed Downward Projection
The Minor Degree five-wave structure within Intermediate Wave (C) is currently positioned as follows:
Minor Wave 1 and Minor Wave 2 (Red): These waves are identified as complete.
Current Phase: The market is now unfolding Minor Wave 3 (Red) downwards, indicating the strongest portion of the bearish move is in progress.
Anticipated Completion: Following the completion of Minor Wave 3, the analysis projects a shallow Minor Wave 4 (Red) rebound, followed by the final impulse move, Minor Wave 5 (Red), to complete the entire Intermediate Wave (C) correction.
The ultimate completion of Intermediate Wave (C) will signal the end of the larger-degree correction (labeled as a corrective wave (2)).
III. Critical Invalidation Level
The integrity of this bearish wave count is contingent upon the price action respecting a critical support level.
Invalidation Price: 74,223
Significance: This price point represents the extreme low or starting point of wave ((1)), so Wave ((2)) correction Should not breach this level as per wave principles, if it makes lower low below 74,223 on the lower side, the current Elliott Wave analysis would be invalidated, requiring a revision of the entire wave structure and market outlook.
I am not Sebi registered analyst.
My studies are for educational purpose only.
Please Consult your financial advisor before trading or investing.
I am not responsible for any kinds of your profits and your losses.
Most investors treat trading as a hobby because they have a full-time job doing something else.
However, If you treat trading like a business, it will pay you like a business.
If you treat like a hobby, hobbies don't pay, they cost you...!
Hope this post is helpful to community
Thanks
RK💕
Disclaimer and Risk Warning.
The analysis and discussion provided on in.tradingview.com is intended for educational purposes only and should not be relied upon for trading decisions. RK_Chaarts is not an investment adviser and the information provided here should not be taken as professional investment advice. Before buying or selling any investments, securities, or precious metals, it is recommended that you conduct your own due diligence. RK_Chaarts does not share in your profits and will not take responsibility for any losses you may incur. So Please Consult your financial advisor before trading or investing.

Bitcoin ShortBitcoin is looking to retest the 98200 support and if broken, would be headed to 76550-75000 area on this current weekly structure. Be careful guys.

BTC continues to correct below 100k🟠 BTCUSD Technical Plan
Current Price: 101,960
Overview: BTC continues to follow a downtrend structure, with each lower high being rejected from the descending trendline (marked with red arrows). The market recently broke below key Fibonacci support and is now trading around the 1.0 extension level near 100,950.
📉 Short-term Expectation:
Price may retest the broken support zone around 104,700 – 105,800 (Fib 0.5–0.618 + EMA zone).
This area is expected to act as strong resistance where sellers may re-enter the market.
If the rejection is confirmed, BTC could continue dropping toward the 95,200 – 94,700 support zone (1.618 extension).
📈 Alternative Scenario (Bullish Correction): If price breaks above 105,800, a short-term correction could extend toward the trendline resistance near 111,400 before another potential reversal.

Bitcoin - The devastating top formation!💎Bitcoin ( CRYPTO:BTCUSD ) is creating a top:
🔎Analysis summary:
In the end of 2022, we witnessed another perfect bullish break and retest on Bitcoin. This retest was followed by an incredible rally of +600%. But slowly, Bitcoin is retesting a massive curve resistance, which has been pushing price lower for the past 15 years.
📝Levels to watch:
$100,000 and $50,000
SwingTraderPhil
SwingTrading.Simplified. | Investing.Simplified. | #LONGTERMVISION

BTC/USD poised to navigate deeper water?Following a 4.6% fall in October, November is already down by 5.2%, with today’s movement dipping a toe under key support between US$104,866 and US$107,692 (1M levels). This follows a rejection of resistance at US$116,344-US$114,530 (composed of 1M and 1W levels), and suggests the major cryptocurrency is headed back under US$100,000.
Below US$104,866-US$107,692, which could serve as resistance soon, limited support is evident until between US$93,902 (3M) and US$97,578 (1M). Therefore, further bearish scenarios could soon unfold.
Written by the FP Markets Research Team

BTC faces a crash, can it hold the $100000 mark?#BTCUSD BITSTAMP:BTCUSD BINANCE:BTCUSDT BITSTAMP:BTCUSD BINANCE:BTCUSDT
Affected by market news, BTC's hourly chart showed a large bearish candlestick, falling to a low of around 104000. Currently, regardless of the time frame, BTC has reached the lower Bollinger Band area, and all moving averages across different timeframes are trending downwards in tandem, with the MACD indicator showing a bearish crossover and increasing volume. There are no signs of a technical reversal yet, and in the short term, BTC still has room for further downward correction.
If 104000 is breached again, BTC may further decline to 102000-101000, or even the psychological level of 100000. It's only a matter of time, and the bulls will temporarily back down.
Therefore, if BTC rebounds to 105500-106500 in the short term, shorting BTC can be considered.

Market volatility, why I dare to be bullish on BTC#BTCUSD BITSTAMP:BTCUSD BINANCE:BTCUSDT
The BTC market has been declining since yesterday's US session, with a sharp drop following Powell's hawkish comments, hitting a low of around 106,500. Institutional trading activity has decreased in the short term, suggesting a deliberate wait-and-see approach, anticipating further price corrections before re-entering the market. Therefore, do not blindly participate in trading in the short term.
The current BTC market may seem bustling, but it is actually rife with undercurrents. A new direction will only be established when sentiment reaches its peak and volatility subsides. Perhaps the next real starting point will not be in the current clamor, but after the cheers of retail investors subside. Pay attention to the performance of the downward channel support level of 160,000-104,500. If it pulls back to this range, you can consider establishing a small long position.

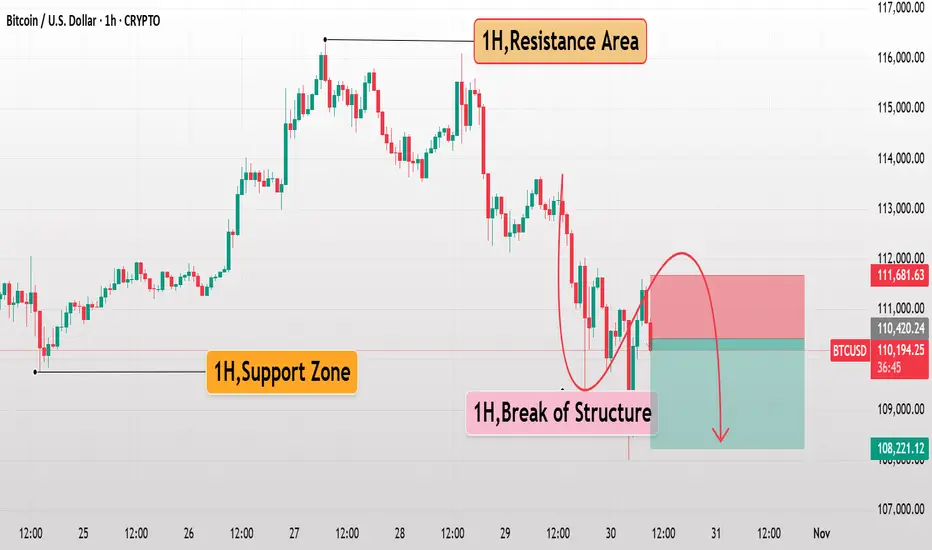
Bitcoin Bearish Setup After Structural BreakBitcoin continues to trade in a bearish structure, forming lower highs after a clear break of the structure from the resistance area. A short-term retest toward the 1H resistance provides a potential swing sell opportunity targeting the next support zone as sellers remain active below key levels.
Key Levels:
Sell Entry: 110,400
Take Profit: 108,200
Stop Loss: 111,700
Reasoning:
Technically, price action confirms a shift in market structure as BTC/USD fails to maintain bullish momentum and breaks below previous support. The 1H chart clearly shows sellers defending the resistance area, suggesting further downside continuation.
Fundamentally, Bitcoin remains under pressure as the U.S. dollar strengthens and global risk sentiment weakens. Investors are turning cautious ahead of upcoming U.S. economic data, favoring safe-haven assets and reducing crypto demand.
Disclaimer:
This analysis is for educational purposes only and not financial advice. Always manage risk and follow your own trading plan before executing any trade.
Today's Bitcoin Trading StrategyTechnical analysis: "Support loop + reversal signal", with clear bottom characteristics
The price has reached the key support area: the 110802 USD is located at the upper edge of the strong support range of 107000 - 110000 USD, and is close to the final barrier of the deep correction at 110300 USD. After falling to 107375 USD on October 17th and then rebounding rapidly, it verified the承接 strength of this range. More importantly, the daily chart presents a positive signal: the MACD histogram is contracting towards the zero axis, negative momentum is continuously weakening, RSI is rising from the oversold range to the neutral zone, and the gap between the 9-day and 20-day EMAs is continuously narrowing, which is expected to form a bullish crossover. Historical data shows that after such a "support stabilization + indicator recovery" combination occurs, the probability of a rebound within 7 trading days is 78%.
Today's Bitcoin Trading Strategy
buy:110000-111000
tp:112000-113000
sl:108500
