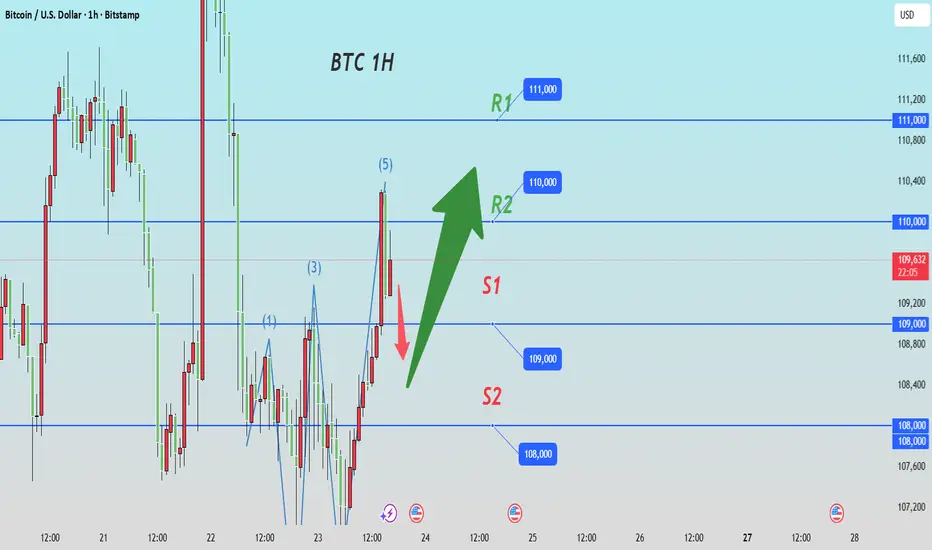
BTC: The overall trend remains oscillating upwardThe BTC is staying in the middle of the "support-resistance" range, with intense long-short competition, the overall trend remains oscillating upward
From a technical pattern perspective, the short-term support lies between 109,000 and 108,000. There have been multiple rebounds after stabilizing in this support range, indicating relatively strong buying support below. The resistance level at 113,000, as a previous pressure level, could open a new upward space toward 115,000 if it is broken with volume.
Considering the macroeconomic factors, if market risk appetite rises, Bitcoin is expected to test the resistance level upward based on the support range. If risk aversion heats up, we need to be vigilant about the risk of a pullback to test the support.
💎Trading Strategy:
Buy 110,000 - 110,500
SL 109,500
TP 111,000 - 111,500 - 112,000
Sell 112,000 - 111,500
SL 111,000
TP 110,500 - 110,000 - 109,500
Daily-updated accurate signals are at your disposal. If you run into any problems while trading, these signals serve as a reliable reference—don’t hesitate to use them! I truly hope they bring you significant assistance
Btcusdshort

Today's Bitcoin Trading StrategyThe "extremely imbalanced" futures long-short structure: According to Coinglass data, the ratio of long and short positions in perpetual contracts has risen to 1.8:1, reaching a new high in the past three months. Moreover, the position volume has surged by 12% in a single day to 4.8 billion US dollars - in this "overcrowded" state of long positions, if a liquidation wave is triggered, the price is prone to cause a chain of declines. More importantly, the volume and position volume show a "volume decline and position increase" characteristic, indicating that the current rise is not driven by new long positions entering the market, but rather caused by the passive reduction of short positions by the bears. The risk of a reversal is extremely high.
Today's Bitcoin Trading Strategy
BTC @ sell115000-115500
tp:113000-113500
sl:116500

BTC/USDT: Bearish Drop to 108,500?BINANCE:BTCUSDT is signaling a bearish breakdown on the 1-hour chart , where price is trapped in a descending triangle formed by a downward trendline and an upward trendline, with increasing pressure at the convergence point near resistance—indicating potential for a downside continuation if sellers dominate. This classic pattern suggests weakening bullish momentum amid recent pullbacks.
Entry zone between 112,500-114,000 for a short position. Target at 108,500 near the support zone, offering a risk-reward ratio of 1:2 . 📊 Set a stop loss on a close above 114,500 to protect against an upside breakout. 🌟
Look for confirmation on a break below the entry with surging volume, capitalizing on Bitcoin's current choppy range.
Fundamentally , Bitcoin has seen high volatility recently, hitting new all-time highs above $125K earlier this month before dropping to around $105K, now stabilizing near $111K amid mixed macro signals and uncertainty from large holder movements. Additional catalysts include ancient wallet awakenings transferring billions in BTC and ongoing debates on tokenized gold versus Bitcoin's value. 💡
📝 Trade Plan:
✅ Entry Zone: $112,500 – $114,000 (short zone near resistance)
❌ Stop Loss: Close above $114,500
🎯 Target: $108,500 (major support area)
💎 Risk-to-Reward: Approx. 1:2 – clean, structured short setup within a bearish pattern.
What's your take on this setup? Drop your thoughts below! 👇

The buying opportunity is clearerThe current price of $111,286 is in a stage of oscillation and accumulation. On the surface, it seems to be fluctuating without direction, but in reality, there is a solid support below. The bulls have sufficient confidence. The main reasons are two:
The "supporting force" below is very stable: After Bitcoin dropped from $12.6 million to over $10.4 million recently, it quickly rebounded. This indicates that there is a strong support at around $10.5 million. Around $110,000 is the "transitional station" of the recent correction, and when it drops to this level multiple times, there will be funds entering to take over, and the selling pressure has been released to a large extent. In addition, 80% of Bitcoin is held for more than one year, and holders are reluctant to sell easily, further strengthening the bottom.
Institutions are still continuously "purchasing": The Bitcoin ETFs of giants like BlackRock have been accumulating shares. The highest weekly inflow can reach $324 million. Currently, the Bitcoin held by these ETFs already accounts for 6.74% of the total supply. More importantly, the amount of Bitcoin purchased by institutions each day is far more than the new Bitcoin mined by miners. There are fewer and fewer Bitcoin available for trading in the market. As long as the buying pressure slightly increases, the price is likely to rise.
Today's Bitcoin Trading Strategy
BTC @ BUY109000-111000
tp:112000-113000
sl:107000

BTC: Correct prediction today👏Our prediction for Bitcoin's short-term fluctuation characteristics has also been accurately validated today.
✔We indicated that it would fluctuate around the key range in the short term, and in reality, Bitcoin has shown obvious wide-ranging fluctuations today, which is in complete alignment with the preset oscillation pattern.
✔Meanwhile, the market's competition for key levels has also confirmed our judgment:after testing the high level, the price gradually pulled back and then rebounded, highlighting the suppressing effect of the upper resistance. Moreover, the "V-shaped" rebound trend during the session has further verified the effectiveness of the short-term support range, which is highly consistent with our core prediction logic that Bitcoin is in a "shock adjustment phase, with price movements dominated by key levels".

Today's Bitcoin trading strategyWhere is the confidence to go long?
There is no need to worry about "whether it will fall". Now there are three clear signals supporting the long position, and the risks are controllable:
Large funds are "holding the bottom", and the price won't fall: Several major global institutions are buying, an American pension fund increased its position by 800 million US dollars in a single week, the largest Bitcoin ETF has invested 500 million US dollars in three days - these funds will not cause a sharp price drop. When it fell to 106,000, it was pulled back because large funds stepped in to take over. Below 108,000 is basically a "safe zone".
Regulation "doesn't cause chaos", but gives confidence: The EU just set rules for Bitcoin transactions, platforms need to register and the flow of funds should be transparent. Many investors feel that "it's formalized and they can enter now"; although some countries in Asia have inspected illegal platforms, it did not trigger a sharp drop, indicating that the market is not afraid of such minor negative events, and the sentiment is improving.
Ordinary investors are "waiting to buy bottom", and there are buyers: Many people think that from 102,000 to 109,700 is not the peak yet, they are waiting for a correction to around 108,000 to enter, so every time it drops to 108,500, there is buying coming in, it won't keep falling - this is equivalent to adding a "buffer" for the long position, not worrying that after buying, there will be no one to take it over.
Today's Bitcoin Trading Strategy
BTC @ buy :108000-109000
tp:110000-111000
sl:106000
BTC:Oscillating upward📈The BTC price shows an oscillating upward trend, with the low points gradually rising. However, trading volume has slowed down, indicating a strong wait-and-see sentiment in the market.
📝On the daily chart, after a sharp decline on the 22nd, the rebound momentum on the 23rd was weak, and the market is still in a consolidation phase overall. It is necessary to pay attention to whether it can break through the key moving averages.
💡From the perspective of moving averages, the value of MA10 is greater than that of MA30, indicating a certain upward tendency in the short-term trend.
🎉The intraday support range for BTC is around 105,500–106,000, and the intraday resistance range remains around 111,000–111,500.
💎Trading Strategy:
Buy 107,500 - 108,000
SL 106,500
TP 109,000 - 110,500 - 111,000
Sell 110,000 - 110,500
SL 111,000
TP 109,500 - 108,500 - 107,500
Daily-updated accurate signals are at your disposal. If you run into any problems while trading, these signals serve as a reliable reference—don’t hesitate to use them! I truly hope they bring you significant assistance

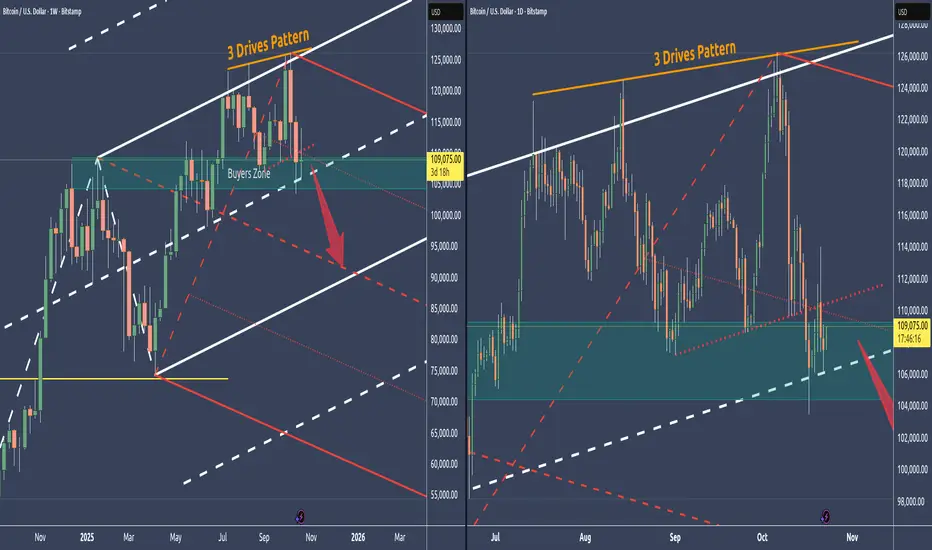
Bitcoin - We've reached the last line of support🔱 The Buyers’ Zone represents the last major support before price potentially drops toward the red centerline. 🔱
👉 The 3-Drives pattern, signaling exhaustion in the current move.
👉 Broader markets are highly stretched; a broader trend reversal would likely pull Bitcoin down with it.
👉 The slanted support line in the dayli chart is now resistance that could not be washed away.
Given these conditions, there’s a strong possibility that this final support zone won’t hold, leading to a deeper flush.
For targets I see the red Centerline, and even the L-MLH, which gives us a natural support.
Stay sharp and trade safe—wishing you a profitable week ahead
BITCOIN - Clear bearish sign!Bitcoin is currently forming a clear corrective pattern — a rising wedge that has broken downward, retested the breakdown, and is now continuing a gradual decline.
This correction is expected to bottom around the $85K level, after which Bitcoin will likely enter a consolidation phase, form new structures, and we’ll keep updating the outlook as new developments occur.
Also, note that the EMA 25 just crossed below the EMA 50, forming a death cross — a bearish signal.
You can consider entering a short position from here, but keep your leverage low and wait for a slight pullback before entering the trade.
Many people won’t like what I’m saying — they’ll tell you “Bitcoin is heading to $200K!” — but that’s just the nature of the market. Everyone sees what they want to see.
Corrections, retracements, and emotional reactions are all part of the cycle. The smart ones are those who read the structure, not the hype.
Best Regards:
Ceciliones🎯

BTC: Shows an obvious volatile trendToday, BTC’s situation is relatively complex, with intertwined bullish and bearish factors, showing a volatile trend.
Price Movement: There has been sharp volatility, with rapid rises and falls. From the hourly chart, the price surged to around 114,000 last night, followed by a significant pullback from the highs, retesting the key support level around 107,500.
Influencing Factors:
News: The Federal Reserve held a meeting with payment companies to facilitate better institutional access to the stablecoin sector. This news triggered a short-term surge in Bitcoin prices. However, subsequent remarks by Trump proposing a 155% tariff led to a price decline. The uncertainty in news has had a significant impact on the market.
Market Sentiment: The fear index stands at 25, indicating a tendency toward panic in market sentiment. Additionally, the large traders’ long-short ratio shows a slight dominance of bears at 52.34%, reflecting relatively stronger short-term bearish momentum in the market.
Capital Flow: U.S. Bitcoin ETFs have seen net inflows exceeding $3.6 billion this month, the highest since January. Institutions like BlackRock continue to increase their holdings, forming bottom buying support for prices. However, the total open interest across the network has reached $48 billion, highlighting high leverage risks. A sharp price fluctuation could trigger massive contract liquidations, exacerbating market volatility.
Technical Analysis: On the hourly timeframe, the MACD has re-formed a death cross pointing downward. Although the blue bars have shortened and started to turn red, indicating a partial shift in short-term momentum, bears still hold the overall advantage. The upper resistance level is around $111,000, and the lower support level is around $107,500. A break below this key support could lead to further downside.
Trading Strategy:
Focus on range-bound trading. Avoid taking positions at mid-range levels, exercise caution in chasing trends, and patiently wait for key levels to enter trades.
Buy 107,500 - 108,500
SL 106,500
TP 109,500 - 110,500 - 111,500
Sell 111,000 - 110,500
SL 112,000
TP 109,500 - 108,500 - 107,500
Daily-updated accurate signals are at your disposal. If you run into any problems while trading, these signals serve as a reliable reference—don’t hesitate to use them! I truly hope they bring you significant assistance

Perfect prediction of BTC trend, today's retracement continuesWith the emergence of the double top structure, gold and silver investors have been taking profits, and market funds have continued to flow into crypto assets led by BTC and ETH.
Historically, BTC and the broader cryptocurrency market have risen after gold peaks, driven by capital rotation.
In his opening remarks at the Federal Reserve's first Payment Innovation Conference held today, Federal Reserve Governor Waller spoke highly of cryptocurrencies and the "DeFi industry." Waller noted that the conference aims to explore how blockchain and cryptocurrency can be integrated into mainstream finance.
At the same time, the Federal Reserve also indicated that it would create a new era in the payment field, and the DeFi industry would not be doubted or despised.
Waller also revealed that he has proposed setting up a new type of account at the central bank, which he called a "payment account." Waller said he has asked the Fed to consider this new type of account, which would make it easier for businesses to access the central bank's payment channels without having to have a full master account. This move has clearly increased market attention for cryptocurrencies.
In the subsequent BTC trading market, we can once again use 109500-108500 as short-term support, and go long on pullbacks to see rebounds. Pay attention to the 113000-115000 resistance zone above. If the momentum is maintained, it may move towards 120000.
BITSTAMP:BTCUSD BITSTAMP:BTCUSD

BTC:Continuing to pull back📈Looking at the 4-hour candlestick chart, Bitcoin continued to pull back and decline today. The short-term support level remains in the 107,000-107,500 range, which has provided support multiple times during previous downward movements. If the price breaks below this range, it may further drop to around 105,000. The resistance level is in the 112,000-113,000 range; a breakthrough here is expected to open up more upward space.
📝In the long term, after Bitcoin's fourth halving in April 2024, its daily production dropped from 900 to 450 coins, with the inflation rate falling below 1% for the first time. This has further strengthened its scarcity. Combined with the surge in institutional demand, the supply-demand gap is expected to widen, supporting a long-term upward price trend.
💡However, in the short term, the contradiction between continuous institutional inflows and profit-taking by short-term holders may lead to certain price fluctuations.
💎Trading Strategy:
Buy 107,000 - 107,500
SL 106,500
TP 108,000 - 109,000 - 110,000
Sell 111,500 - 111,000
SL 112,000
TP 110,000 - 109,000 - 108,000
Daily-updated accurate signals are at your disposal. If you run into any problems while trading, these signals serve as a reliable reference—don’t hesitate to use them! I truly hope they bring you significant assistance

Correct projection for BTCThe core conclusions of my analysis on Bitcoin today have all been verified by market trends, which can be summarized in three aspects: trend prediction, key level control, and trend logic:
1-Consistency with short-term trends: It was pointed out that "the 4-hour chart continues to pull back, with short-term support in the 107,000-107,500 range". Intraday BTC has continued to fluctuate around this support zone without breaking below the key level, and it was also noted that the resistance level is around 113,000,a breakthrough here is expected to open up more upward space. Today's fluctuations are completely in line with expectations.
2-Support from long-term logic: The long-term upward logic of "strengthened scarcity and expanded institutional demand after the 2024 halving" was reaffirmed. Although short-term fluctuations were affected by profit-taking, it has not deviated from the long-term positive framework.
3-We accurately captured "the restrictive effect of support and resistance levels on prices", with no deviations in judgments on "short-term fluctuation rhythm and long-term trend direction", effectively providing clear range and direction references for trading operations.

Today's Bitcoin trading strategy, I hope it will be helpful to yGlobal Regulatory Developments
The G20 has recently released the Cross-Border Regulatory Framework for Crypto-Assets, which explicitly requires the implementation of full-process filing for Bitcoin transactions by 2026. The U.S. Securities and Exchange Commission (SEC) has initiated 3 additional lawsuits against non-compliant cryptocurrency exchanges. The European Union's MiCA 2.0 Regulation classifies Bitcoin as a "high-risk crypto-asset" and lowers the leverage limit for individual investors to 3x. This tightening regulatory environment has directly dampened bullish sentiment in the market.
Liquidity Environment
The U.S. Federal Reserve has maintained the federal funds rate at a high range of 5.25%-5.5%. The 10-year U.S. Treasury yield has exceeded 4.8%, prompting capital outflows from global risk assets back to U.S. dollar-denominated assets. According to data from CoinGecko, Bitcoin ETFs recorded a net outflow of $1.2 billion in October, marking the largest monthly outflow since March 2024. This tightening liquidity has further intensified downward pressure on Bitcoin's price.
Today's Bitcoin Trading Strategy
BTC@sell:109000-109500
pt:107000-106500
sl:112000

Bitcoin to 100k and below?!Looks like COINBASE:BTCUSD after reaching 110k level (As expected in the previews post) is now heading towards 100k level and we have to wait for market what after that.
If you are selling make sure to manage your trade. Any break above 111,700 will give us a big corrective structure upwards.
WTW 4 Golder Rules:
1) Do not jump in
2) Do not over risk/trade
3)Do not trade without Stop Loss
4) Never ever add to a losing position!
Trade with care
We Trade Waves
WTW Team
Disclosure: We are part of Trade Nation's Influencer program and receive a monthly fee for using their TradingView charts in our analysis.

Pay attention to the Payment Innovation ConferenceOn October 21, the Federal Reserve will hold a payment innovation conference that could rewrite the industry landscape, inviting top cryptocurrency companies such as Chainlink, Circle, and Coinbase to its Washington headquarters. This conference precisely targets the core players in the entire chain of stablecoins, infrastructure, and trading terminals. However, it is worth noting that if the meeting only discusses the direction without details, the BTC market may pull back in the short term.
Looking at technical indicators, the short-term MACD has broken through the signal line, reflecting a bullish change, but the divergence signal of the RSI may foreshadow a short-term pullback. Based on the above information, BTC is likely to experience a short-term correction followed by an upward trend. Focus on the lower levels of 109,700-109,300 in the short term, with key support at 107,500-106,500. Above this level, focus on the short-term resistance levels of 111,000-112,000. A break above this resistance level could lead to a move towards 114,000-115,000.
BITSTAMP:BTCUSD

BTC holds firmly above 110,000Today, BTC exhibited a trend of first declining and then rising.
At the opening, Bitcoin once dipped to 107,466, but subsequently, bulls began to gain momentum, driving the price to recover gradually. It successfully broke through the 110,000 mark and continued to rise.
From the perspective of market sentiment, the Fear & Greed Index is in the "Greed" zone, with the current index standing at 70. This indicates that despite short-term price fluctuations, the market remains optimistic about the overall trend. Such sentiment helps sustain the current consolidation and may provide momentum for a subsequent rally.
In terms of capital flows, on-chain data shows that although the overall capital flow is relatively complex, whales have recorded a significant net inflow in the latest cycle. Their inflow volume reached 207 million BTC, far exceeding the outflow volume of 160 million BTC. This strong buying power is the core driving force behind Bitcoin's ability to gain support at high levels and continue its upward trajectory.
Short-term trend forecast:
In the short term, BTC is likely to consolidate around 110,000. Attention should be paid to the resistance level near 112,000–113,000 on the upside and the support level near 107,500-107,000 on the downside. If it can break through the upper resistance, the price may surge toward the 115,000–118,000 range; if it falls below the lower support, it may drop to 105,000 or even lower.
Trading Strategy:
Buy 108000 - 109000
SL 107000
TP 110000 - 111000 - 112000
Sell 112000 - 111000
SL 113000
TP 110000 - 109000 - 108000
Daily-updated accurate signals are at your disposal. If you run into any problems while trading, these signals serve as a reliable reference—don’t hesitate to use them! I truly hope they bring you significant assistance

Correct projection for BTCBTC's movement today is fully consistent with our analysis, fluctuating upward within the range of 107,000 to 112,000. In terms of operation, it is necessary to closely follow this fluctuation range, adopt the "high short, low long" strategy, accurately seize the entry timing, and timely take profits when reaching the target level to ensure gains are locked in.

BTC:Targets set at 109,800 - 111,000 after break above 107,500As we mentioned earlier, if Bitcoin breaks above 107,500 and remains stable, a minor rebound will occur, with targets set at 109,800 and 111,000. Let’s wait and see if it can reach this target range tomorrow.

BTC: Continuing to fluctuate between 106,000 and 107,500Today, BTC continues to trade within a narrow range and has repeatedly encountered resistance at the key level of 107,500. This level can be regarded as the bull-bear divide.
If the price can break above this level and stabilize, a small rebound is expected, with subsequent target levels around 109,800 and 111,000.
On the downside, we will focus on the support level around 106,000. If the price is suppressed from above and falls below this support level, it may continue to decline.
Buy 106000 - 106500
SL 105500
TP 107000- 107500
Sell 107500 - 108000
TP 109000
TP 106500 - 106000
Daily-updated accurate signals are at your disposal. If you run into any problems while trading, these signals serve as a reliable reference—don’t hesitate to use them! I truly hope they bring you significant assistance

SELL BITCOIN Btc/Usd - Amazing low risk high reward trade!Based on our deep analysis we can see that BTC/USD Bitcoin will head to the downside. Great time to buy - it has broken major support levels + trends.

BTC: Sharp VolatilityBTC exhibited a trend of rising first and then falling, with overall intense volatility,reflecting the uncertainty and complexity of the market.
From the perspective of short-term technical indicators, after Bitcoin’s price broke below the key range of 109,000–110,000, this area has now transformed into a resistance level. Currently, the price is fluctuating within the 106,000–107,000 range: it faces resistance near 107,500 on the upside, while receiving support from the 103,000–104,000 range on the downside. If the price fails to break through the 107,500 resistance level effectively, it may continue to face downward correction pressure.
Buy 106000 - 106500
SL 105500
TP 107000- 107000
Sell 107500 - 108000
TP 109000
TP 106500 - 106000
Daily-updated accurate signals are at your disposal. If you run into any problems while trading, these signals serve as a reliable reference—don’t hesitate to use them! I truly hope they bring you significant assistance

BTC Performance Recap for the week🎉This week, BTC generally exhibited intense volatility, following a trajectory of "continuing the previous uptrend first, then oscillating downward, and finally rebounding after touching support".
📝Monday: Continuing the Uptrend and Breaking Key Levels
Building on the upward momentum from the previous weekend, Bitcoin’s price smoothly broke through the key psychological level of 115,000 and did not stop there—it continued to climb to around 116,000, setting a stage of interim highs for the week’s trend.
📝Tuesday to Thursday: Oscillating Downward and Losing Key Support
The uptrend failed to sustain. Starting from Tuesday, Bitcoin entered a phase of oscillating decline; its price gradually pulled back and broke below the short-term key support level of 110,000 in the process. Downward pressure continued to release, and the weak sentiment persisted all the way to Friday.
📝Friday: Bottoming Out, Rebounding on Support, and Consolidating in a Narrow Range
On Friday, when the price further dipped to just above 103,000, it received strong support at this level and staged a rebound, easing the previous downward momentum. However, the rebound lacked strength and failed to retake the 110,000 level.
📝As of now, it remains fluctuating in a narrow range between 106,000 and 107,600.
💡It was mainly influenced by a combination of factors including macroeconomic policies, market sentiment, and technical indicators. The details are as follows:
💎Reasons for the Early Rally
1-Impact of Expectations for Fed Interest Rate Cuts
The Federal Reserve (Fed) launched an interest rate cut cycle in September 2025. The market expects two consecutive rate cuts in October and December, and the anticipated decline in both nominal and real interest rates has increased the appeal of Bitcoin as a non-interest-bearing asset. This attracted inflows of some funds, driving up its price.
2-Support from Sovereign Nations’ Strategic Reserves
The Trump administration established the U.S. Strategic Bitcoin Reserve, incorporating Bitcoin into the national economic asset framework—a move that triggered emulation by many countries. The number of listed companies holding Bitcoin globally has increased significantly, with a total of large Bitcoin holdings. This "digital gold" positioning has significantly boosted Bitcoin’s weight in global asset allocation, pushing its price higher.
3-Impact of Historical Cyclical Patterns
Over the past decade, Bitcoin has achieved an average return rate of over 22% in the month of October. In October this year, the balance of the U.S. Treasury General Account is approaching the $850 billion target, and expectations of funds flowing back into the market have also provided support for Bitcoin’s price.
💎Reasons for the Late Decline
1-Panic Triggered by Trade Policies
On October 10, U.S. President Trump threatened to impose a 100% tariff on Chinese goods, sparking market concerns about an escalation of the global trade war. Investors’ risk appetite declined, and funds flowed out of risky assets such as Bitcoin, leading to a price drop.
2-Substitution Effect of Gold
Gold prices have recently climbed to a record high above $4,300, with a cumulative increase of 18% in the past month. Due to gold’s strong momentum and lower volatility, funds have clearly favored gold more. Some investors shifted from Bitcoin to gold, suppressing Bitcoin’s price.
3-Sell-Off Triggered by Technical Breakdown
Bitcoin fell below the 2025 "realized price" level—a key technical indicator that tracks the average withdrawal price of all wallets. Sustained trading below this level triggered further sell-offs by holders seeking to limit losses. Additionally, after Bitcoin broke below the key support level of $111,000, automated trading systems and stop-loss orders were triggered, intensifying selling pressure.
4-Cascading Margin Calls Driven by High Leverage
Bitcoin’s price decline led to nearly 300,000 margin calls in the cryptocurrency market, with a total liquidation value of $1.221 billion. A large number of leveraged long positions accumulated earlier were forced to close out amid the price drop, forming a vicious cycle of "decline → margin call → further decline" and amplifying downward pressure on the price.
