BTC Trade Set Up Dec 8 2025Price is overall bearish making LH/LL on the 4h, has came up too tap into supply and now will expect price to make internal 15m bearish structure to continue lower to lower SSL and demand areas
BTCUSDSHORTS

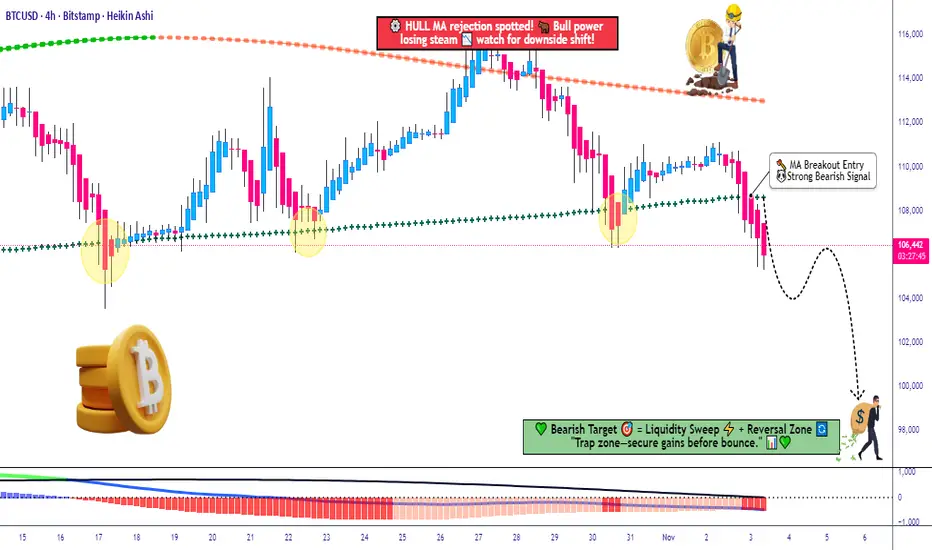
BTC/USD Breakdown Alert — MA Cross & MACD Flash Warning!💰 BTC/USD — “BITCOIN vs U.S. DOLLAR” | Crypto Market Capital Flow Blueprint (Swing Trade)
🧭 Market Overview
The king of crypto 👑, Bitcoin, is showing signs of fatigue at the top. After a solid bull sprint, we’re spotting bearish confirmation on multiple signals — a clean moving average breakout and a MACD divergence to the downside.
Looks like the market’s whispering, “It’s time for a cool-down, mate.” 😏
🎯 Trade Plan (Swing Setup)
Plan: ✅ Bearish plan confirmed — waiting for continuation pressure below structure zones.
Entry Strategy (Thief Layer Method 🕵️♂️):
Using layered limit sell orders — a signature “Thief Strategy” style of scaling in with patience, precision, and a bit of chaos theory.
Sell Limit Layers: 110,000 💸 → 108,000 💸 → 106,000 💸
(You can expand the layer grid as per your risk model.)
Stop Loss: 112,000 — positioned above the previous Higher High (HH) structure.
📝 Note: Dear Ladies & Gentlemen (Thief OG’s), I’m not recommending you to stick to my SL. Manage risk your way — you make money, you take money. 💼
Target: 98,000 — based on strong support, oversold confluence, and a potential liquidity trap zone below.
📝 Note: Same rule — take profits where it makes sense for you. The trap is the escape; don’t overstay the party. 🎭
🔍 Technical Confluence Highlights
📉 MA Breakout: Bears gaining control after crossover rejection.
📊 MACD Divergence: Weak momentum confirmed — watch histogram fade.
Structure Check: Market respecting descending trendline — sellers defending upper zone.
🧩 Momentum Flow: Smart money possibly rotating out of BTC into defensive assets.
🌍 Correlated Pairs to Watch
Keep an eye on these related assets for directional cues and correlation strength:
BITSTAMP:ETHUSD (Ethereum) — often mirrors BTC’s moves with higher beta.
TVC:DXY (U.S. Dollar Index) — rising DXY can pressure BTC.
PEPPERSTONE:NAS100 (NASDAQ 100) — tech sentiment affects BTC risk appetite.
CRYPTOCAP:BTC.D (Bitcoin Dominance) — watch if altcoins start outperforming.
✨ “If you find value in my analysis, a 👍 and 🚀 boost is much appreciated — it helps me share more setups with the community!”
#BTCUSD #Bitcoin #CryptoMarket #SwingTrade #TechnicalAnalysis #ThiefStrategy #BearishSetup #CryptoTrading #MarketFlow #LayeredEntries #SmartMoney #TradingView #EditorPickCandidate #BTCAnalysis
BTCUSD: Consolidation is the main theme todayYesterday, BTC saw intense battles around the psychological threshold of 100,000. During the session, it once broke below the key support at 99,500, then rebounded to around 104,000.
Today, it pulled back to around 102,000 at the opening of the Asian session and began to consolidate again.
On the upside, the 105,000-105,500 zone forms a crucial resistance range. Only a daily close firmly above this level can confirm the reversal of the short-term downtrend. For today's short-term support, we still focus on 100,000. If it breaks below 100,000, we need to pay key attention to the supporting role of 98,000.
Buy 100,500 - 101,000
SL 100,000
TP 102,000 - 102,500 - 103,000
Sell 103,000 - 103,500
SL 104,000
TP 101,500 - 101,000 - 100,500

BTC: Today's predictions and operations have been verified👏Today, our predictions for BTC have been verified by the market.
✔1-Judgment on Short-Term Market Nature: After Bitcoin experienced a sudden sharp surge at the opening, we accurately judged that "this surge was a short-term fluctuation lacking sustained support". Subsequently, the price fluctuated downward rapidly and fell back to the oscillating range, which fully validated the judgment that "it was not a trend reversal".
✔2-Trend Direction Prediction: We clearly proposed the downward target level of 103,000. After Bitcoin dropped to just above 103,000 and then rebounded, this fully confirmed our judgment.
🎉Today, we have successfully concluded this week’s trading and work. Next week, we will continue to provide you with more accurate market interpretations and operation references from a professional analytical perspective. Finally, we wish you all a relaxing and pleasant weekend in advance!

BTC: The next downside target looking at 103,000The price of BTC continued to decline today. The previous key support level of 109,500 was broken, and the moving average system was also in a bearish arrangement, exerting pressure on the price.
In terms of technical indicators, according to relevant analysis, Bitcoin's MACD indicator showed a bearish signal. Although the RSI indicator was in a neutral area, the price was lower than both the short - term and long - term moving averages, and the trading volume significantly shrank, indicating insufficient market momentum, an unhealthy price - volume relationship, and weak reversal signs. In addition, from the perspective of the 4 - hour K - line, the MACD histogram remained negative but gradually became shorter, indicating that the strength of the bulls was increasing, but the KDJ indicator had no golden cross or death cross, remaining neutral overall.
In terms of market sentiment, the continuous weakness of Bitcoin made the market sentiment more cautious, and the confidence of the bulls was somewhat damaged.
If Bitcoin cannot regain 110,000 in the short term, the price may continue to fall, and the next target may be around 103,000.
Sell 107000 - 106000
SL 108000
TP 105000 - 104000
Daily-updated accurate signals are at your disposal. If you run into any problems while trading, these signals serve as a reliable reference—don’t hesitate to use them! I truly hope they bring you significant assistance

BTC: Range trading & event-driven tradingToday's BTC market demonstrates the dual characteristics of "rallying and then pulling back and range-bound fluctuation". In the short term, it will most likely remain in a range-bound state, and the probability of breaking out of the range before the option expiry is relatively low.
If the U.S. Dollar Index breaks below 99.2, BTC is expected to move upward to test the resistance level; if whales show signs of closing long positions, it may continue to decline.
Given that whales' 40x highly leveraged positions may trigger liquidity squeezes, it is recommended that retail investors limit their leverage ratio to no more than 5x and avoid chasing longs above 121,800.
Based on the current market conditions, it is advisable to adopt a composite strategy of "range trading & event-driven trading".
Buy 120500 - 121000
TP 121500 - 122000
SL 120000
Daily-updated accurate signals are at your disposal. If you run into any problems while trading, these signals serve as a reliable reference—don’t hesitate to use them! I truly hope they bring you significant assistance

Bitcoin – Silence at the 0.618, Fate Awaits Beyond the Citadel.⊣
⟁ BTC/USD - BINANCE - (CHART: 1D) - (Aug 21, 2025).
◇ Analysis Price: $113,851.76.
⊣
⨀ I. Temporal Axis - Strategic Interval - (1D):
▦ EMA9 - $115,774.47:
∴ Price currently trades below EMA9, confirming short-term bearish control;
∴ Recent candles show rejection at EMA9 with no sustained recovery;
∴ EMA9 is now acting as immediate dynamic resistance.
✴️ Conclusion: Short-term bias remains bearish.
⊢
▦ EMA21 - $116,406.15:
∴ EMA21 overlaps with Bollinger midline, reinforcing resistance;
∴ Market has repeatedly failed to reclaim this level;
∴ Confirms mid-range structural weakness.
✴️ Conclusion: EMA21 = critical rejection zone.
⊢
▦ EMA50 - $114,864.59:
∴ Price hovering around this level in confluence with Fib 0.618;
∴ Sustained breakdown may unlock deeper retracements;
∴ Acts as battlefield between bulls and bears.
✴️ Conclusion: EMA50 = structural pivot under pressure.
⊢
▦ EMA200 - $103,250.81:
∴ Long-term trend support, still untouched;
∴ Represents final defense line for macro-bullish structure;
∴ Bears will target it if Fib 0.5 and 0.382 fail.
✴️ Conclusion: EMA200 = macro fortress below.
⊢
▦ Bollinger Bands (21, 2, base EMA9) - $121,471.73 / $116,406.15 / $111,340.57:
∴ Price moving towards lower band after rejection at midline;
∴ Bands widening, signaling volatility expansion;
∴ Downward trajectory consistent with bearish volatility regime.
✴️ Conclusion: Bands confirm ongoing bearish expansion.
⊢
▦ RSI (21, 9) - 46.86 / 50.67:
∴ RSI trending below neutral 50;
∴ No bullish divergence spotted;
∴ Momentum favors sellers.
✴️ Conclusion: RSI validates bearish control.
⊢
▦ MACD (9, 21, 9) - Line: –766.13 / Signal: –631.35 / Histogram: –134.78:
∴ Bearish crossover intact, histogram negative;
∴ Acceleration of bearish momentum confirmed;
∴ No signal of reversal yet.
✴️ Conclusion: MACD reinforces bearish regime.
⊢
▦ ADX (21, 9) - 25.31:
∴ Above 25 = trend gaining strength;
∴ Directional bias negative;
∴ Confirms transition from range into downtrend.
✴️ Conclusion: Bearish trend strengthening.
⊢
▦ MFI (21) - 40.14:
∴ Below 50 = capital outflows dominate;
∴ No oversold conditions yet;
∴ Space for further selling pressure.
✴️ Conclusion: Flow aligned with bearish market.
⊢
▦ OBV (21, BB2) - (–86.16K):
∴ Downward OBV shows distribution phase;
∴ Confirms sellers in control of volume dynamics;
∴ Bears dominate liquidity.
✴️ Conclusion: OBV confirms distribution bias.
⊢
▦ StochRSI (3, 3, 21, 9) - K: 8.01 / D: 7.62:
∴ Oversold condition;
∴ May allow short-term relief bounces;
∴ But no confirmed bullish reversal yet.
✴️ Conclusion: Short-term oversold, but within bearish context.
⊢
▦ Fibonacci Retracement (0.000 / 1.000):
0.618 -> $114,049.13 - (current battlefield, price at edge);
0.500 -> $111,058.33 - (next target if broken);
0.382 -> $108,067.53 - (deeper continuation);
0.236 -> $104,367.05 - (bear extension);
EMA200 confluence near 0.236 zone = macro defense.
✴️ Conclusion: 0.618 = last defense before accelerated bearish continuation.
⊢
⨀ II. Derivatives Sentiment – Skew, 180D Deribit - (Source: Amberdata & Coindesk):
▦ Call-Put Skew (180D / –0.42) - (Aug 21, 2025):
∴ Most negative since Jun/2023;
∴ Reflects strong demand for puts vs calls = hedging / defensive positioning;
∴ Institutional sentiment aligned with technical bearish regime.
✴️ Conclusion: Skew confirms institutional bearish caution.
⊢
🜎 Strategic Insight - Technical Oracle:
∴ The 1D chart reveals a bearish regime shift. Price rejected EMA21 + Bollinger midline, failing to regain momentum;
∴ EMA50 + Fib 0.618 ($114K) is under siege, and breakdown would expose $111K and $108K zones;
∴ Momentum indicators (MACD, RSI, ADX) align with bears, while OBV + MFI confirm capital outflows and distribution;
∴ The only counterpoint is StochRSI oversold, which may fuel minor relief rallies, but not structural reversal.
⊢
⚚ Coupled with the (Deribit 180D) Skew plunging to (–0.42 = most negative in 2 years), the institutional derivative market validates the caution: Risk aversion dominates ahead of Jackson Hole, with Powell’s speech poised as catalyst for either breakdown or miraculous reclaim above EMA21 - ($116.4K).
∴ The battlefield is set:
Above ($116.4K) = reclaim & neutralization;
Below ($114K) = bear continuation -> ($111K / $108K);
If EMA200 breaks ($103K) -> full structural collapse.
⊢
𓂀 Stoic-Structural Interpretation:
✴️The BTC/USD daily structure now embodies the essence of stoic fate: inevitable compression leading to directional release.
∴ Structure of Trend: EMA's (9, 21, 50) breached, with price now clinging to the (Fib 0.618 - $114K) - the last bastion before surrender to deeper retracement ($111K / $108K). EMA200 ($103K) stands as the final citadel of macro structure;
∴ Momentum of Will: RSI below neutrality, MACD in decisive bearish cross, ADX strengthening - the market’s will bends toward decline. Only the StochRSI whispers of oversold respite, a fleeting breath amid descent, not yet salvation;
∴ Flow of Capital: MFI and OBV confirm distribution, liquidity escaping upward promise into the void. Volume contracts, yet each rejection seals the bearish dominion further;
∴ Derivative Oracle: The 180D Deribit Skew (–0.42), most negative since 2023, signals that institutions cloak themselves in protection. Demand for puts over calls mirrors stoic prudence: fortify the self, expect the storm.
✦ Structure Thus:
The market is bound by fatum;
Only a reclaim above $116.4K reopens the gates of neutrality;
Failure below $114K drags the structure into its stoic descent, step by step, until the macro fortress at $103K is tested.
✴️ Conclusion: Bitcoin stands in compression before expansion. The silence of charts echoes the discipline of Stoicism: prepare for loss, endure the storm, and only act when the structure allows.
⊢
· Cryptorvm Dominvs · MAGISTER ARCANVM · Vox Primordialis ·
· Dominivm Cardo Gyratio Omnivm · Silence precedes the next force. Structure is sacred ·
⊢

Thief Trader Setup: Robbing the BTC/USD Market Reversal🏴☠️💰 Bitcoin Heist Blueprint: BTC/USD Robbery Plan by the Thief Trader Crew 💰🏴☠️
(Swing & Day Trade Outlook – Clean Entry, Clean Exit, No Fingerprints Left Behind)
🌟 Hi! Hola! Ola! Bonjour! Hallo! Marhaba! 🌟
To All Market Raiders & Silent Money Makers 🤑💸💰✈️
This isn't your average BTC/USD analysis — this is a strategic market heist, crafted from the Thief Trading Playbook.
We're planning a clean operation based on both technical setups and fundamental awareness.
Let’s enter smart, exit faster, and leave no trace — just profit. 🏆
🎯 THE GAME PLAN: Unlocking the BTC/USD Vault
📈 Entry – “The Vault’s Cracked Open!”
The plan kicks off with retest entries on the 15 or 30-minute chart.
Sell limits should be placed around recent highs or lows where market momentum pulls back.
Precision and patience are your tools.
🛑 Stop Loss – Backup Escape Route
Use the 1D swing high/low (e.g., 104.500) as your SL zone.
Position size smartly, factoring in risk %, lot size, and number of active orders.
🏁 Target – 94.000 (Or Bail Out Before It Gets Hot)
Don’t stick around too long — cash out near the zone or before if price slows or traps emerge.
Secure the bag, vanish before resistance bites back.
🧲 Scalpers – Quick In, Quick Out!
Stick to the short side only — short the bounces, trail your SL, and move with stealth.
Big players can strike straight; others can shadow the swing crew and trail behind with protection.
🧠 Why This Works – Market Pulse
BTC/USD is facing overbought pressure, consolidation traps, and is nearing a critical MA Zone where reversals tend to form.
Momentum shows signs of weakening, and the bears are regrouping — that’s where we slip in and out.
Supporting Factors Include:
Macro trends
Fundamental sentiment
COT positioning
On-Chain signals
Intermarket flow
Key psychological levels
🔍 All these build the narrative behind this bearish setup. This is more than just price action — it's a calculated move.
⚠️ Trading Risk Alert: Stay Off the Radar During News Drops 📰🚨
Avoid new entries during major news events — increased volatility = increased risk.
Use trailing stop-losses to lock in profits while staying protected during spikes.
❤️ Like the Plan? Power the Crew!
If this setup helped you see the market differently, hit the 💥Boost Button💥.
Every like supports the effort and helps sharpen our future plans.
Trade with style, move with purpose — Thief Trader Style.
🚀 Stay tuned for the next setup from the shadows. Until then — stay sharp, stay strategic, and always protect your profits. 🐱👤💰📉📈

BTC/USD Bearish Setup – Trendline Retest Before the Fall?🔍 Technical Breakdown – BTC/USD 3H Timeframe
Bitcoin is displaying a textbook Double Top pattern formation on the 3-hour chart, signaling a potential bearish reversal after a strong bullish run. This classic pattern suggests buyer exhaustion and sets the stage for a downward move. Let's break down the analysis:
🧠 Pattern Insight: Double Top Reversal
A Double Top is one of the most reliable trend reversal patterns, especially when it forms after a sustained uptrend — just like we're seeing here.
Top 1 and Top 2 both formed inside a strong Resistance Zone between $106,500 and $107,000, showing repeated rejection from buyers to push price higher.
The formation of lower highs and long wicks near Top 2 further reinforce the weakening bullish momentum.
💥 Neckline Breakdown & Bearish Trigger
The Neckline, aligned with a horizontal Support Zone (~$103,300–$103,800), was decisively broken, confirming the pattern.
This breakdown acts as the trigger for bearish entries, and we are now in the "Retest Phase", where price often pulls back to the neckline or a nearby trendline before continuing lower.
📐 Trendline Confluence – Retest Opportunity
A short-term descending trendline drawn from Top 2 intersects near the neckline zone.
Price is now approaching this confluence area, offering a potential high-probability short entry if bearish price action confirms (e.g., a rejection candle like a bearish engulfing or pin bar).
🎯 Price Targets & Trade Setup
Parameter Value
📍 Entry On bearish confirmation near neckline/trendline retest (~$105,300)
❌ Stop Loss (SL) Above recent swing high / Top 2 (~$107,100)
🎯 Target ~$97,126 (based on measured move from top to neckline projection)
⚖️ Risk:Reward Approx. 1:3 or better (depending on entry timing)
Measured Target Calculation:
Height from neckline to peak (~$107,000 - $103,500 = $3,500)
Target = Neckline break - height = ~$103,500 - $3,500 = $97,000–$97,100
🔥 Market Context & Psychological Edge
This chart structure reflects a shift in market sentiment. What was once strong bullish momentum is now hesitating — with buyers failing to make higher highs and sellers stepping in aggressively. The double top is not just a pattern, it's a narrative of exhaustion and reversal.
“Let price confirm your bias. Don't just predict; react to structure and behavior.”
Being patient and letting the retest play out is crucial. Don’t rush in early — let the market give you a clean signal. This is where technical discipline pays off.
⚠️ Risk Management Notes
Crypto markets are highly volatile — avoid oversized positions.
A failed double top can lead to a bullish continuation, so SL discipline is key.
Wait for confirmation — candlestick patterns, momentum shifts, or bearish volume spikes can add confidence.
📌 Summary
✅ Pattern: Double Top
✅ Confirmation: Neckline Break
🔄 Current Phase: Retesting Neckline/Trendline
📉 Bias: Bearish
🎯 Target: ~$97,100
❗ SL: Above Top 2
💬 What do you think? Are we headed to GETTEX:97K or is this just a fakeout? Drop your thoughts below and don’t forget to like and follow for more trade setups!

In - depth Analysis of BTC: Can the 97,000 Target be Achieved?96000: This is the resistance level near the upper trend - line of the current ascending wedge. The price has tested this area several times but failed to break through effectively, indicating strong selling pressure at this level 💥.
⚡⚡⚡ BTCUSD ⚡⚡⚡
🚀 Buy@92000 - 93000
🚀 TP 95000 - 96000 - 97000
Accurate signals are updated every day 📈 If you encounter any problems during trading, these signals can serve as your reliable guide 🧭 Feel free to refer to them! I sincerely hope they'll be of great help to you 🌟

BTC/USD hourly trend using Market Timing AnalysisAccording to the analysis, the BTC/USD looks bearish. Trade with the stop loss.

Bitcoin's collapse is imminent Bitcoin's collapse is imminent
Over the past 24 hours, the price swept the shelf of liquidity at 99467, after which right now we are seeing a downward reaction.
The market capitalization is 3.39 trillion and the dominance index is 59.06%.
The fear and greed index is 79 (Extreme Greed).
If we consider BTC from the point of view of structure - the price forms a local descending context. I expect further decline in BTC, at least to the removal of the shelf at 92278, I also do not exclude the deviation from the bottom of the current sidewall, and this is below 90218, up to the test of the first reference area in the form of 1D IMB 85159 - 81534.
I did not take short positions, I will consider long positions when forming a set-up.
🚀 Trade with the professionals of THS - Wave Theory!
🔹 All trades are based on wave analysis.
🔹 Fixed stop loss and take profit for risk management.
🔹 100% automation: copy trades through CopyFX service.
🔹 Reliability and transparency: the results are confirmed by the market.
📈 Don't miss the chance to earn steadily!
👉 Connect to CopyFX with THS and start copying profitable trades right now!
💡 Details on our channel and in the app!

BTCUSDPair : BTCUSD ( Bitcoin / U.S Dollar )
Description :
Head and Shoulder
RSI - Divergence
Completed " 12345 " Impulsive Waves
Break of Structure
S / R Level

Might be trend change in BTCUSDTrend line broken and near support. Can expect a further fall if the support is broken at 61000.

Btcusd Bitcoin (BTC) is recognised as the world's first truly digitalised digital currency (also known as a cryptocurrency). The Bitcoin price is prone to volatile swings; making it historically popular for traders to speculate on. Follow the live Bitcoin price using the real-time chart, and read the latest Bitcoin news and forecasts to plan your trades using fundamental and technical analysis.
Bitcoin Price (BTC) Real-Time Live Price
Bitcoin News: Read the Latest Analysis on BTC
Confirm btcusd signal

Btcusd sell Bitcoin (BTC) is recognised as the world’s first truly digitalised digital currency (also known as a cryptocurrency). The Bitcoin price is prone to volatile swings; making it historically popular for traders to speculate on. Follow the live Bitcoin price using the real-time chart, and read the latest Bitcoin news and forecasts to plan your trades using fundamental and technical analysis.
Confirm signal

Bitcoin Price in Need of a Boost: Key Levels to WatchThe current state of Bitcoin's value requires a push from investors, as the cryptocurrency finds itself hovering around the $43,000 mark at the time of writing. Following a 7.7% dip over the past weekend, BTC has fallen below the upward trendline, which previously acted as a crucial support level.
The Relative Strength Index (RSI) has also, for the first time in three months, dropped below the neutral 50.0 level, indicating a mild downward trend at present. Despite Bitcoin's attempts to break free from the 50-day Exponential Moving Average (EMA) at around $42,069, there is potential for recovery as long as the $44,000 barrier is breached.
The market sentiment surrounding Bitcoin hinges on the successful overcoming of the $44,000 resistance, offering a chance for the cryptocurrency to regain its footing. Investors will be closely monitoring this critical level, as a decisive breakthrough could pave the way for a renewed upward trajectory. As Bitcoin navigates these key levels, the coming days will likely unfold with significant implications for its short-term price action.

BTC/USD Dynamics and Concerns over Attraction ForcesReaching the $48,000.00 mark earlier this week, some speculators may view this value as an upcoming attraction point for Bitcoin. However, traders in the BTC/USD market must maintain a realistic perspective, acknowledging the potential for Bitcoin prices to decline, and a one-way upward trend could pose a risky gamble, given the likelihood of lower reversals.
Risk management remains crucial for BTC/USD, and short-term volatility is expected to increase in the near future. Attraction forces persist for BTC/USD, and its value may decrease if Bitcoin holders decide to withdraw profits as financial institutions begin to engage in Bitcoin ETFs. The upcoming trading days in the BTC/USD market will garner attention, urging traders to exercise caution.
Short-term prospects for Bitcoin:
Current Resistance Level: $46,375.00
Current Support Level: $46,150.00
High Target: $47,200.00
Low Target: $45,540.00
This analysis underscores the importance of a balanced approach in the BTC/USD market, recognizing both attraction forces and potential risks. It provides a forward-looking perspective for traders, emphasizing the need for careful consideration in the face of evolving market dynamics.

Bitcoin Trades Sideways After SEC Greenlights Spot Bitcoin ETFBitcoin was hovering around an elevated flatline on late Wednesday after the Securities and Exchange Commission gave the go-ahead for the first spot bitcoin exchange-traded funds (ETF) to be traded in the U.S., as expected.
According to Coin Metrics, the cryptocurrency pared earlier losses and was most recently trading around $46,671. Meanwhile, the price of ether shot up as much as 15.5% to $2,606, the highest since May 2022. Most recently it was up 14.5% at $2,586.54.
The ETF approval is a milestone for the crypto industry, which first sought to launch a bitcoin ETF more than 10 years ago. Optimism has been building since Grayscale's major legal victory over the SEC in August regarding the regulator's refusal to allow them to convert their popular Bitcoin Trust (GBTC) into an ETF. The price of the leading cryptocurrency has risen 80% since then.

Bitcoin's Jubilee Upgrade ImpactBitcoin is preparing for a significant "Jubilee Upgrade" at block height 824,544. This upgrade briefly suspends deposit and withdrawal services for certain BRC20 tokens on January 5, 2024. The update aims to address inconsistencies in engravings on BTC denominations within the BRC-20 network. UniSat will monitor functionality, and a scheduled network update from January 5 to 6 will temporarily close the BRC20 market while other services continue uninterrupted.

Bitcoin Eyes $50,000 amid ETF SpeculationBitcoin's price continues to oscillate around the weekly supply zone midpoint of $43,860, poised for an early breakout as imminent ETF launches draw closer. The flagship cryptocurrency finds robust support from the 25-day and 50-day Exponential Moving Averages (EMAs) at $43,130 and $41,391, respectively. The upward slope of these EMAs indicates minimal resistance ahead. The Relative Strength Index (RSI) also trends north, signaling upward momentum. Increased buying pressure at current levels might drive Bitcoin to decisively breach the pivotal $43,860 level, paving the way for the next crucial range expansion toward $48,000.
Once surpassing the $48,000 threshold, Bitcoin could swiftly surge towards the psychological level of $50,000 before profit-taking ensues. Traders exercising profit control might set the pace for BTC to achieve the ambitious target of $60,000.
Conversely, premature profit-taking prompted by SEC rejections or delayed decisions could trigger a downturn. Such action might break below the 25-day and 50-day EMAs before testing the convergence between the 100-day EMA and horizontal support near $37,800.
However, to nullify the current bullish outlook, Bitcoin would need to close below the psychological level of $30,000.

"Bitcoin's 67% Value Surge Despite Regulatory Challenges"Even amidst regulatory crackdowns on cryptocurrency exchanges over the past year, Bitcoin has exhibited consistent growth throughout much of 2023, currently hovering around $43,610 - an increase of nearly $18,000 in value since September.
Reaching its peak at around $68,000 in November 2021, Bitcoin faced a significant setback by November 2022, losing over 75% of that value following the collapse of FTX, a major crypto exchange at the time. Yet, it seems poised for a resurgence once again.
This resilience underscores Bitcoin's ability to weather regulatory challenges and market upheavals, emphasizing its enduring appeal and potential for recovery amidst a rapidly evolving financial landscape.

BTC/USD Analysis Bitcoin surged past the $44,700 resistance on January 2, yet this breakthrough turned out to be a price trap as it plunged on January 3. Buyers stepped in as prices dipped to the 50-day simple moving average ($40,938), showcasing robust bullish defense around the $40,000 mark. The exponential 20-day moving average traded sideways at ($42,855), while the Relative Strength Index (RSI) hovered around neutral, indicating restrained price action ahead. The range boundaries could be $40,000 and $45,879.
A significant drop below the $40,000 support would signal short-term bullish capitulation. This scenario might drive the BTC/USDT pair towards the next major support at $37,980.
Buyers regain control upon pushing the price beyond $45,879. Subsequently, the pair could rally towards $50,000.
The recent price movement indicates a delicate balance between bulls and bears, with $40,000 as a critical level to watch. Breaking below could see further downside, while surging past $45,879 could reignite bullish momentum towards the $50,000 mark.
