BTC Daily wave countINDEX:BTCUSD
BITSTAMP:BTCUSD
While many bears topping up, and many bulls are hoping for more, maybe something in between is happening. There are a lot of options at the moment. This is one path which fits well into the timing and structure of the overall view of BTC. The next days/weeks will show which path BTC will take
BTCUSDT

BTCUSDT: Short Setup Active Below $110,700Hello everyone, here is my breakdown of the current Bitcoin setup.
Market Analysis
On the 1H timeframe, Bitcoin continues to move inside a descending channel, maintaining a clear bearish structure.
After multiple tests and breakouts, the price is still unable to break through the Resistance Area around $110,700, which remains a strong supply zone.
Recently, we saw a fake breakout, followed by a return below the resistance area — confirming that buyers are losing strength. Currently, the price is forming a range near the Support Zone ($104,500–$105,000), which indicates a short-term consolidation phase before a possible next move.
My Scenario & Strategy
I expect that after the range is broken to the downside, BTC will continue its decline toward the Support Zone ($104,500). If this level fails to hold, the next potential target will be the lower boundary of the descending channel around $102,300.
However, a breakout and close above $110,700 would invalidate the bearish scenario and could indicate a shift in market structure.
That's the setup I'm tracking. Thank you for your attention, and always manage your risk.

Analytics: Market outlook and forecasts
📈 WHAT HAPPENED?
Last week, Bitcoin experienced another wave of decline, but didn’t reach the low of the previous dump. On Friday, there was a volume anomaly at $105,000, after which a correction was expected to $108,000. As a result, we got into a sideways movement at these values, and the seller's activity didn’t resume.
💼 WHAT WILL HAPPEN: OR NOT?
On the hourly timeframe, a trend reversal to the upside has been recorded. We’re currently testing a significant volume sales zone, and the slowdown in price movement (price action) indicates a likely correction. Our future tactics will depend on the dynamics of this correction: whether to join the longs or stay on the sidelines.
Two support zones have formed below the current price, and if there is a reaction, testing these zones will serve as a buy signal. If the situation unfolds favorably, the $116,000 level may be tested this week. If the buyer doesn’t show any activity, the priority scenario shifts towards sales, and we expect a decline to the level of $97,000.
Buy Zones:
• $107,300–$106,300 (accumulated volumes)
• $105,600–$104,500 (volume anomalies)
• $97,000–$93,000 (major volume zone)
Sell Zones:
• $110,000–$113,000 (accumulated volumes)
• $114,400–$115,600 (local volume zone)
• $120,900–$124,000 (major volume zone)
📰 IMPORTANT DATES
This week, we’re following these macroeconomic events:
• October 22, Wednesday, 6:00 (UTC) — publication of the UK Consumer Price Index for September;
• October 23, Thursday, 12:30 (UTC) — publication of the number of initial jobless claims in the United States;
• October 23, Thursday, 14:00 (UTC) — publication of data on U.S. home sales for September;
• October 24, Friday, 12:30 (UTC) — publication of the US Consumer Price Index for September;
• October 24, Friday, 13:45 (UTC) — publication of the US Service and Manufacturing Business Activity Index for October;
• October 24, Friday, 14:00 (UTC) — publication of US new home sales data for September.
*This post is not a financial recommendation. Make decisions based on your own experience.
#analytics

BUY BITCOIN - BTC/USD- Amazing low risk high reward trade!Based on our deep analysis we can see that BITCOIN (BTC/USD) will head to the upside. Great time to BUY - it has broken POWERFUL resistance levels and is also being held by powerful support levels which it can't break through. Target is next resistance level - buy now!

BTC/USDT: Bearish Channel Holds as Price Faces Key ResistanceBTC/USDT remains under bearish pressure, with the recent rebound from 102K facing resistance near the 114K–115K zone. Price action continues to respect the descending channel, reinforcing that sellers remain in control.
A rejection at the trendline could trigger another bearish leg toward 107.5K, with potential to revisit 102K if selling momentum intensifies. As lower highs continue to form below resistance, the broader bias favors further downside.

Bitcoin - Will Bitcoin also cross $100,000?!Bitcoin is located between EMA50 and EMA200 on the four-hour timeframe and is in its medium-term ascending channel. In case of an upward correction towards the specified supply range, it is possible to sell Bitcoin with a better risk-reward.
It should be noted that there is a possibility of heavy fluctuations and shadows due to the movement of whales in the market and compliance with capital management in the cryptocurrency market will be more important. If the downward trend continues, we can buy within the demand range.
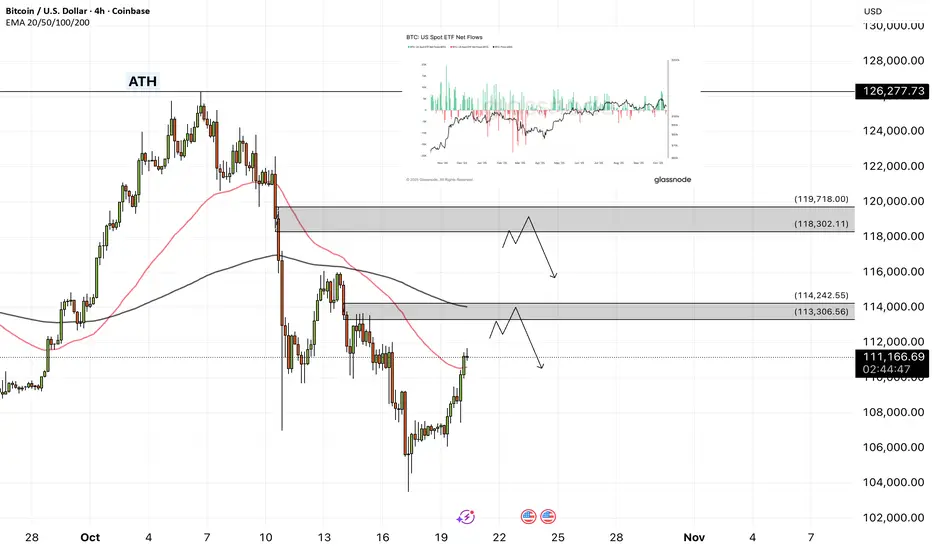
Bitcoin’s recent rally has stalled under macroeconomic pressures, marking one of the most significant events in the asset’s history. With capital inflows into ETFs slowing and volatility spiking, the market has entered a recalibration phase—characterized by deleveraging, cautious investor sentiment, and a reliance on new demand to reignite the bullish trend.
This latest price decline is particularly concerning, as it marks the third time since late August that Bitcoin has fallen below roughly $117,000, a zone where most large holders are now underwater.
Following the largest liquidation cascade in Bitcoin’s history, capital inflows into U.S. spot ETFs have weakened alongside price declines. At the same time, the derivatives market has seen a sharp reduction in leverage, while ETF investors have shown mild selling pressure, resulting in a net outflow of about 2.3K BTC so far this week.
Unlike previous capitulation phases, where outflows typically accelerated price drops, the current slowdown reflects hesitation rather than panic. However, if weakness persists or ETF inflows take longer to recover, it could signal fragility on the demand side, undermining one of the core drivers behind Bitcoin’s past rallies.
During the recent liquidation wave, spot trading volumes surged to some of the highest levels of the year, reflecting intense market activity as traders rapidly adjusted their positions amid heightened volatility.
...دادهاند
In Q3 of this year, the number of publicly traded companies holding Bitcoin on their balance sheets hit a new record — despite ongoing market turbulence. According to data from Bitwise Asset Management, the number of listed firms with Bitcoin holdings grew by nearly 40% in just three months, reaching 172 companies.
Still, a recent October survey by Bank of America shows that 76% of investors currently hold no exposure to cryptocurrencies, up from 67% in September. Even among those with some allocation to digital assets, exposure remains minimal:
• 3% of investors hold only 2% of their portfolios in crypto.
• 1% allocate around 4% to cryptocurrencies.
• 3% have 8% or more of their portfolios invested in digital assets....
#BTC Update:- Are we going lower? Or Higher? Don't miss this!Before jumping into the chart, I’ve got a few words for everyone.
The recent crash has been absolutely brutal. It’s shaken the entire market and, sadly, affected so many lives; some people lost everything, and some couldn’t handle the pain. My heart truly goes out to everyone who suffered. 💔
But remember, the past is behind us. What really matters now is what we do today and how we build our tomorrow.
No one was spared from this storm. It felt like a broad daylight robbery, and if you got hit too — please, stay strong. Don’t give up. Sometimes the market resets itself in the harshest ways to prepare us for the next big move.
Take SUI for example, a solid project that would normally take 6–9 months in a bear market to drop 85%, yet it did that in one single daily candle!
From $3.71 to $0.5597, that’s an 84.9% dump in just one day.
And the worst part? Most people couldn’t even catch those prices because exchanges went crazy.
👉 Moral of the story: It’s not over. Far from it. This might just be the reset we needed before the next leg up.
### Now, about the Bitcoin chart:
BTC crashed hard, but guess what? It bounced right off the support.
That’s a strong sign.
The blue EMA you see on the chart is the 200 DEMA, another bullish signal that tells us there’s still strength in the market.
Keeping it short and simple, we’re likely heading higher from here.
Invalidation: A daily break and close below $103K.
---
I’ll be sharing more altcoin charts soon, so stay tuned.
And to everyone reading this, stay strong, stay grounded, and remember… WAGMI 🙌
We’ve been through worse, and we’ll come out of this even stronger.
If this message resonated with you, don’t forget to hit that ❤️. Let’s keep spreading positivity in this space.

BTC 4H Analysis | Day 5🥳 Hey everyone! Hope you’re doing great! Welcome to SatoshiFrame channel .
✨ Today we’re diving into the 4-Hour Bitcoin analysis. Stay tuned and follow along!
👀 After breaking out of the descending channel and confirming the long setup I explained in the previous post, Bitcoin moved upward and easily broke through its Maker-buyer zone.
🔍 Over the past two market-holiday days, Bitcoin consolidated in a multi-timeframe accumulation phase with a ceiling at $107,356, which was easily breached. The price then advanced toward its higher-level key resistances. It’s now trading between $110,500 and $113,000 — the $113,000 zone is our long trigger since price has struggled there multiple times before. This makes it a bit risky, but if the upward movement continues, the next resistances could be at $115,800 and $120,836.
🧮 Looking at the RSI oscillator, it has comfortably passed the 50 level on the 4-hour chart and is now heading toward the overbought zone, facing a key resistance at 70. This 70 level overlaps with the 50 zone on the daily timeframe, meaning that if RSI enters overbought on the 4-hour, the daily will just be shifting from a bearish swing phase to a long-position momentum phase — so the 70 zone is crucial.
🕯 If you check the lower-volume section of the chart, you’ll notice something interesting: the breakout above the two-day accumulation range came with a clear rise in buy volume, which helped Bitcoin easily break both the resistance area and the descending trendline (the upper boundary of the previous channel). This suggests Bitcoin may soon take a volume or price correction to gain more strength for another upward move.
⏰ During today’s New York session, we might see some strong moves. Remember last week when U.S. investors were selling off their ETF holdings, and the market was hesitant to buy? That fear caused weak participation. This time, we may have a reason to stay active during New York hours as sentiment shifts.
🧠 Here are the two key scenarios to watch:
🟢 Long Position Scenario
Wait for Bitcoin to react either to the micro-buyer zone or to the $113,000 area. If we see a pullback followed by an indecision candle (confirmation setup) touching the SMA-7, that’s our entry cue — ideally with a tighter stop size.
🔴 Short Position Scenario
Ignore shorts for now. Bitcoin already completed its second downward wave with an imbalanced slope, and over the last two days, seller momentum has weakened. Buyers are now driving price through resistance levels, so shorting here would go against the current flow.
❤️ Disclaimer : This analysis is purely based on my personal opinion and I only trade if the stated triggers are activated .

BTCUSD – Three Drives Pattern + RSI DivergenceHi Teams!
Bitcoin has recently completed a three-drive pattern while also showing a clear bearish divergence on the RSI. This confluence has led to a strong rejection from the third drive area, confirming short-term weakness.
The three-drive trendline was broken last night, signaling that the bullish momentum has temporarily cooled down. However, as long as $97,900 remains unbroken, the bullish structure can still hold.
Here’s the current plan:
Key support zone: $108,600; this looks like a good potential long entry area if the price stabilizes and shows confirmation.
Upside target: around $118,045, which also aligns with the previous swing high.
Invalidation: if the price breaks below $97,900, the setup turns bearish, and we can expect deeper retracements toward the $86,500–$88,000 region.
In short, BTC is at a critical decision point, holding above $97,900 keeps the bullish structure intact, but a breakdown below that level could shift the market sentiment sharply bearish.
Disclaimer: As part of ThinkMarkets’ Influencer Program, I am sponsored to share and publish their charts in my analysis.

Bitcoin Price Outlook: Testing the $97,800 Support ZoneHi there!
Let's analyze Btc!
Bitcoin is currently moving inside a clear descending channel, showing consistent lower highs and lower lows. The price is likely to continue its downward movement until it reaches the daily support area around $97,800.
This zone appears to be a promising area for long-term opportunities. Still, traders should wait for strong confirmation signals before entering, as a reversal will only be valid once momentum shifts from bearish to bullish.

The Bitcoin bearish era has begun (1D)First of all, you should know that in our previous analyses, we had identified a large triangle. However, the market makers created another bullish wave, increasing the chart’s error margin (The scenario you see in the related ideas section.).
This sharp move indicates the beginning of new bearish branches! It is expected that with a pullback to the red zone, the correction will continue, and we will be involved in it for at least a few months.
Closing a daily candle above the invalidation level will invalidate this analysis.
For risk management, please don't forget stop loss and capital management
When we reach the first target, save some profit and then change the stop to entry
Comment if you have any questions
Thank You

Bitcoin the BOTTOMBitcoin has bottomed (IMO) at $106K, the 2024 top and 61.8% Fibonacci level, and is now rising for the final leg up.

BTC/USD – Bullish Setup (4H)📈 **BTC/USD – Bullish Setup (4H)**
Bitcoin is showing a potential reversal after bouncing from the ascending trendline support.
If price manages to hold above **108,000** and break the short-term downtrend, we could see a move toward higher Fibonacci levels.
🎯 **Targets:**
1. 109,800
2. 111,300
3. 113,300
4. 116,000
🛑 **Stop Loss:** clear close below **106,800**
I expect Bitcoin to continue its recovery toward the 0.618 and 0.786 Fibonacci zones, based on market structure and recent bullish reaction from support.
📘 *This analysis is based on personal market study – DYOR / Not financial advice.*

BTC/USDT — Volume Strength Returns, Eyes on 110K+ RecoveryBTC/USDT — Volume Strength Returns, Eyes on 110K+ Recovery 🚀
Bitcoin is showing renewed momentum as it re-enters the volume+ zone, signaling stronger market participation after recent consolidation. The move above the low time frame structure confirms short-term strength and suggests a potential continuation to the upside.
Currently, BTC is holding steady around $108.9K, maintaining support within the accumulation range. If momentum continues, a breakout toward $110K+ looks increasingly likely, aligning with short-term recovery signals.
📊 Technical Overview:
Volume Zone: $108K–$109K
Short-Term Target: $111K
Main Resistance: $122.5K
Bias: Positive momentum forming above low time frame
A strong hourly close above $109K would further confirm the shift in trend strength, potentially opening the next leg higher toward $111K–$122K.
📈 Outlook: Bullish short-term structure forming

THE RETURN OF BTC TO 110K ON WAY..There is high chance in the coming time we can see a BTC breakout return to 110K in the coming time. Today Sunday, can be an important day before the start of the weekly chart.
106K can become an important secure zone for the next increase in volume

BTCUSDT – Correction Pressure ReturnsHello traders,
After a weak rebound earlier this week, Bitcoin is showing signs of losing momentum as it continues to face rejection around the 110,000 USD zone. On the 4-hour chart, price action remains clearly within a descending channel, indicating that the short-term trend still favors the bearish side.
From a technical perspective, BTC is currently being capped by the EMA 34 and EMA 89, both acting as dynamic resistance levels. The recent bounce appears to be merely a technical pullback following the previous strong sell-off, but lacks the strength to establish new upward momentum. The price structure is forming a tight consolidation zone near the upper boundary of the channel — typically a signal of “a pause before continuation of the prior trend.”
On the news side – Policy and sentiment headwinds
This week, the FSB (G20) warned of “major gaps” in global crypto regulation — a negative sign for market confidence, especially after a massive mid-month liquidation shook investor sentiment.
At the same time, China’s tighter stance on stablecoins is raising concerns about slower Asian inflows, while institutional demand remains weak.
Together, these factors create a market environment of low buying pressure and rising risk , giving bears the upper hand in the short term.
Possible Scenario
At the moment, BTCUSDT is trading within the 106,000 – 110,000 USD range.
If the price fails to make a decisive breakout above 110,000 USD, a continuation of the correction toward the 100,000 USD area remains highly possible — aligning with the lower boundary of the descending channel and a key psychological support zone.

Bitcoin Technical AnalysisBased on Simple Technical Analysis ( Trendline + Support & Resistance )
Risk Disclaimer:
Please be advised that I am not telling anyone how to spend or invest their money. Take all of my analysis as my own opinion, as entertainment, and at your own risk. I assume no responsibility or liability for any errors or omissions in the content of this page, and they are for educational purposes only. Any action you take on the information in this analysis is strictly at your own risk. There is a very high degree of risk involved in trading. Past results are not indicative of future returns. Good luck :-)

BTC:Targets set at 109,800 - 111,000 after break above 107,500As we mentioned earlier, if Bitcoin breaks above 107,500 and remains stable, a minor rebound will occur, with targets set at 109,800 and 111,000. Let’s wait and see if it can reach this target range tomorrow.

BTC: Continuing to fluctuate between 106,000 and 107,500Today, BTC continues to trade within a narrow range and has repeatedly encountered resistance at the key level of 107,500. This level can be regarded as the bull-bear divide.
If the price can break above this level and stabilize, a small rebound is expected, with subsequent target levels around 109,800 and 111,000.
On the downside, we will focus on the support level around 106,000. If the price is suppressed from above and falls below this support level, it may continue to decline.
Buy 106000 - 106500
SL 105500
TP 107000- 107500
Sell 107500 - 108000
TP 109000
TP 106500 - 106000
Daily-updated accurate signals are at your disposal. If you run into any problems while trading, these signals serve as a reliable reference—don’t hesitate to use them! I truly hope they bring you significant assistance

#BTC Weekly Bullish Trend Intact📊#BTC Weekly Bullish Trend Intact📈
🧠From a structural perspective, the weekly bullish structure is still intact, and the bullish target zone (132k-175k) is still expected to be achieved, so the probability of continuing the bullish trend is still relatively high.
➡️We bought 30% of BTC spot from the green buy zone, and it has now started to rebound from here. If the closing price this week can be higher than the S/R W, then the bullish sentiment will be greatly improved.
➡️If there is an opportunity to directly reach the red target zone in the future, then we can look for medium-term shorting opportunities here (2).
⚠️Note that if a pullback starts from (1) in the future and a weekly short structure is constructed, then we need to be vigilant about the occurrence of a deep pullback, and the new bullish support level needs to be found around 74500.
🤜If you like my analysis, please like💖 and share💬
BINANCE:BTCUSDT

Bitcoin Can reach 93000 Bitcoin could reach the price level of $93,000 in the coming weeks.
There is a possibility that after breaking the midline of its long-term weekly channel, it may move up to the indicated FVG level to fill the remaining unfilled orders.
After that, it could start a new bullish rally aiming for the upper boundary of the channel.
This is purely an analysis and should not be considered as financial advice.
Buying or selling is at the trader’s own risk.

BTCUSDBTCUSD needs some upside sideways movement for a good few days before it breaks down again.
Disclosure: We are part of Trade Nation's Influencer program and receive a monthly fee for using their TradingView charts in our analysis.

SELL BITCOIN Btc/Usd - Amazing low risk high reward trade!Based on our deep analysis we can see that BTC/USD Bitcoin will head to the downside. Great time to buy - it has broken major support levels + trends.
