BTCUSDBTCUSD needs some upside sideways movement for a good few days before it breaks down again.
Disclosure: We are part of Trade Nation's Influencer program and receive a monthly fee for using their TradingView charts in our analysis.
BTCUSDT

SELL BITCOIN Btc/Usd - Amazing low risk high reward trade!Based on our deep analysis we can see that BTC/USD Bitcoin will head to the downside. Great time to buy - it has broken major support levels + trends.

Bitcoin - Losing MA200 SupportBitcoin has just shown a technical warning sign — for the first time since April, 3 daily candles have closed below the 200-day moving average (MA200). This signals a potential shift in trend and raises the risk of a deeper correction.
⸻
🔹 Current View
• BTC is trading around $107,600, struggling to reclaim the MA200 (~$107,700).
• The price had been moving inside a purple rectangular range since July, consolidating between roughly $107K and $123K.
• On October 17th, BTC broke below that rectangular range, confirming a range breakdown and increasing bearish momentum.
• Both the 50 SMA and 100 SMA are now above price, adding downward pressure.
• The RSI sits near 38, showing weakening momentum and potential continuation to the downside.
⸻
🔹 Key Levels to Watch
• Immediate Resistance: $114,000–$115,000 (50 & 100 SMAs)
• Next Supports: $104,000 → $96,000 → $88,000
• A move toward $88,000 would align with the long-term trendline support and could form a strong accumulation zone before the next major rally.
⸻
🔹 Outlook
As long as BTC remains below the MA200 and outside the previous range, the short-term trend is bearish.
However, this correction could present a great buying opportunity for long-term investors once key supports are tested.
⸻
🧠 “Breaking below the MA200 and losing the range often signals weakness — but it’s where long-term setups are born.”
📜 Disclaimer : This is general information only and not financial advice. Always do your own research before investing.

BTC Reign Pauses. Can ETH Lead the Charge Temporarily?A Tale of Two Titans: Divergence in the Making
Following the market-wide drop on October 10th, 2025, a significant divergence in character has emerged between the two crypto titans, Bitcoin and Ethereum. While Bitcoin's bullish structure appears compromised, Ethereum is exhibiting remarkable resilience, tenaciously holding key support and potentially setting the stage for a period of ETH-led market action.
This analysis explores the possibility of a temporary decoupling, where Ethereum takes the reins while Bitcoin enters a period of consolidation.
Bitcoin: Structure Compromised
From my perspective, the recent crash has severely compromised the prior bullish structure on Bitcoin's daily and weekly charts. The upward momentum has been invalidated, leaving BTC in a state of structural weakness. The most probable path forward for BTC appears to be a prolonged period of sideways consolidation, likely forming a complex flat correction. For now, the king seems to be resting in its coffin.
Ethereum: The Resilient Contender
In stark contrast, Ethereum’s chart tells a very different story. Here's why ETH is capturing our full attention:
Crucial Support Holds Firm: ETH is impressively defending the critical support zone around $3,756. Its refusal to follow BTC into a deeper decline is a powerful statement of relative strength.
Intact Market Structure: Unlike Bitcoin, Ethereum’s weekly and daily upward structures remain intact. The long-term bullish thesis is not yet broken (Weekly chart upward structures & Elliot are still holding targeting around 5900 USDT)
Emerging Elliott Wave Count: As illustrated on the daily chart, a weak but valid Elliott Wave count is taking shape. We appear to have completed a Wave (2) correction right at this key support. If this level holds, it paves the way for a powerful Wave (3) impulse to the upside.
Confluence of Bullish Divergences: Adding significant weight to this outlook are the strong bullish divergences flashing on both the Daily and 4-Hour charts. Around the $3,756 support, both the RSI and MACD are showing higher lows while price has tested lower lows — a textbook signal of waning bearish momentum and a potential reversal. Should this scenario materialize, we can expect a notable increase in weekly and monthly volatility as momentum shifts.
RSI divergence on 1D chart
MACD Divergence
OBV (4H chart) note that obv always making higher lows around the current support
BBWP contraction on 4H chart
The Big Question: A Changing of the Guard?
This brings us to a fascinating and potentially market-defining question: Can Ethereum lead the crypto market to new all-time highs while Bitcoin moves sideways?
We may be witnessing a temporary 'changing of the guard,' where ETH's fundamental strength and resilient technicals allow it to become the market's temporary primary driver. While Bitcoin's gravity is undeniable, the current situation suggests that Ethereum might be carving its own path.
The confirmation of this thesis rests on the $3,756 support. A sustained hold above this level could be the opening act for the next major bull run, led by an unexpected protagonist.
Share your thoughts in the comments

(BTC/USD) –1H Bearish SetupBitcoin remains in a bearish continuation phase as long as it stays under the red EMA band and below $108.5K.
Downside Fibonacci targets:
T1: $104,200 First bearish target — potential short-term take-profit zone.
T2: $102,600 Mid-term target — continuation move with momentum confirmation.
A clean 4H close above $109,800 would invalidate the short setup and shift bias back toward neutral-to-bullish.
💡 Bearish Confluences
Below Red EMA Ribbon: Price action continues to reject the 4H red EMA zone — clear sign of sustained seller strength.
Lower High Formation: Each rebound remains capped below prior highs; structure shows descending channel continuation.
Volume Weakness on Rallies: Reduced buying volume on retracements supports distribution pattern.
Bearish Fib Confluence: 0.618 retracement aligns with upper EMA resistance (~$108.5K).
RSI Neutral → Downturn: RSI hovering near 45–50, turning lower — loss of momentum confirmation.

#BTC #BTCUSD #BTCUSDT #BITCOIN #Update #Analysis #Eddy#BTC #BTCUSD #BTCUSDT #BITCOIN #Update #Analysis #Eddy
Warning: Bitcoin and the cryptocurrency market are poised for the next wave of decline. I envision 2 scenarios for Bitcoin, both of which aim to see Bitcoin fall below $90,000. The first scenario, which is a daily block breaker, is more likely. The second scenario will only be activated when Bitcoin consolidates above $109,000, aiming to fill the FVG. Eventually, the second scenario will be activated, and the main decline will begin from the upper supply range that I have identified for you.
I have identified the important supply and demand zones of the higher timeframe for you.
As you can see in the chart, the trend change from bullish to bearish has been confirmed in the decline we had.
This analysis is based on a combination of different styles, including the volume style with the ict style.
Based on your strategy and style, get the necessary confirmations for this analysis to enter the trade.
Don't forget about risk and capital management.
The responsibility for the transaction is yours and I have no responsibility for your failure to comply with your risk and capital management.
💬 Note: This is just a possibility And this analysis, like many other analyses, may be violated. Given the specific circumstances of Bitcoin, it is not possible to say with certainty that this will happen, and this is just a view based on the ICT style and strategy with other analytical styles, including the liquidity style.
Be successful and profitable.
Review the result of my previous analysis on bitcoin :

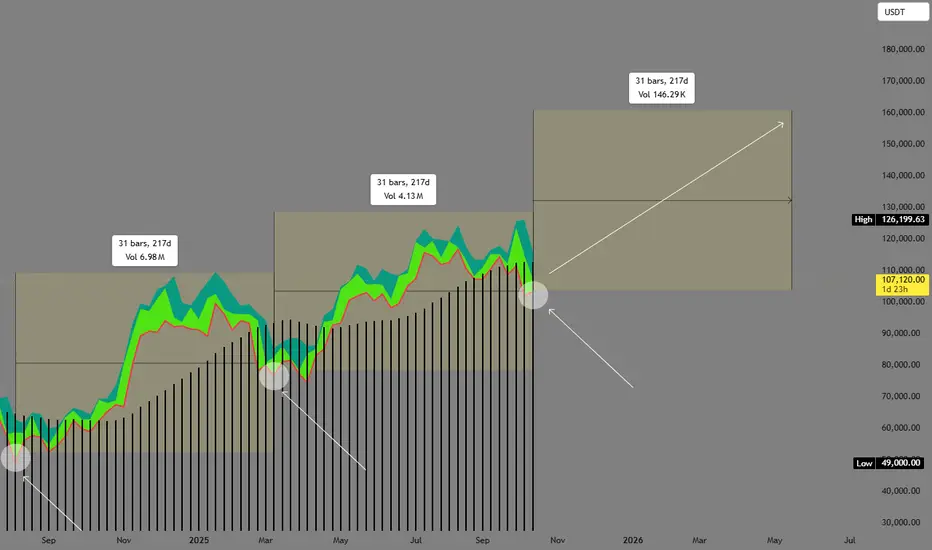
BTC finally basing after 217 days, Time for 160K NOW! Seed.BTC has seen rosy seasons this year as it kept reaching those milestones casually -- first, hitting the elusive 6-digit mark at 100k, then reaching its parabolic high at 126500. When things are looking up, and the whole market is in EUPHORIA and buyouts are way extended, a perfect storm has brewed so-to speak. The expected turn has transpired -- correct with so much weight. In a way, this is just part of the process of healthy sustainance to the trend, and such scenarios needed to play out to preserve the balance of price and trend.
If you notice on our diagram, the proportional time-based behavior of such events playing out with close-to-accuracy is quite amusing. Usually, BTC plays around the 217-day time based differentials between corrective season and bull seasons. This is no way to advocate that the chart above is very accurate and that the predictive nature is constant and correct, it just means we can be guided by such data from the past events as we move forward..
Now, based on the current metrics we have, BTC is now basing at the current price zone after tapping its lows at 103k area. This basing area is already hinting of a prep work of a reversal as precursor of its ascend trajectory narrative.
From these data, we can now be guided by the directional context of this asset as we proceed further.
Ideal positioning is at the current zone, (lows at 103k).
Mid Target is now at 160k.
Long term target 200k.
Trade safely always.
TAYOR.
ElDoradoFx PREMIUM – BTCUSD ANALYSIS (18/10/2025)Prepared by: ElDoradoFx Premium 2.0 Analyst Team
⸻
🧭 Market Overview
Bitcoin is trading around 107,000, attempting to stabilize after a sharp drop from 115,800 earlier in the week.
The daily structure has shifted bearish, following consecutive rejections from the descending trendline and a clean break below the 200 EMA.
However, price is now sitting near a major weekly demand zone (106,300–106,000), aligned with the 1D Golden Zone retracement.
This weekend, the market is expected to consolidate before deciding whether to extend the bearish trend or attempt a technical rebound.
⸻
📊 Technical Breakdown
1️⃣ Daily Chart (D1)
• Structure: Short-term bearish — lower highs and lower lows formed after 115,800 rejection.
• MACD: Strong red histogram; momentum favors sellers.
• RSI: 36.5 → Oversold area, early signs of exhaustion.
• 200 EMA: Recently broken at 107,900 → now acting as dynamic resistance.
• Key Support: 106,300–106,000 (last swing + Golden Zone).
Bias: Bearish to neutral; possible retracement toward 108k before continuation lower.
⸻
2️⃣ 1-Hour Chart (H1)
• Structure: Price is consolidating below descending trendline from 110,000.
• EMA50 < EMA200 → bearish alignment, but short-term rebound visible.
• MACD: Positive momentum beginning to build after strong histogram recovery.
• RSI: 50.1, showing neutral mid-range — space for a minor bullish correction.
Bias: Intraday corrective bullish move likely toward 107,800–108,000 resistance.
⸻
3️⃣ 15M–5M Chart (Intraday Momentum)
• Structure: Higher lows forming from 106,400 → 106,900 → 107,000.
• RSI rising above 55; MACD histogram bullish → short-term recovery pattern.
• Resistance: 107,450–107,800 (FVG + trendline intersection).
• Support: 106,500–106,300 (EQL + demand zone).
Bias: Short-term buy pressure into resistance, watch for rejection near 108k.
⸻
📐 Fibonacci Analysis
Last Swing: 115,800 → 106,300
• 38.2% → 109,820
• 50.0% → 111,050
• 61.8% → 112,280
📊 Golden Zone: 111,050–112,280
→ Expect major sell reaction if price retraces into this area next week.
⸻
🎯 High-Probability Trade Scenarios
✅ BUY SCENARIO (Short-Term Correction)
• Break & Retest: Above 107,450 confirms short-term bullish continuation.
• Retest Zone: 107,300–107,450
• Targets:
TP1 → 107,800
TP2 → 108,500
TP3 → 109,200
• Stop-Loss: Below 106,700
⚠️ SELL SCENARIO (Main Bias)
• Break & Retest: Below 106,300 confirms continuation to the downside.
• Retest Zone: 106,300–106,500
• Targets:
TP1 → 105,800
TP2 → 104,600
TP3 → 103,200
• Stop-Loss: Above 107,000
🚀 SWING SELL (High Probability)
• Ideal Entry: 111,000–112,200 (Fibonacci Golden Zone)
• Targets: 108,000 → 106,000 → 103,500
• Stop-Loss: Above 113,000
⸻
🕐 Fundamental Watch
• Weekend = low volume, potential for range-bound moves.
• Next week: Focus on U.S. CPI follow-through & Fed speakers, which may add volatility.
• CME futures gap remains open near 108,800, likely to be filled early next week.
⸻
⚙️ Key Technical Levels
Type Levels
Resistance 107,450 / 108,000 / 109,800 / 111,000
Support 106,500 / 106,300 / 105,800 / 103,200
Trendline Resistance 107,800 (H1 descending structure)
⸻
🧾 Analyst Summary
BTCUSD is in a corrective phase, showing short-term rebound signs from the 106k support zone, yet still locked under heavy resistance at 107.8k–108k.
A break below 106.3k resumes the bearish trend, targeting 104–103k, while a bounce above 107.4k may trigger a limited retracement to 108.8k–111k before sellers re-enter near the Golden Zone.
Overall market remains bearish but approaching exhaustion levels — watch for short-term buy opportunities within 106.3k–107k range before the next leg down.
⸻
📈 Primary Bias: Bearish below 107,800 – next downside targets 106,000 → 103,200
📉 Alternative Bias: Bullish retracement above 107,450 → 108,800 → 111,000
— ElDoradoFx PREMIUM 2.0 Team 🚀
⸻
🥇 ElDoradoFx PREMIUM 2.0 – PERFORMANCE 17/10/2025 🥇
📊 GOLD TRADE RESULTS:
🔻 SELL +20 pips
🟢 BUY +20 pips
🟢 BUY +210 pips
🟢 BUY LIMIT +20 pips
🔻 SELL LIMIT +110 pips
🟢 BUY +50 pips
❌ BUY –30 pips (SL)
🟢 BUY +200 pips
🟢 BUY +100 pips
🟢 BUY +400 pips
---
💰 TOTAL GOLD PIPS WON: +1,100 pips
📈 RESULT: 10 Signals → 9 Wins | 1 SL
🎯 ACCURACY: 90 %
---
⚡️ SWING SETUPS RUNNING:
🟢 BUY from 4,081 → +2,970 pips
🟢 BUY from 4,181 → +1,970 pips
💎 TOTAL SWING GAIN SO FAR: +4,940 pips
---
🔥 Precision. Patience. Profits.
Ending the week with momentum and clean executions 📈💪
👏 Congratulations if you profited! ✅✅✅🚀🚀🚀

Bitcoin Analysis for 2025 (best Entries)I’ve highlighted the best entry points for 2025 in my latest analysis for the upcoming month.

BTCUSDTHello Traders! 👋
What are your thoughts on BITCOIN?
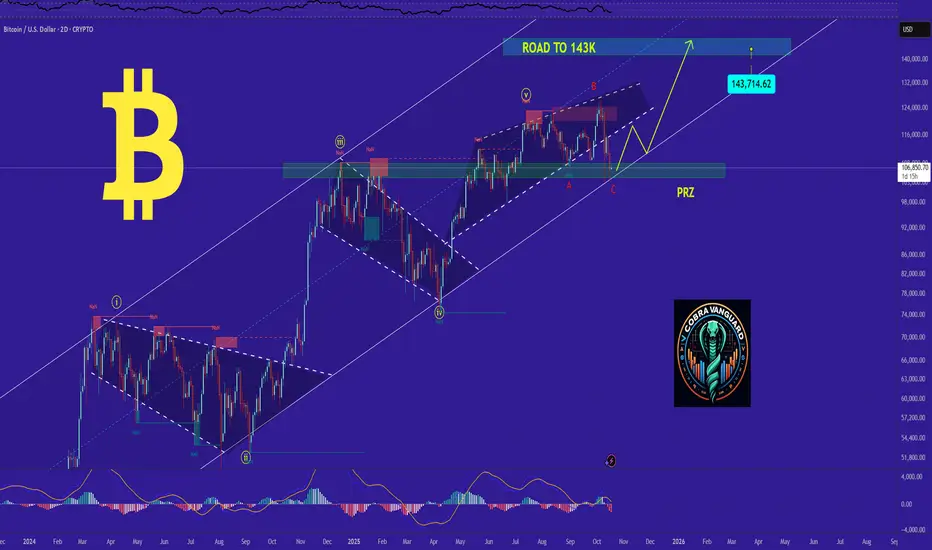
On the weekly chart, Bitcoin has entered a corrective phase after reaching the upper boundary of its ascending channel, and it’s now approaching a major demand zone.
This retracement appears to be a healthy pullback within the broader bullish trend, potentially setting the stage for the next upward move toward the channel top at $140,000.
As long as the price remains above the key support area and the ascending trendline, the bullish structure remains intact.
• A rebound and weekly close above $107,900 would likely reignite bullish momentum and confirm renewed buying strength.
Bearish Scenario (Invalidation):
If Bitcoin breaks below the support zone and closes under the trendline, this would invalidate the current bullish setup, potentially leading to a deeper correction toward lower levels.
Don’t forget to like and share your thoughts in the comments! ❤️

BTC: Sharp VolatilityBTC exhibited a trend of rising first and then falling, with overall intense volatility,reflecting the uncertainty and complexity of the market.
From the perspective of short-term technical indicators, after Bitcoin’s price broke below the key range of 109,000–110,000, this area has now transformed into a resistance level. Currently, the price is fluctuating within the 106,000–107,000 range: it faces resistance near 107,500 on the upside, while receiving support from the 103,000–104,000 range on the downside. If the price fails to break through the 107,500 resistance level effectively, it may continue to face downward correction pressure.
Buy 106000 - 106500
SL 105500
TP 107000- 107000
Sell 107500 - 108000
TP 109000
TP 106500 - 106000
Daily-updated accurate signals are at your disposal. If you run into any problems while trading, these signals serve as a reliable reference—don’t hesitate to use them! I truly hope they bring you significant assistance

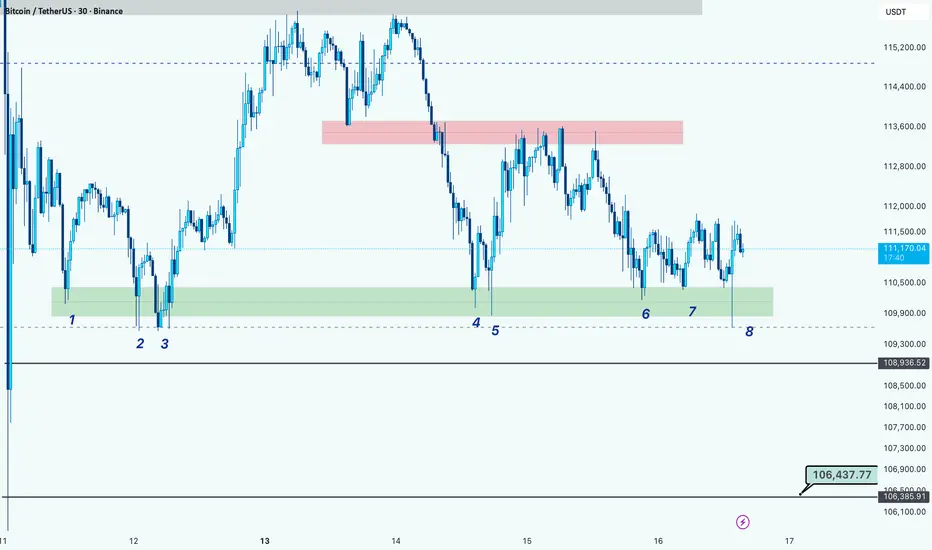
BTC Testing Key Support for the 8th Time, Breakdown Ahead?Hi guys!
BTC has tested the same support zone eight times around the $110,000 – $110,300 range (highlighted in green).
Repeated retests of a support level often signal weakening buyer strength, increasing the probability of a breakdown.
If the price manages to break below this zone, the next key support lies around $106,430, which could be the next target area for bears.
TradeCityPro | Bitcoin Daily Analysis #200👋 Welcome to the 200th Daily Bitcoin Analysis!
To celebrate this milestone, today’s analysis will be different, our main focus will be on the XAUBTC chart, but first, let’s analyze gold and Bitcoin separately before combining the two.
✅ Gold
📅 Monthly Timeframe
Gold is in a completely bullish trend on the monthly chart and, in its latest candle, has set a new all-time high (ATH) at $4,380.
💥 The momentum of this wave, which started from $1,980, is extremely strong — not only has the RSI entered the Overbought zone, but it has also broken through the Overextended level at 85.55 and now stands at 92.
💫 The last time gold’s RSI was in this range was in 1973, about 50 years ago, making this the strongest momentum in half a century.
🔍 Considering that gold has risen more than 100% without any major correction and has reached the 1.5 Fibonacci level, the probability of a correction is very high.
✨ If the price continues to rise sharply in the next few candles, the trend will become unsustainable, since there has been no major profit-taking — a warning sign for the continuation of the rally.
📊 In case of a correction, the main Fibonacci support levels are $3,500 and $3,000, which are potential targets if the retracement begins.
👀 If this happens, two possible scenarios emerge:
🏦 Increased gold supply, which is unlikely due to its scarcity.
Profit-taking by institutional “whales” (such as government treasuries), which is a much more probable reason for a correction.
💵 Bitcoin
📅 Weekly Timeframe
Bitcoin is in a bullish trend on the weekly timeframe, having completed seven upward waves, with the last peak recorded at $124,000.
✨ This top was a fake breakout, followed by a correction candle, and the price is now moving toward the $100,000 region.
🔽 A strong triple-top bearish divergence is visible on the RSI, with confirmation coming if 44.53 is broken.
📉 If confirmed, Bitcoin could enter a long-term corrective phase, with possible downside targets near $70,000.
🧩 However, the trend is still bullish as long as no lower high and lower low form below $100,000.
💡 This means Bitcoin could potentially make one more upward leg, forming a rare nine-wave pattern — uncommon, but possible.
⭐ Given that gold is likely entering a correction phase, the profits taken by gold whales could flow into crypto, potentially fueling Bitcoin’s next upward wave.
👑 Bitcoin Dominance (BTC.D)
📅 Weekly Timeframe
Bitcoin dominance has been in an uptrend, reaching 65.84%, but weakness in the trend and rejection from that level triggered a deep correction.
💫 After breaking 60.64, it fell to 57%, where it has since bounced.
📉 If dominance forms a lower high below 60.64 (or even below 65.84) and then breaks 57%, that would confirm a downtrend.
✔️ In that case, the dominance targets are 55.26, 51.06, and potentially 47.76.
🚀 This scenario suggests that if money flows from gold into Bitcoin, it may later flow into altcoins as dominance declines — setting the stage for a possible altcoin season.
🔑 XAUBTC Chart
🧮 This chart represents gold’s strength relative to Bitcoin.
As seen, its overall structure in recent years has been bearish, reflecting stronger investment interest in Bitcoin compared to gold.
📊 The trend remained bearish until early 2025, showing no weakness — until recently.
🔺 After finding support near 0.027, the trend has shown clear signs of weakening, and price action now hints at potential bullish reversal signals.
☘️ The price has already formed a higher low, and if it consolidates above 0.03922 next week, we’ll have the first confirmation of a trend reversal.
📈 The main bullish confirmation would come after breaking 0.04543.
⚡️ However, one possible scenario is that gold enters a correction phase while Bitcoin completes its final bullish wave.
✅ Since this chart faces two strong resistance zones, rejection from 0.03922 or 0.04543 could send it back toward 0.027, implying a gold correction and a final bullish leg for Bitcoin.
💥 Considering Bitcoin dominance may also drop, it’s likely that capital will first move from gold into Bitcoin, and then, as dominance falls, into altcoins — potentially triggering the long-awaited altcoin season where altcoins experience explosive rallies.
⚖️ This is just one possible market scenario; other outcomes are possible.
Remember: Always conduct your own research before making any investment decisions.

Next Bitcoin Target - $135,000Bitcoin is retesting a key Point of Control (POC) level around $105K.
So far, the level appears to be holding strong, and price action suggests Bitcoin is gearing up for another move higher.
The 2-week cycle indicator has already bottomed, and the 1-week indicator is expected to follow within the next 10 days.
November is shaping up to be a highly bullish month - potentially the last window for easy gains in this cycle.

Breakdown or Bounce Incoming? | BTC 4H Analysis D4🥳 Hey everyone! Hope you’re doing great! Welcome to SatoshiFrame channel .
✨ Today we’re diving into the 1-Day BITCOIN analysis. Stay tuned and follow along!
👀 Yesterday I shared Bitcoin’s daily analysis in the channel, and today we’re going to review the 4-hour timeframe, from its recent all-time high up to the present.
🔍 After setting its ATH, Bitcoin entered a descending channel (driven by profit-taking and reactivated whale activity). Each time price reached the top of this channel, it was rejected and moved toward the midline or bottom. The last touch of the channel’s top led to another drop toward the midline, and price failed to break above the channel. The major buy zone (micro buyer area) at the top of the channel was lost and has now turned into a key static resistance, overlapping with the dynamic channel resistance — creating a crucial pivot zone for Bitcoin’s potential trend reversal. The next key support lies below this zone at $105,634; a confirmed break and close below it could extend the downtrend further.
🧮 The RSI oscillator is currently fluctuating between 30 (support) and 50 (resistance). A breakout beyond either side — as highlighted in the chart — could add significant momentum to Bitcoin’s next move. These RSI levels are default static zones, which makes their reliability stronger.
🕯 After the massive flash crash that shook the crypto market, traders have shown a stronger inclination toward selling, keeping Bitcoin within this descending channel. As seen in the volume data, the flash crash was accompanied by extreme selling pressure, and whales broke the micro buyer zone with a large “whale candle.” Continued selling pressure could push Bitcoin toward lower supports, while renewed buying volume and whale re-entry could drive it back toward the channel top to test that resistance once more.
🧠 For those without open positions, here are two key scenarios to consider:
🟢 Long Setup: A breakout above the key static + dynamic resistance zone at $109,222, along with increasing buy volume and RSI crossing above 50, could be a solid long opportunity.
🔴 Short Setup: A confirmed breakdown below the nearest support at $105,634, accompanied by strong selling pressure and RSI falling below 30 into oversold territory, could present a strong short setup.
❤️ Disclaimer : This analysis is purely based on my personal opinion and I only trade if the stated triggers are activated .

Bitcoin , parabolic haven’t started yetBitcoin cycles getting weaker and weaker if we goes by the timeframe but what if it’s changed ? I said we’re repeating the 2017 cycle long ago and what I expect from the price is to break the blue channel and goes parabolic for a few months, after all wouldn’t it be so easy if everything was still the same ? The same October.
I expect the price to do much better, still holding from average 22k and not intended to sale yet , I think there is a little trick going on to make chaos and confuse everyone to not know when to get off.
The price is in a juicy good risk/reward zone based on this chart , if it breaks and consolidate down there we damned , if it don’t we’ll meet in Valhalla .
Let’s just observe for now

BTC Performance Recap for the week🎉This week, BTC generally exhibited intense volatility, following a trajectory of "continuing the previous uptrend first, then oscillating downward, and finally rebounding after touching support".
📝Monday: Continuing the Uptrend and Breaking Key Levels
Building on the upward momentum from the previous weekend, Bitcoin’s price smoothly broke through the key psychological level of 115,000 and did not stop there—it continued to climb to around 116,000, setting a stage of interim highs for the week’s trend.
📝Tuesday to Thursday: Oscillating Downward and Losing Key Support
The uptrend failed to sustain. Starting from Tuesday, Bitcoin entered a phase of oscillating decline; its price gradually pulled back and broke below the short-term key support level of 110,000 in the process. Downward pressure continued to release, and the weak sentiment persisted all the way to Friday.
📝Friday: Bottoming Out, Rebounding on Support, and Consolidating in a Narrow Range
On Friday, when the price further dipped to just above 103,000, it received strong support at this level and staged a rebound, easing the previous downward momentum. However, the rebound lacked strength and failed to retake the 110,000 level.
📝As of now, it remains fluctuating in a narrow range between 106,000 and 107,600.
💡It was mainly influenced by a combination of factors including macroeconomic policies, market sentiment, and technical indicators. The details are as follows:
💎Reasons for the Early Rally
1-Impact of Expectations for Fed Interest Rate Cuts
The Federal Reserve (Fed) launched an interest rate cut cycle in September 2025. The market expects two consecutive rate cuts in October and December, and the anticipated decline in both nominal and real interest rates has increased the appeal of Bitcoin as a non-interest-bearing asset. This attracted inflows of some funds, driving up its price.
2-Support from Sovereign Nations’ Strategic Reserves
The Trump administration established the U.S. Strategic Bitcoin Reserve, incorporating Bitcoin into the national economic asset framework—a move that triggered emulation by many countries. The number of listed companies holding Bitcoin globally has increased significantly, with a total of large Bitcoin holdings. This "digital gold" positioning has significantly boosted Bitcoin’s weight in global asset allocation, pushing its price higher.
3-Impact of Historical Cyclical Patterns
Over the past decade, Bitcoin has achieved an average return rate of over 22% in the month of October. In October this year, the balance of the U.S. Treasury General Account is approaching the $850 billion target, and expectations of funds flowing back into the market have also provided support for Bitcoin’s price.
💎Reasons for the Late Decline
1-Panic Triggered by Trade Policies
On October 10, U.S. President Trump threatened to impose a 100% tariff on Chinese goods, sparking market concerns about an escalation of the global trade war. Investors’ risk appetite declined, and funds flowed out of risky assets such as Bitcoin, leading to a price drop.
2-Substitution Effect of Gold
Gold prices have recently climbed to a record high above $4,300, with a cumulative increase of 18% in the past month. Due to gold’s strong momentum and lower volatility, funds have clearly favored gold more. Some investors shifted from Bitcoin to gold, suppressing Bitcoin’s price.
3-Sell-Off Triggered by Technical Breakdown
Bitcoin fell below the 2025 "realized price" level—a key technical indicator that tracks the average withdrawal price of all wallets. Sustained trading below this level triggered further sell-offs by holders seeking to limit losses. Additionally, after Bitcoin broke below the key support level of $111,000, automated trading systems and stop-loss orders were triggered, intensifying selling pressure.
4-Cascading Margin Calls Driven by High Leverage
Bitcoin’s price decline led to nearly 300,000 margin calls in the cryptocurrency market, with a total liquidation value of $1.221 billion. A large number of leveraged long positions accumulated earlier were forced to close out amid the price drop, forming a vicious cycle of "decline → margin call → further decline" and amplifying downward pressure on the price.

BTC to 70kThis is my idea on $BINANCE:BTCUSDT. We all know BINANCE:BTCUSDT hit all time high reached 70k in 2021. In 2024 we all witnessed BITSTAMP:BTCUSD able to break all time high reached new high which is 126k. Was there any consolidation after breaking high 70k? yes there was but BITSTAMP:BTCUSD never able to check 70k from above, you can say there is a gap BITSTAMP:BTCUSD must come to fill. There are few minor support zones which may able to hold BITSTAMP:BTCUSD but I wouldn't trust those areas which is around 100k, 86.5k, 75k. If BINANCE:BTCUSDT ever reach 75k-70k that means BTC is ready to make higher high. In worst case scenario we might see 65k 60k 50k, which may caused by Trump speaking or any other major news related to USD.

BTC Outlook after the Dip. What to expect NOW? As I mentioned earlier, the price has reached the bottom of the channel and completed the final bearish wave. I'm hopeful that Bitcoin will respect the technical setup and begin a bullish wave from here.
!!! However, Bitcoin might surprise everyone and break the channel structure.so we need to wait for confirmation, which I believe will become clear by tomorrow.
Follow us for upcoming updates and market insights.
PREVIOUS ANALYSIS
Bitcoin: Holding 106,000 – Retest Risk AheadHello everyone,
After reaching the peak of 109,236 USD, Bitcoin has sharply reversed and entered a clear lower low – lower high structure. The consecutive drops highlight that sellers are still in control, forming multiple Fair Value Gaps (FVGs) along the way — particularly around 115,000 → 112,500 → 109,000 USD. These gaps may act as future pullback targets, but for now, the market bias remains bearish. Price has retreated to 106,770 USD — a strong support zone previously tested multiple times. If selling pressure eases, this could serve as a short-term “technical landing” before Bitcoin attempts a minor recovery.
Looking at the Kumo Cloud, the 109,000–109,200 USD zone stands out as firm resistance. Recent candles repeatedly tapped into the cloud but were pushed down, showing weak buying momentum. As long as the price remains below the Kumo, bullish confirmation is lacking — only a decisive breakout above would signal a potential trend reversal.
On the macro side, the Fed remains firm on its hawkish stance — keeping rates high and showing no signs of cuts anytime soon. This continues to weigh on risk assets like Bitcoin, as capital prefers to stay in USD and bonds. Meanwhile, tightening crypto regulations in the US and Europe have made investors more cautious. Geopolitical tensions between the US and China also dampen global risk appetite, adding further pressure on Bitcoin. The only bright spot lies in the possibility of a short-term USD pullback — if that happens, Bitcoin might stage a technical rebound, though it’s still too early to call for a full bullish cycle.
Based on the current price structure, I lean toward the scenario where Bitcoin extends its decline to test the 105,000–104,500 USD zone — a key support cluster aligned. This area could attract dip-buying interest, but if the market fails to hold above it, a drop toward 102,000 USD becomes likely. In a more bearish scenario — if 104,500 USD is broken without any sign of recovery — Bitcoin may head for the 100,000 USD zone.

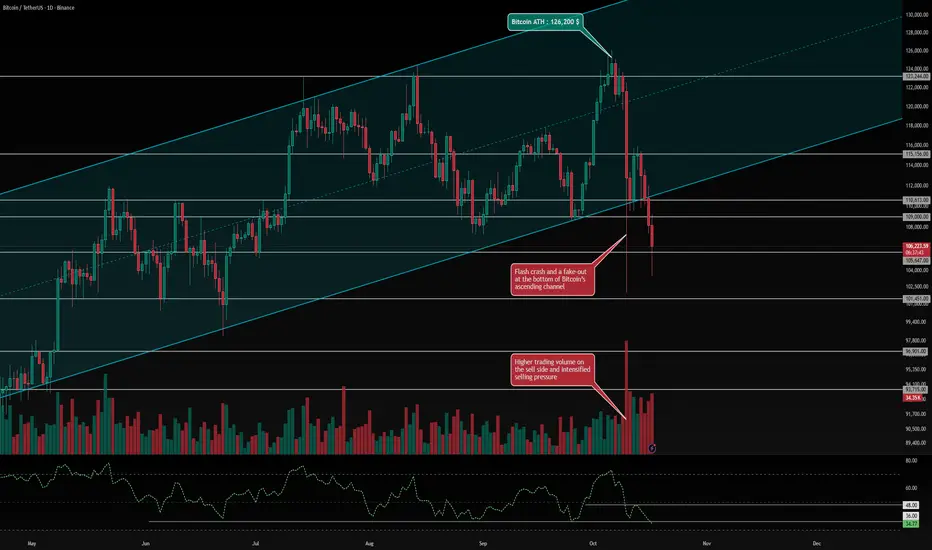
BITCOIN From ATH to Breakdown | BTC 1D Analysis D3😎 Hey everyone! Hope you’re doing great! Welcome to SatoshiFrame channel .
👍 Today we’re diving into the 1-Day BITCOIN analysis. Stay tuned and follow along!
👀 Bitcoin has been trading within a strong ascending channel, recently hitting the upper boundary and setting a new all-time high (ATH) at $126,200. However, this was immediately followed by a flash crash that wiped out roughly $20 billion in futures positions. During the crash, the lower boundary of the ascending channel was also fake-broken, after which buyers temporarily pushed the price back inside the channel. Yet, due to extreme market fear and uncertainty, Bitcoin lost its key support zone at $110,613, continuing the downtrend that began with the flash crash. With yesterday’s daily candle close, Bitcoin officially broke down from its ascending channel, and price action is now heading toward lower support levels. The nearest support lies around $105,647, and if this zone fails to hold, Bitcoin could extend its decline toward the next support at $101,451.
🔍 Bitcoin currently faces two major resistance zones at $109,000 and $110,613. A confirmed breakout above these could signal the start of a reversal, but the main long trigger is located at $115,156. If Bitcoin breaks and holds above this zone with strong buying volume, it could mark the beginning of a powerful bullish leg, potentially leading to a new ATH.
🧮 The RSI oscillator is now sitting near its support region around 36. A daily close below this level would strengthen bearish momentum and could push RSI into oversold territory. The midline resistance sits near 48, and a breakout above this would indicate a possible trend reversal toward renewed bullish momentum.
🕯 Recent candlestick volume shows extremely high selling pressure, marking one of the most intense liquidation waves in recent crypto history. The number of red candles has surged in recent days, suggesting a continuation sell-off pattern, with traders increasingly favoring short positions. The market is currently in extreme fear, and for any bullish reversal to occur, Bitcoin would need massive buy-side volume and strong support to push prices back up. Without that, more long-term holders may start selling as well.
🧠 Current Scenarios (Daily Timeframe) — Patience is key. If you haven’t already entered a short based on previous analyses, consider these setups:
🟢 Long Scenario: Enter on a confirmed breakout and consolidation above $115,156, accompanied by a spike in buying volume and an RSI move above 48.
🔴 Short Scenario: Enter on a confirmed breakdown and close below $105,647, which could trigger a deeper correction toward lower levels. This move would likely coincide with continued selling pressure and RSI dropping below 36 into the oversold zone.
❤️ Disclaimer : This analysis is purely based on my personal opinion and I only trade if the stated triggers are activated .
$BTC - The Correction Structure...! 10/17/2025
Bitcoin ( CRYPTOCAP:BTC ) is likely to extend its decline to complete the wave Y (Red) structure, targeting one of the wave Z (Blue) levels at $102,300 or the extended $93,700.
The decline reached $103,516 today! Is this it! if we considered slight truncation here and there at the endpoints of the structure segments then it's possible to satisfy Z=W probability (in Blue) but that remains to be verified at lower time frames.
Overall, wave Y is most likely the last segment of major correction pattern (Red WXY) and represents an ascending corrective setup characterized by its complex structure (Blue WXYXZ) and directional shifts, which set the stage for significant distribution and a major selling zone near the peak.
The worst-case scenario occurs if the wave Y structure range (in Blue) matches the size of wave W (in Red), pegged at $93,700.
Traders should monitor these levels closely for potential reversal signals and prepare for increased volatility as the pattern unfolds.
Happy Trading! 😎

BTC: Today's predictions and operations have been verified👏Today, our predictions for BTC have been verified by the market.
✔1-Judgment on Short-Term Market Nature: After Bitcoin experienced a sudden sharp surge at the opening, we accurately judged that "this surge was a short-term fluctuation lacking sustained support". Subsequently, the price fluctuated downward rapidly and fell back to the oscillating range, which fully validated the judgment that "it was not a trend reversal".
✔2-Trend Direction Prediction: We clearly proposed the downward target level of 103,000. After Bitcoin dropped to just above 103,000 and then rebounded, this fully confirmed our judgment.
🎉Today, we have successfully concluded this week’s trading and work. Next week, we will continue to provide you with more accurate market interpretations and operation references from a professional analytical perspective. Finally, we wish you all a relaxing and pleasant weekend in advance!
