BTCUSD; Heikin Ashi Trade IdeaLast time we had big divergence on MACD and weekly TF, we had big correction...
BTCUSDT

BTC: Monthly FVG Retest Before New ATHCurrent Status: The price is around $104,447 and is currently in a strong corrective move after reaching a recent high.
All-Time High (ATH): The previous peak is marked near $126,311. This is the key long-term target.
Monthly Fair Value Gap (FVG): The blue box between approximately $95,000 and $98,000 is a "Monthly FVG". This area is expected to act as a magnet for the price to retrace to.
Projected Path: The analyst expects the price to drop further into the Monthly FVG (the $95k - $98k zone) before finding strong support. Following this test, a major rally is projected to push the price back up to hit the All-Time High near $126,311.
The main idea is a deep correction to a technical support level (FVG) followed by a bullish continuation to a new ATH.

BTC: The next downside target looking at 103,000The price of BTC continued to decline today. The previous key support level of 109,500 was broken, and the moving average system was also in a bearish arrangement, exerting pressure on the price.
In terms of technical indicators, according to relevant analysis, Bitcoin's MACD indicator showed a bearish signal. Although the RSI indicator was in a neutral area, the price was lower than both the short - term and long - term moving averages, and the trading volume significantly shrank, indicating insufficient market momentum, an unhealthy price - volume relationship, and weak reversal signs. In addition, from the perspective of the 4 - hour K - line, the MACD histogram remained negative but gradually became shorter, indicating that the strength of the bulls was increasing, but the KDJ indicator had no golden cross or death cross, remaining neutral overall.
In terms of market sentiment, the continuous weakness of Bitcoin made the market sentiment more cautious, and the confidence of the bulls was somewhat damaged.
If Bitcoin cannot regain 110,000 in the short term, the price may continue to fall, and the next target may be around 103,000.
Sell 107000 - 106000
SL 108000
TP 105000 - 104000
Daily-updated accurate signals are at your disposal. If you run into any problems while trading, these signals serve as a reliable reference—don’t hesitate to use them! I truly hope they bring you significant assistance

Bitcoin Bearish Continuation from Daily FVGa bearish continuation setup on Bitcoin (BTC/USD) in the daily timeframe.
After a sharp rejection from the Daily Fair Value Gap (FVG) zone between roughly $114,000–$120,000, price shows strong bearish momentum. The large red candle indicates sellers’ dominance, and the marked downward arrow projects a potential move toward lower support zones around $108,000 and $105,000, which act as the next liquidity levels or demand areas.

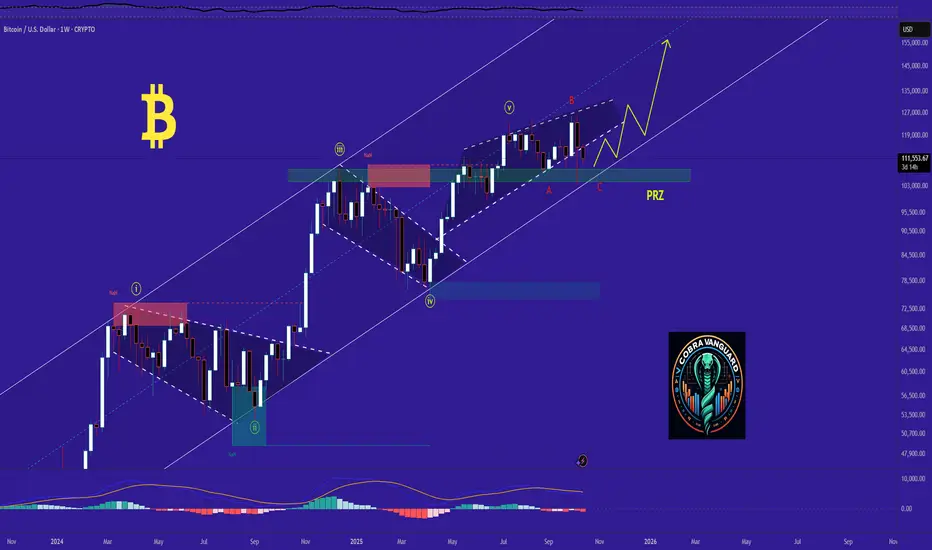
BTC Top in play. The diagonal at 95k–98k is the last defenceYou have seen this movie. The current weekly structure mirrors the Jan to Nov 2021 distribution: two peaks, heavy swings, then loss of momentum that led to a full cycle retrace. Back then Bitcoin set an all time high in November 2021 after a prior April peak, then rolled over.
Here is the read. Treat the rising weekly diagonal on the chart as your line in the sand. That line aligns with the 95k to 98k area. Hold above it and the uptrend stays intact. Lose it on a weekly close and trend shifts down with room for a deeper retrace. This is standard trend line and support logic. A break of support signals direction.
Why compare to 2021. That cycle topped after a double top style range and then unwound sharply. The pattern of repeated rallies that fail at highs fits that script. Double tops mark bearish reversals after an advance.
What to do now. Focus on the diagonal and the 95k to 98k zone. Watch weekly closes, not intraday wicks. If price closes below the line, accept the downtrend and step aside or trade with the trend. If price reclaims the recent weekly high and holds, the top thesis is invalid. Use the chart, not opinions.
Context for new readers. In the last full cycle Bitcoin peaked near 69k in November 2021 and then fell into a bear market, which is why this comparison matters.

Bitcoin at Heavy Supports – Time to Go Long?As I expected in my previous idea , Bitcoin ( BINANCE:BTCUSDT ) completed both its bullish and bearish moves and hit its Long and Short targets .
Bitcoin can still see some upside as long as it holds this Heavy Support zone($111,980-$105,820) . However, given the recent momentum and the wick down to around $102K a few days ago, any further rally depends on breaking the Resistance zone($118,750-$115,730) and touching around $117,220 , which is the high of that significant bearish candle .
Currently, Bitcoin is sitting in a Heavy Support zone($111,980-$105,820) near the 200_SMA(Daily) and a Cumulative Long Liquidation($108,415-$107,156) . It's basically hovering between key weekly support lines, so this is a pretty strong supports .
In terms of Elliott Wave theory , it looks like Bitcoin is still completing its wave 4 . This wave 4 might have formed a Double Three Correction(WXY) , and now we can expect a potential upward move .
I expect that in the next few hours, Bitcoin may start a short-term bullish move up to around $115,000 or to the Cumulative Short Liquidation Leverage($114,973-$113,435) .
Note: Overall, it's better to look for Long positions right now, considering Bitcoin's position. But if it breaks the 200_SMA(Daily) and the Heavy Support zone($111,980-$105,820), we could see a broader crypto market drop.
Note: Around the $108,000 level, we have huge buy orders stacked up, which might act as a significant support zone.
Please respect each other's ideas and express them politely if you agree or disagree.
Bitcoin Analysis (BTCUSDT), 4-hour time frame.
Be sure to follow the updated ideas.
Do not forget to put a Stop loss for your positions (For every position you want to open).
Please follow your strategy and updates; this is just my Idea, and I will gladly see your ideas in this post.
Please do not forget the ✅' like '✅ button 🙏😊 & Share it with your friends; thanks, and Trade safe.

BTC/USDT: Bullish Bounce to 115,400?BINANCE:BTCUSDT is showing signs of a bullish bounce on the 1-hour chart , where price is approaching a downward trendline with potential support confluence, suggesting a reversal opportunity if buyers defend the key levels. The entry zone aligns near this support area , setting up for an upside move toward higher resistances amid recent volatility.
Entry between 109,500-110,200 for a buy position. Target at 115,400 near the take profit zone, offering a risk-reward ratio greater than 1:4 . Set a stop loss on a close below 109,000 to manage downside risk effectively.
Watch for confirmation with a strong bullish candle and rising volume breaking above the entry, capitalizing on Bitcoin's resilience in the crypto market.
Fundamentally, today we have several speeches from Federal Reserve members, along with the Philadelphia Fed Manufacturing Index and Philly Fed Employment report, which could spark volatility in USD pairs and indirectly impact BTC sentiment. 💡
📝 Trade Plan:
✅ Entry Zone: 109,500 – 110,200 (buy zone near support confluence)
❌ Stop Loss: Close below 109,000
🎯 Target: 115,400 (major resistance zone / take-profit area)
💎 Risk-to-Reward: Greater than 1:4, offering an attractive trade setup.
What's your view on this setup? Drop your thoughts below! 👇

Stop!Loss|Market View: BTCUSD🙌 Stop!Loss team welcomes you❗️
In this post, we're going to talk about the near-term outlook for the BTCUSD ☝️
Potential trade setup:
🔔Entry level: 107,294.21
💰TP: 99,296.41
⛔️SL: 113,888.88
"Market View" - a brief analysis of trading instruments, covering the most important aspects of the FOREX market.
👇 In the comments 👇 you can type the trading instrument you'd like to analyze, and we'll talk about it in our next posts.
💬 Description: Given the technical accumulation of the price near the lower border of the accumulation area 110,500 - 121,810, as well as a decline in open interest in the BTC futures market (medium- to long-term picture), a breakout of the lower border of the indicated accumulation area is expected. The key target is near 100,000, with a further decline to 90,000 expected.
Thanks for your support 🚀
Profits for all ✅
❗️ Updates on this idea can be found below 👇

BTC TO 94k BEFORE 140k TOP?I don't think the bull run is over, but I do see BTC going below 100k to 93-94K area.
Will look to add a buy limit in this area because I believe it will retest that area before creating the last leg up to ATH and top of the bull market, which I believe to be around 140k-160k BTC.
Regardless, BTC is the best asset class of this generation and I'll continue to DCA into it for my long term bags.

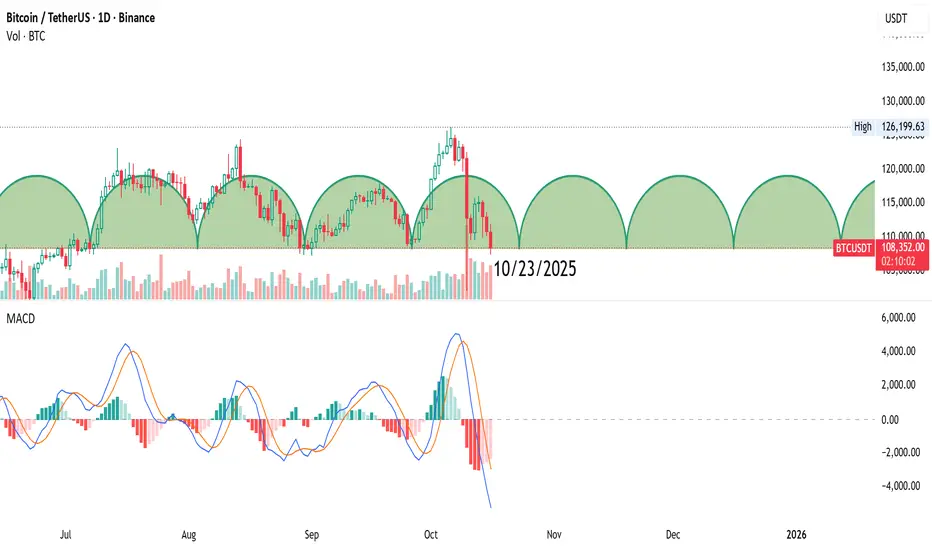
This is to show you when to place a buy orderThe daily trading cycle will start again around 10/23. After that wave, I am seeing a bear market coming, unless it creates new highs in both prices and MACD.
$BTC gathers strength ahead of new run.Bitcoin, as seen in previous movements, continues its upward movement after a brief accumulation period above the demand zone after the price has run.
Stoch RSI indicator, however, supports the upward movement after a complete cooling.
Generally, this structure signals the beginning of a new parabolic phase.
Currently, the price is regaining strength above the demand zone, and preparations for the next major run are quietly taking shape.

Bitcoin at critical levels !!!!BTC needs to show some strength here, as if it breaks down below the horizontal support defined by the current lows, a LL will be printed. A LL will confirm bearish intent, particularly if it is backed by volume. The trend oscillator, although lagging, remains bearish, and Momentum oscillators are indicating potential volatility to the upside as the bulls attempt to respond.
BTC: Full verification of today's trend prediction👏Our prediction for today's BTC trend has been validated by the market, with the core logic highly aligned with the actual price movement. We targeted the risk of support level breakdown, and the downside target was accurately hit:
1 Trend Reversal Judgment
We clearly indicated in our signal that the 110,000 level is a key short-term support for BTC, if this level is breached, the price would fall further. Today, Bitcoin broke below the 110,000 support as expected, verifying our trend judgment that "support levels are prone to breaking under bearish dominance".
2 Downside Target Verification
Regarding the trend after the breakdown, we predicted in advance that the target level would be around 108,000. The actual market movement was in complete consistency with our prediction: after breaking below 110,000, Bitcoin continued to decline and accurately reached the area around 108,000, demonstrating our precise grasp of bearish momentum and key price levels.
💎Our today’s prediction for Bitcoin was based on the core framework of "technical key level breakthrough + trend continuity": it focused on the "bearish inertia following the breach of key support" for Bitcoin, and incorporated the deduction of market sentiment and volume logic. Ultimately, this achieved a high degree of alignment between the prediction and the actual market trend.

BTC: The key lies in the 110,000 supportFrom the 4-hour candlestick chart, since Bitcoin’s periodic high of approximately 126,000, a complete descending trend structure has been formed. Moving averages across all timeframes have created heavy dynamic resistance above the candlesticks, indicating that the market is currently in a phase dominated by bears.
This decline has triggered the spread of panic sentiment in the market, with a large number of investors choosing to take profits at high levels, further increasing selling pressure.
Today, the key focus is on whether the 110,000 support level holds. If this 110,000 support is broken, Bitcoin prices may fall further to 108,000 or even lower, as the market needs more time to digest the current negative sentiment and macroeconomic pressures.
💎
Buy 109000 - 109800 TP 110800 - 111800 SL 108000
Sell 112000 - 111800 TP 111000 - 109000 SL 112500
Daily-updated accurate signals are at your disposal. If you run into any problems while trading, these signals serve as a reliable reference—don’t hesitate to use them! I truly hope they bring you significant assistance

Bitcoin (BTC/USD) Bearish Continuation After Liquidity GrabThe BTC/USD daily chart shows a bearish structure forming after a sharp rejection from the upper resistance area near $116,000–$117,000. The large red candle at the top indicates a strong liquidity sweep, where price briefly moved higher to collect buy-side liquidity before reversing downward.
Following this, a series of smaller candles suggest consolidation under the resistance zone, with a clear lower-high formation, signaling potential continuation to the downside. The blue-shaded box represents a premium zone (supply area) where sellers are expected to remain dominant.
The projected black arrow path on the chart shows an anticipated pullback toward the mid-level ($112,000–$113,000) before continuation of the bearish move targeting the $108,000–$109,000 zone — a potential demand or support area.
Summary:
Trend: Bearish continuation
Key resistance: $115,000–$117,000
Short-term pullback: $112,000–$113,000
Target zone: $108,000–$109,000
Market sentiment: Bearish after liquidity grab and lower-high formation

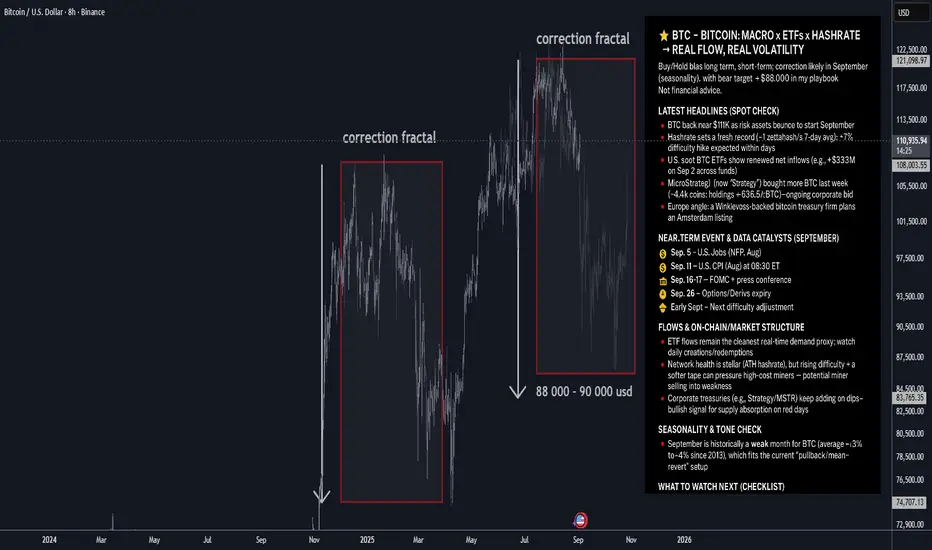
BTC — Bitcoin: Macro x ETFs x Hashrate → Real Flow, Real Volatil⭐️ BTC — Bitcoin: Macro x ETFs x Hashrate → Real Flow, Real Volatility
Buy/Hold bias long term; short-term: correction likely in September (seasonality), with bear target ≈ $88,000 in my playbook.
🔥 Latest headlines (spot check)
🔸BTC back near $111K as risk assets bounce to start September.
🔸Hashrate sets a fresh record (~1 zettahash/s 7-day avg); a >7% difficulty hike is expected within days. Network is the strongest ever, but miner margins tighten.
🔸U.S. spot BTC ETFs show renewed net inflows (e.g., +$333M on Sep 2 across funds). Flows remain a key daily demand gauge.
🔸MicroStrategy (now “Strategy”) bought more BTC last week (~4,4k coins; holdings ≈ 636.5k BTC)—ongoing corporate bid.
🔸Europe angle: a Winklevoss-backed bitcoin treasury firm plans an Amsterdam listing, signaling appetite for listed BTC exposure in the EU.
🗓 Near-term event & data catalysts (September)
🔸Fri, Sep 5 — U.S. Jobs (NFP, Aug) at 08:30 ET. Labor softness would bolster rate-cut odds and risk appetite; a beat could do the opposite.
🔸Wed, Sep 11 — U.S. CPI (Aug) at 08:30 ET. Inflation surprise drives real-rate expectations → BTC beta.
🔸Tue–Wed, Sep 16–17 — FOMC + press conference. Policy path & dot plot = macro volatility for BTC.
Fri, Sep 26 — Options/Derivs expiry:
• Deribit monthly BTC options expire 08:00 UTC (last Friday rule).
• CME Bitcoin monthly options settle Sep 26 as well.
These expiries often amplify gamma flows and spot-vol.
Early Sept — Next difficulty adjustment likely >7% up (tightens miner economics short-term).
Medium-dated overhang
Mt. Gox creditor deadline: Oct 31, 2025. Any schedule/details update could swing “supply overhang” narratives.
📈 Flows & on-chain/market structure
🔸ETF flows remain the cleanest real-time demand proxy; watch daily creations/redemptions. 🔸Sustained positives tend to align with spot strength; outsized outflows can weigh on price.
🔸Network health is stellar (ATH hashrate), but rising difficulty + a softer tape can pressure high-cost miners → potential miner selling into weakness.
🔸Corporate treasuries (e.g., Strategy/MSTR) keep adding on dips—bullish signal for supply absorption on red days.
🧠 Seasonality & tone check
September is historically a weak month for BTC (average ~−3% to −4% since 2013), which fits the current “pullback/mean-revert” setup.
📣 Social/flow buzz (signals, not noise)
🔸ETF flow posts (Farside, Bloomberg desks) are getting traction again—watch after U.S. close for prints.
🔸Saylor/Strategy buying headlines keep the “corporate bid” narrative front-and-center.
🧭 Levels & plan (author’s framework)
🔸Bias: Long-term constructive; near-term: correction mode likely extends through September (seasonality + event risk).
🔸Bear target: $88,000 (where I’d expect volatility to attract responsive buyers).
🔸Invalidation for bears (tactical): A strong reclaim/close above ~$113K–$115K with improving 🔸ETF inflows would weaken the pullback thesis.
🔸Sizing: Respect macro data days (NFP/CPI/Fed) and options expiry week—expect higher realized vol.
🗺 What to watch next (checklist)
🔸Daily U.S. spot BTC ETF flows (post-close updates). Momentum if creations persist; caution on redemptions clusters.
🔸Sep 5 — NFP (Aug) 08:30 ET. Risk-on if soft; risk-off if hot.
🔸Sep 11 — CPI (Aug) 08:30 ET. Headline/core surprises steer the FOMC tone.
🔸Sep 16–17 — FOMC + presser. Watch guidance on cuts, balance sheet, and growth.
🔸Sep 26 — Deribit & CME monthly expiries. Positioning/“max pain” dynamics into that Friday.
Difficulty adjustment (early Sept). If >7% up as projected, monitor miner behavior/sell pressure.
TradeCityPro | Bitcoin Daily Analysis #198👋 Welcome to TradeCity Pro!
Let’s move on to the Bitcoin analysis. The price is in a very sensitive area, so it’s important to have a proper analysis.
⏳ 1-Hour Timeframe
Bitcoin is still near its support zone and is ranging around 110,420.
⭐ The top of the range is 111,714, and the price is forming a compression.
✨ At the same time, the RSI has formed a range between 30 and 50 and is oscillating.
📊 If 110,420 breaks, the probability of breaking the range increases significantly, and this level can serve as a good early short trigger.
📈 For long positions, we can open the first position on a break of 111,714. The next entry points would be 113,218 and 115,698.
🔔 Currently, market volume is very important and decisive; the volume favors sellers, which increases the probability of a bearish scenario. If this volume persists, Bitcoin’s support zone could break.
💥 However, if we see a change in volume and buying volume exceeds selling volume, we can expect Bitcoin to be supported in this area and move upwards.
❌ Disclaimer ❌
Trading futures is highly risky and dangerous. If you're not an expert, these triggers may not be suitable for you. You should first learn risk and capital management. You can also use the educational content from this channel.
Finally, these triggers reflect my personal opinions on price action, and the market may move completely against this analysis. So, do your own research before opening any position.

Mastering the Hanging Man PatternAlright, traders, let’s talk about the Hanging Man candlestick pattern.
This one’s a classic, and if you know what you’re looking at, it can be a game changer when you’re spotting potential reversals. So, what exactly is the Hanging Man pattern, and how can you use it to your advantage? Let’s break it down.
What Is the Hanging Man Pattern?
The Hanging Man pattern appears when the market has been pushing higher, and then—bam—a sign that it could be running out of steam. It’s called the Hanging Man chart pattern because the candlestick looks like a little figure hanging by its feet, with a long lower wick. The body is small, and the lower shadow is long—typically at least twice the size of the body. This shows that while buyers were in control, sellers came in strong towards the end of the session, pushing prices lower.
Hanging Man candles can be red or green. Even though the candle is green, it still suggests the same potential reversal because the rejection of higher prices by the sellers shows weakening bullish pressure. The key point to remember is that the Hanging Man candle pattern signals potential exhaustion in an uptrend. It doesn’t guarantee that the trend is reversing, but it highlights that the bullish momentum is waning, which could be a sign that a reversal is near.
Where to Look for the Hanging Man Pattern?
Context is everything. The Hanging Man pattern is much more significant when it appears at the top of an uptrend. In this case, it suggests that buyers are losing control, and the market could soon turn bearish. If it appears after a downtrend, it’s known as an Inverted Hammer, and its interpretation is different—it could signal a potential reversal to the upside.
So, while the Hanging Man is typically seen as a bearish reversal indicator after a sustained uptrend, it is crucial to recognize that the context matters. A Hanging Man at the peak of a strong bullish trend often attracts attention from traders as a potential signal for a shift in momentum.
How to Confirm the Reversal?
The key to using the Hanging Man pattern effectively is the confirmation candle. After spotting the Hanging Man candlestick pattern, you’ll want to wait for a bearish candlestick in the next session that closes below the low of the Hanging Man candle. This confirms that sellers have taken control and that the market is likely heading lower.
It’s also important to consider the volume during the confirmation. A strong bearish Hanging Man pattern with higher-than-usual volume adds strength to the reversal signal. If the confirmation candle has low volume, it might not carry as much weight, so always consider the volume when confirming the pattern.
However, the Hanging Man candlestick pattern is not foolproof. A Hanging Man trading pattern without confirmation can sometimes lead to a false reversal, especially in markets with high volatility or when the overall trend is still strong.
False Signals and Pitfalls
One of the biggest challenges when trading the Hanging Man pattern candlestick is false signals. In choppy or sideways markets, the pattern may form but fail to lead to a true reversal. To avoid these traps, consider waiting for the confirmation candle and also use other tools to verify the signal, like:
Trendlines: Ensure the market is actually in an uptrend before considering the Hanging Man pattern.
Support/Resistance Levels: Wait for a breakdown below a significant support level to increase confidence in the reversal.
Momentum Indicators (e.g., RSI or MACD): Use momentum indicators to confirm that buying pressure is truly weakening, as suggested by the Hanging Man pattern.
These additional tools can help you filter out false signals and increase the reliability of your trades.
The Hanging Man pattern can be a valuable tool when used correctly, but it’s not a standalone signal. It works best when combined with other forms of technical analysis, such as momentum indicators, trendlines, and volume analysis. Be patient, wait for confirmation, and always manage your risk. The Hanging Man trading pattern is a great addition to your candlestick pattern toolbox, but it should be used as part of a broader strategy that includes multiple indicators and sound risk management.

Can BTC break the 111681$ resistance? | BTC 1H Analysis D2👋 Hey everyone! Hope you’re doing great! - ❤️ Welcome to Satoshi Frame .
📅 Today we’re diving into the 1-hour Bitcoin analysis. Stay tuned and follow along!
👀 On the 1-hour timeframe of Bitcoin (BTC), we can see that — similar to USDT.D — it is moving within a range box, but inversely positioned near a Maker Buyer support and a multi-timeframe Low at $111,681. A confirmed breakout above this zone could push Bitcoin upward toward the box midline.
🧮 Looking at the RSI oscillator, we can see that it’s currently oscillating between the Oversell (30) Low and the static ceiling around 53. A breakout beyond either of these boundaries would likely signal the start of Bitcoin’s next move.
🕯 Recent volume on Bitcoin has increased as it reached the Maker Buyer zone — strong buying pressure from market makers has helped defend this support level effectively. Right now, Bitcoin sits just below a resistance area that will require a significant uptick in buying volume to break and confirm stability above it.
🧠 For Bitcoin positioning, we can consider that this current Low is very strong and unlikely to break easily, so the main focus should remain on long positions:
🟢 Long Scenario: Once Bitcoin breaks the multi-timeframe resistance at $111,681, combined with RSI surpassing the 53 threshold and a visible increase in buying volume, a long position setup becomes valid.
🔴 Short Scenario: Since the Maker Buyer support is very strong and USDT.D has been repeatedly rejected at its top, it’s better to wait until the Maker Buyer zone breaks with a large whale candle before considering short setups.
❤️ Disclaimer : This analysis is purely based on my personal opinion and I only trade if the stated triggers are activated .

BTC/USD - Bearish SetupBitcoin is currently trading within a clear downtrend on the 4-hour chart. Multiple bearish confluences suggest that further downside is likely. Based on recent price action and Fibonacci extension levels, I have identified three potential take-profit targets for a short trade setup.
📉 Bearish Confluences:
Rejection at the EQ of Descending Channel
Price was rejected at the equilibrium level of the descending channel, reinforcing the strength of the ongoing bearish trend.
EMA Ribbon Resistance
Price is consistently getting rejected by the red and brown EMA ribbons, acting as dynamic resistance and confirming downward momentum.
Weak Bounce with Low Volume
The recent bounce lacked significant volume and follow-through, signaling weak buyer interest and potential for further downside.
Bearish Market Structure
The chart shows a clear pattern of lower highs and lower lows since early October, confirming a bearish market structure.
🎯 Fibonacci Extension Targets:
Based on the recent swing high (~111,780) and swing low (~110,056):
TP1 - 0.618 Extension: 105,741
This level aligns with a lower support zone of the descending channel and could serve as the first reaction point.
TP2 - 1.0 Extension: 103,150
A full extension move, potentially reaching key historical support or volume areas.
TP3 - 1.618 Extension: 99,820
A deep target near the golden Fibonacci extension area, likely marking the end of this bearish leg unless strong reversal catalysts appear.

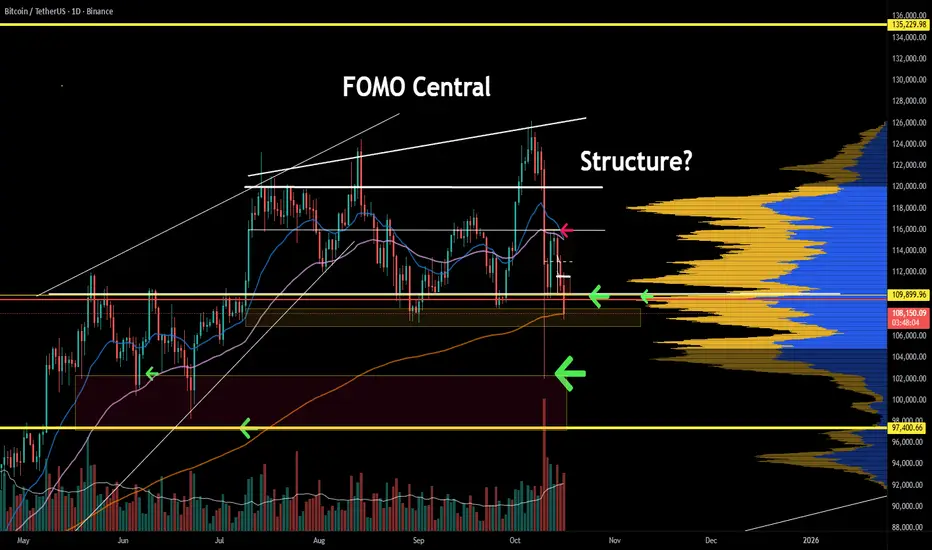
Could $BTC Fill the 100k Wick?Bitcoin is trying to hold the 109k level, though order books remain significantly thin in this low-volume environment.
The 114–115k zone is the key hurdle CRYPTOCAP:BTC needs to reclaim. If it fails to break back above, there’s a higher chance we’ll fill the liquidation wick down to around 100K–99k, allowing the price to establish a value area at a discount.

bitcoin Outlook after the Dip. What to expect NOW?After breaking out of the descending wedge, the price is now working to complete its corrective wave. This move could extend down to the bottom of the ascending channel before initiating a new bullish wave.
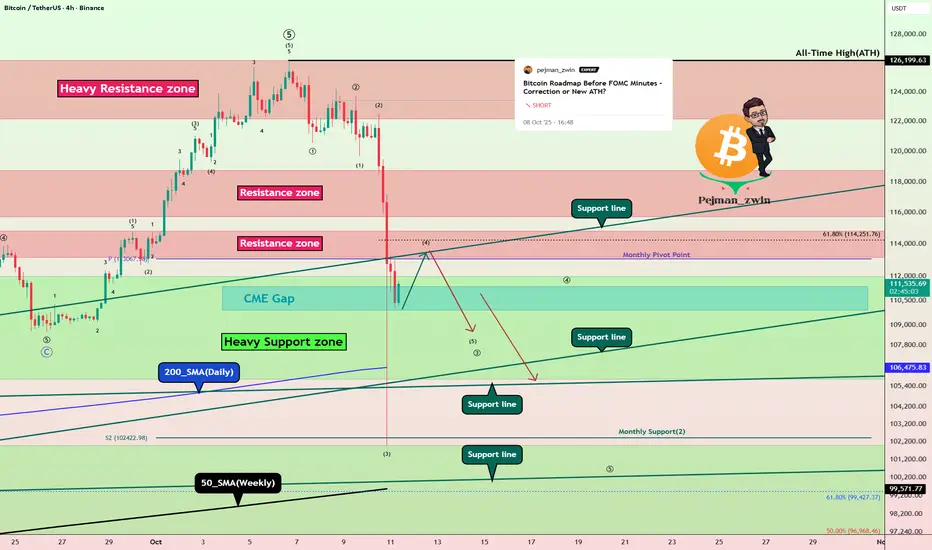
Bitcoin Roadmap: Is a Major Correction the Next Stop?As I expected from the previous analysis , Bitcoin did start to drop and hit its targets .
Now, with the news that the U.S. might impose a 100% tariff on China , we saw Bitcoin sharply sell off last night. Actually, as I mentioned in my previous ideas , the rally from about $109,000 to around $126,199(ATH ) (which was a new all-time high for Bitcoin) had relatively low volume. That was a sign that a correction might be on the way, and last night’s news just acted as a trigger to speed it up.
In fact, what took Bitcoin 10 days to climb was reversed in about 4 days , showing how strong the sellers are right now.
Educational tip: You can use volume candles on TradingView to see which candles had higher volume—the thicker the candle, the more significant the move.
Now, the big question: will Bitcoin keep dropping or bounce back?
Right now, it’s sitting near a cluster of Support lines and close to the daily 200_SMA(Daily) and the 50_SMA(Weekly) , as well as a Heavy Support zone($111,980-$105,820) . Last night’s drop was basically the first test of these supports .
Since it’s the weekend and volumes are usually lower, we don’t expect a huge downward move in the next 48 hours.
Bitcoin might do a pullback to the broken Resistance zone($114,820-$113,180) and then continue its drop.
According to Elliott Wave analysis , Bitcoin seems to be completing a microwave 4 of the main wave 3 .
I expect that after Bitcoin completes , we might see it continue downward and fill the CME Gap($111,355-$109,915) early in the next week.
So, do you think the major correction for Bitcoin has started or not? Let me know what you think!
Note: In case the Support lines break, there’s also a chance that we might see a Death Cross (where the 50-day moving average crosses below the 200-day moving average), which could signal further bearish momentum.
Note: Around the $108,000 level, we have huge buy orders stacked up, which might act as a significant support zone.
Please respect each other's ideas and express them politely if you agree or disagree.
Bitcoin Analysis (BTCUSDT), 4-hour time frame.
Be sure to follow the updated ideas.
Do not forget to put a Stop loss for your positions (For every position you want to open).
Please follow your strategy and updates; this is just my Idea, and I will gladly see your ideas in this post.
Please do not forget the ✅' like '✅ button 🙏😊 & Share it with your friends; thanks, and Trade safe.