Altcoin Fear Rising — But Liquidity Shift Is ComingI know the current pullback on altcoins has greatly increased the fear of a deeper drop, especially since Bitcoin just hit a new all-time high at $126,200 yesterday.
Yet, the Bitcoin Dominance Index (BTCDOM/USDT) shows that the price is getting ready for a major decline.
This suggests that liquidity could soon start flowing into altcoins, potentially starting this week.
BTCUSDT

#BTC/USDT Let Bitcoin make a new ATH#BTC
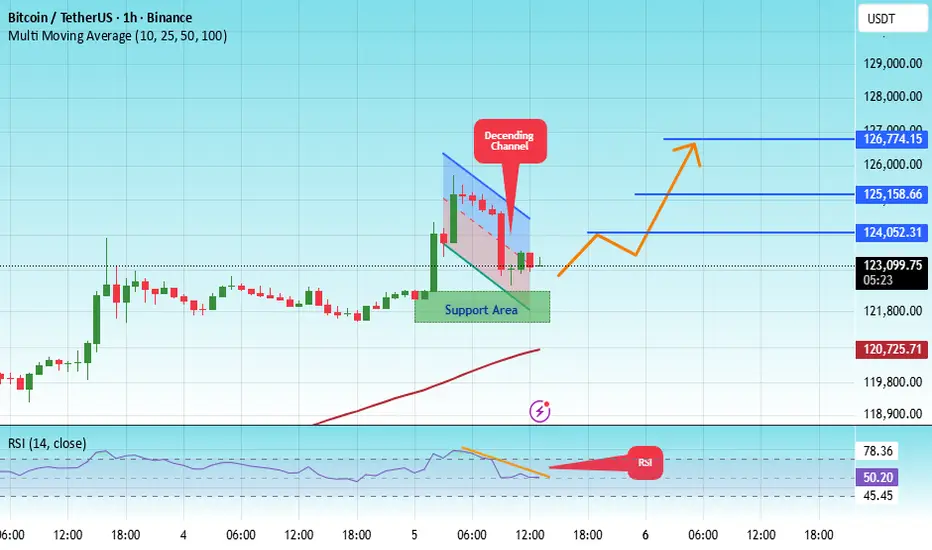
The price is moving within a descending channel on the 1-hour frame, adhering well to it, and is heading for a strong breakout and retest.
We have a bearish trend on the RSI indicator that is about to be broken and retested, which supports the upward move.
There is a major support area in green at 121900, which represents a strong support point.
We are heading for consolidation above the 100 moving average.
Entry price: 123300.
First target: 124050.
Second target: 125160.
Third target: 126774.
Don't forget a simple matter: capital management.
When you reach the first target, save some money and then change your stop-loss order to an entry order.
For inquiries, please leave a comment.
Thank you.
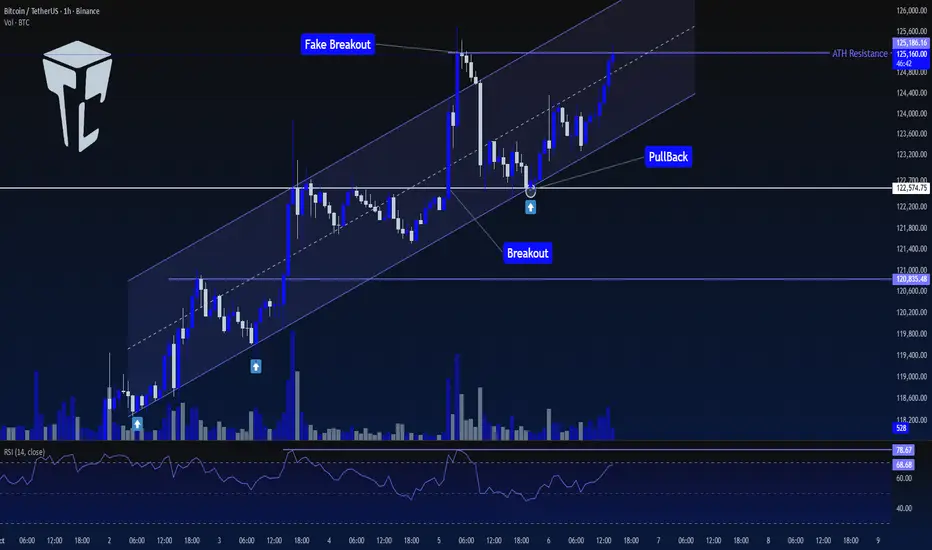
TradeCityPro | Bitcoin Daily Analysis #189👋 Welcome to TradeCity Pro!
Let’s move on to the Bitcoin analysis. Yesterday, after setting a new ATH, Bitcoin began its correction — let’s review the market together.
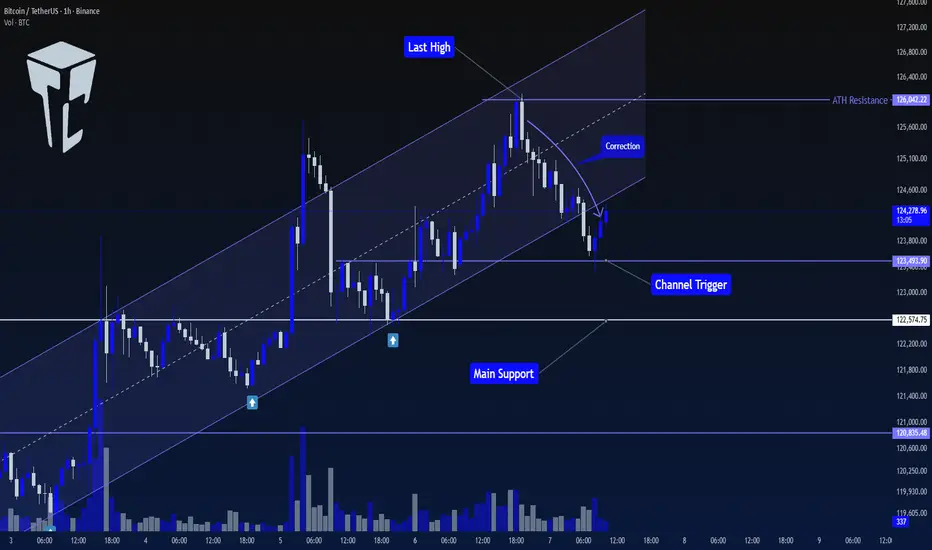
⏳ 1-Hour Timeframe
On the 1-hour timeframe, Bitcoin had been moving inside an ascending channel that had provided multiple supports. However, after being rejected from 126042, the price experienced a downward move and broke the channel to the downside.
⭐ The channel breakout trigger is at 123493, where the price has already reacted once, and it’s now moving slightly upward with very low volume.
📊 If this low-volume bullish movement continues, the likelihood of trigger activation will increase, and in that case, the price could move toward 122574.
🔍 For now, none of these triggers are suitable for short positions, as the market still looks too bullish to consider shorting.
✨ For long positions, the current trigger is 126042. However, if the market consolidates longer and forms a new structure, we might find an opportunity to enter earlier.
❌ Disclaimer ❌
Trading futures is highly risky and dangerous. If you're not an expert, these triggers may not be suitable for you. You should first learn risk and capital management. You can also use the educational content from this channel.
Finally, these triggers reflect my personal opinions on price action, and the market may move completely against this analysis. So, do your own research before opening any position.
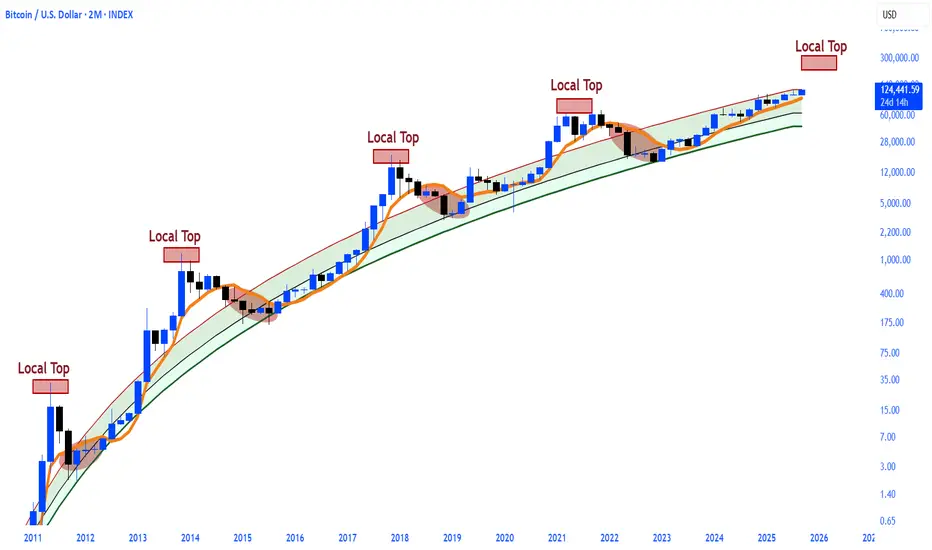
Bitcoin top not is in and has ample room for growth.CRYPTOCAP:BTC loaded god candles after breaking the logarithmic curve center resistance line on a cyclical basis.
And now we're almost there.
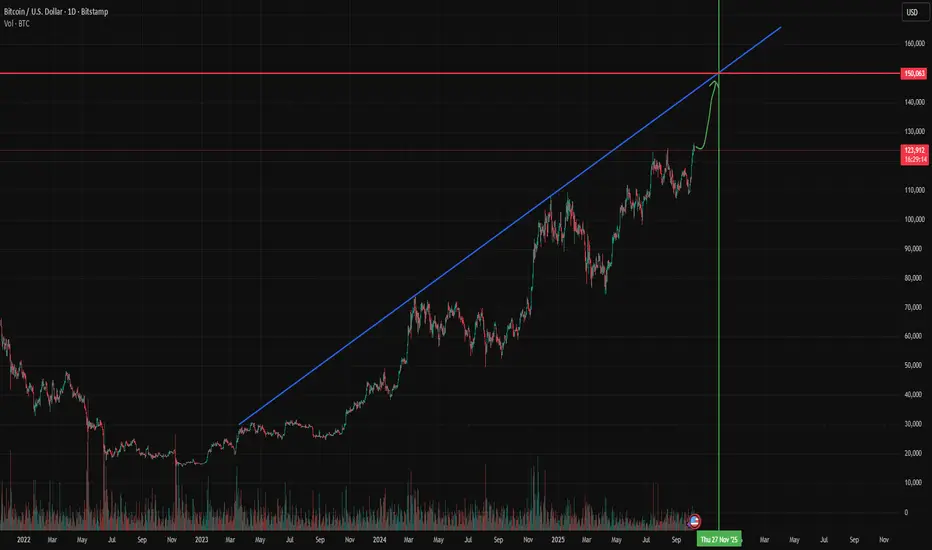
#BTCUSDT: Two Areas To Buy Swing, Same Target $150KDear traders,
We are resuming publication here on TradingView. If you agree with our insights, consider liking and commenting on the idea.
Let’s focus on Bitcoin. Its price has rallied since the last two weeks, showing extreme bullish volume in the market. This is mainly due to fear of negative fundamentals in the US economy, which is showing a lack of trust in the US Dollar. As traders and investors seek alternatives to the US Dollar, the main two prospects that look promising are Gold and Bitcoin.
So, what’s next? We think there are two possible buying areas where the price could reverse. The first is at a minor correction, and the second is a major correction. However, we believe the minor correction looks more promising at the current market conditions, while the major corrections would require fundamental intervention. Both present good opportunities.
This is our view only, and it doesn’t guarantee that the price will follow our predictions. Do your own analysis and research before making any decisions. We thank each of you for your support throughout and expect it to continue.
Much Love and Regards,
Team Setupsfx_

BITCOIN’S $125K BREAKOUT · Is This the Real Cycle Top?Fundamental analysis:
Bitcoin just broke a new all-time high at $125,689, and unlike 2021, this move isn’t built on retail hype—it’s being driven by institutional force.
Massive ETF inflows flipped the trend completely, with nearly $7 billion entering U.S. spot funds in a single week. At the same time, exchange reserves have dropped to a seven-year low, and public companies now hold over 4 percent of total supply.
On-chain data shows that whales and corporates are accumulating, not trading, while stablecoin liquidity has surged by more than $6 billion, bringing fresh capital into crypto.
Technical analysis:
Bitcoin’s daily chart shows a textbook continuation of the long-term uptrend. After a mid-year consolidation, BTC broke decisively above the $120K–$123K resistance zone and is now establishing that range as support.
The 50-day moving average remains well above the 200-day, maintaining a golden cross formation that signals sustained bullish momentum. Price action has stayed comfortably above both trend lines, confirming strong market structure.
The next key resistance lies between $130K and $135K, followed by the major psychological target near $150K. On the downside, support sits around $114K, marking the line that would need to break to shift this trend.
Momentum indicators continue to favor the bulls. The MACD is climbing after hitting its lowest point since March, hinting at renewed upward energy, while the RSI is stabilizing above 50—indicating balanced but positive momentum.
The Fear & Greed Index currently reads 62 (Greed), up from 43 just a week ago, showing that investors are no longer skeptical. This time, market psychology is aligned with the charts: optimism is growing, not fading.
Historically, Bitcoin tends to peak roughly 18 months after each halving. With the most recent halving in April 2024, that timing points squarely to late November 2025 for a potential cycle top, coinciding with the current trend line projection near $150K.
Here is my recommendation:
EP 1: $123,443
EP 2: $124,475
EP 3: $120,000
Target 1: $130,000
Target 2: $135,000
Target 3: $150,000
Best,
The Crypto Fire
BTC/USDT Bullish Channel – Eyes on $130K Targets🔍 Key Observations:
Trend Direction: Bullish
Price is moving consistently within an upward sloping channel, suggesting a strong and steady uptrend.
Current Price: ~$124,353
Price is near the lower boundary of the channel, indicating a possible bounce opportunity to ride the trend higher.
Targets:
Target 1: $128,001
Target 2: $130,100
These are potential resistance zones or profit-taking levels if the bullish move continues.
Structure:
The marked zig-zag path suggests anticipated higher highs and higher lows, in line with a typical channel-based bullish continuation.

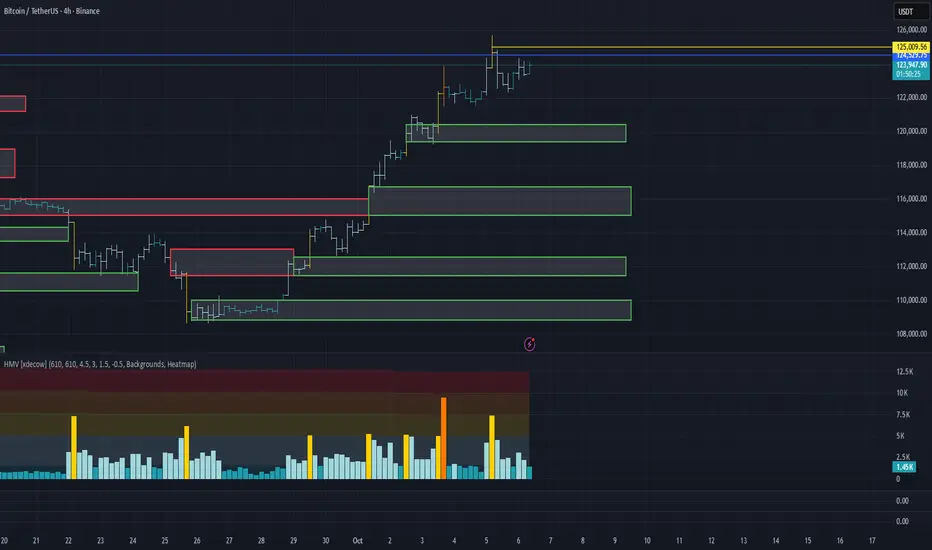
BTC HOLDS LEVELS FOR MORE..BTC/USDT — Main Trend Holds Strong at $112K, Confirmation Near
Bitcoin is currently trading just below the low time frame zone around $124.5K, showing slight resistance before a potential confirmation breakout. Despite this minor pullback, the main trend remains firmly intact around $112K, which continues to act as the key structural support.
⚙️ Main trend updated to $112K: This level defines Bitcoin’s long-term bullish structure — as long as BTC stays above it, momentum remains positive.
📉 Below low time frame: BTC is temporarily consolidating under local resistance, but proximity to this level suggests a potential re-test and confirmation soon.
🚀 Upside target: Once the low time frame confirms, Bitcoin could aim for the next resistance zone near $132K.
Technical Outlook:
🟢 Main Trend (Support): $112K
🟡 Low Time Frame Resistance: $124.5K
🎯 Next Target: $132K (upon confirmation)
Summary:
BTC remains structurally bullish above the $112K main trend. While still slightly below the short-term confirmation zone, it’s positioned well for a potential continuation — provided support holds and price regains momentum above $124.5K.
📊 Bias: Cautiously Bullish
📈 Key Levels: Support $112K | Resistance $124.5K | Target $132K

Btcusdt - At Crtitical Decision Point, Breakout Or Breakdown Bitcoin is currently sitting at a critical decision point near the 124,120 level after a Break of Structure (BOS) to the downside, following a Change of Character (ChoCH) at the top.
Key Technical Zones:
Support Zone: Price is testing a marked support area, which has previously acted as a demand zone. This zone could trigger a bullish reaction.
Strong Low: If this level breaks, bearish momentum could accelerate.
Weak High: May be targeted if price finds support and reverses.
Decision Point: The current price level acts as a pivot, determining whether the market will:
Bounce and aim for the upper target near 126,013, or
Break down towards the lower target below 121,000.
Scenarios:
Bullish Scenario:
If price holds the support zone and breaks recent BOS highs, the market may rally toward the 126K target.
Bearish Scenario:
A breakdown below the support and the strong low could trigger a move toward the 121K area.
Conclusion:
Monitor the support zone closely. A strong bullish reaction could confirm a long setup toward 126K, while a clean break below the strong low confirms further downside.

btc rising trendThe trend is your friend with Bitcoin.
CRYPTOCAP:BTC continues to accumulate in the main uptrend before the next upward movement.

BTC to new ATH. Next reversal pullback at $132K-$135K$BTC. Congrats new ATH after ATH. Price heading to 132-135K zone.
I put resistance/reversal zone on the chart. Based on two different Fibonacci projections on different weekly swings.
Lets see how accurately it works. On backtesting it has been amazingly accurate. Especially when price going to discovery mode.

Want to Trade Like a Pro? This BTC Layer Strategy is Your Answer🚀 Become a Pro Trader: The "Thief" Layer Strategy for BTC/USDT (Bullish Swing Plan) 🚀
Unlock a professional money-making operation! This detailed plan combines a unique entry technique with deep fundamental & sentimental analysis to give you an edge.
📈 Trade Idea: BTC/USDT (Swing / Day Trade)
Bias: Bullish | Timeframe: 4H - 1D
🎯 The "Thief" Layer Entry Strategy
This strategy "steals" good entries at various levels instead of chasing the market.
Entry Method: Multiple Buy Limit Orders (Layering)
Proposed Entry Zones: $111,000 | $111,500 | $112,000 | $112,500
You can add more layers based on your capital and risk appetite.
⛔ Stop Loss (Risk Management)
Hard Stop Loss: $110,000 (Below key support)
⚠️ IMPORTANT NOTE (Thief OG's): This is MY stop loss. You MUST adjust your SL based on your personal risk management strategy. Protect your capital first.
🎯 Take Profit (Exit Strategy)
Primary Target: $116,000 (Strong Resistance + Overbought Zone)
The Plan: Escape with "stolen" profits before any potential trap snaps shut!
⚠️ IMPORTANT NOTE (Thief OG's): This is MY target. You are free to take profit earlier or adjust based on your own analysis. Secure your bags!
🔍 Why This Plan? The "Thief's" Analysis
This trade setup is backed by a confluence of technical, fundamental, and sentimental factors.
📊 Technical & Sentimental Backdrop (As of Sept 9, 2025)
Price Action: BTC showed strength with a +1.52% gain, bouncing from the $111,184 support.
Market Sentiment (Fear & Greed Index): 48/100 (Neutral) 😐. This indicates a balanced market with no extreme fear or greed—often a good base for a move.
Retail vs. Institutional:
Retail Traders: 55% Long (Slightly Bullish) 🤔. Fueled by Fed rate cut expectations.
Institutional Traders: 60% Short (Cautiously Bearish) 🏢. Their selling pressure appears to be exhausting, as shown by declining volume on dips. This creates a contrarian opportunity.
🌍 Fundamental & Macro Tailwinds
The $7.26T Cash Pile: Money market funds are holding a massive $7.26 Trillion. A Fed rate cut could unleash this capital into risk assets like Bitcoin. 🏦
Fed Rate Decision: An expected 25-50 bps cut is highly bullish for crypto, potentially triggering a major rotation.
Strong Bitcoin Fundamentals:
Low Inflation Rate: Only 1.17% (low new supply pressure). ✅
Network Health: Active addresses and settlement volume remain stable (~$12.9B/24h).
Dominance: BTC is outperforming traditional safe havens like gold (+102% YoY vs. gold's +42%).
✅ Overall Outlook Score
Bull (Long) Score: 55/100 → Neutral-Bullish 🐂
Bear (Short) Score: 45/100 → Weak Bearish Pressure 📉
🎯 Final Thief's Outlook: Cautiously optimistic. The layered entry strategy allows us to capitalize on potential upside driven by macro factors while strategically managing risk.
👀 Related Pairs to Watch
BINANCE:ETHUSDT | BINANCE:SOLUSDT | BINANCE:BNBUSDT (Altcoins follow BTC's lead)
TVC:DXY (U.S. Dollar Index) | CBOE:SPX (S&P 500)
✨ “If you find value in my analysis, a 👍 and 🚀 boost is much appreciated — it helps me share more setups with the community!”
#BTC #Bitcoin #Trading #Strategy #LayerStrategy #SwingTrading #Cryptocurrency #TechnicalAnalysis #FundamentalAnalysis #ThiefStrategy

BTC/USD – Flag Formation Near Trendline Support Breakout SeemsBitcoin is respecting its bullish market structure, continuing to form higher highs and higher lows. After the impulsive rally toward 125,600, price has entered a short consolidation phase and is currently testing a rising trendline acting as dynamic support.
This structure resembles a bullish flag / ascending triangle, suggesting that buyers may soon regain control if price holds above the trendline.
🔹 Market Outlook
• Structure: Bullish continuation
• Pattern: Bullish flag / triangle formation
• Bias: Buy on confirmation above resistance or from trendline support
💎 Trade Plan
Option 1 – Immediate Buy (Aggressive)
🟢 Buy Now: 122,900 – 123,000
🎯 Target 1: 123,800
🎯 Target 2: 125,500 (resistance high)
🛑 Stop-Loss: below 122,400
Option 2 – Pending Buy (Conservative)
🟢 Buy Stop: 123,600 (breakout above flag)
🎯 Target 1: 124,600
🎯 Target 2: 125,500 – 126,000
🛑 Stop-Loss: below 122,800
⚠️ Alternative Scenario
If the trendline breaks and price closes below 122,400, expect a short-term shift toward 121,800–121,200, where fresh demand could appear for the next leg higher.
📈 Summary
• Trendline support still intact ✅
• Bullish flag structure forming ✅
• Confirmation needed above 123,600 for momentum continuation 🚀
• Maintain bullish bias while price holds above 122,400

BTCUSD NEXT POSSIBLE MOVEBitcoin is currently testing a key support area after a healthy correction. If price holds above this zone, a bullish rebound can be expected.
Market structure remains positive as long as supports hold — buyers may regain control and push price toward higher levels.
Wait for a bullish confirmation candle before entering to ensure momentum shift in buyers’ favor.

BTCNEW UPDATE (1D)In the previous analysis, we considered Bitcoin’s scenario as a triangle, which has now failed.
It now appears that this is not a triangle but a diametric pattern. Currently, it seems we are in the middle of wave F. The potential corrections we expect are buying opportunities, and we will look to buy within the green box if a correction occurs.
The target for wave E could be between 138K and 140K.
A daily candle closing below the invalidation level will nullify this analysis.
invalidation level : $106418
For risk management, please don't forget stop loss and capital management
Comment if you have any questions
Thank You

TradeCityPro | Bitcoin Daily Analysis #188👋 Welcome to TradeCity Pro!
Let’s move on to the Bitcoin analysis. Today, after pulling back to its previous resistance, Bitcoin is ready to start its next move.
⏳ 1-Hour Timeframe
On the 1-hour timeframe, Bitcoin continues its upward trend. Yesterday, after a pullback to the 122574 area and support from the channel’s bottom, it is once again ready to begin its next leg upward.
✨ The top formed at 125186 is Bitcoin’s new ATH resistance, and breaking this level would lead to further bullish continuation.
✅ Today, if this level breaks, we can have a long position on Bitcoin. If you already have an open position, there’s no need to re-enter at this point — it’s better to look for opportunities in other coins.
🎲 Since Bitcoin’s dominance trend is generally declining, if the next bullish leg begins, altcoins could also become attractive options. Therefore, it’s best to hold one position on Bitcoin and another on selected altcoins.
❌ Disclaimer ❌
Trading futures is highly risky and dangerous. If you're not an expert, these triggers may not be suitable for you. You should first learn risk and capital management. You can also use the educational content from this channel.
Finally, these triggers reflect my personal opinions on price action, and the market may move completely against this analysis. So, do your own research before opening any position.
BITCOIN IS IN A TRIANGLE UNTIL THE END OF 2025: EVERYTHING WILL 📣 Hello everyone!
I bring to your attention my medium-term view until the end of 2025 within the framework of this Bitcoin trading idea solely from the point of view of TA and my understanding of the chart.
🔹 Briefly and to the point:
1️⃣ I believe that Bitcoin's growth in October will be limited and right now the price is already close to local highs.
2️⃣ I expect an unexpected, disappointing drop in the BTC price after the recent ATN upgrade to $125,000 at the beginning of the month.
3. Anyone who flew into a long breakout will be thrown out of the market, many will believe in the beginning of a bear market and prematurely open short positions.
4️⃣ In November-December, I expect another small wave of growth, which will push the price of BTC a little over $130,000
5️⃣ I expect big events for Bitcoin in Q1 2026, but more on that later.
That's all for today, I wish you good luck in making independent trading decisions and making a profit. Please analyze the information you receive from me, always think only with your head!
Goodbye! ✊

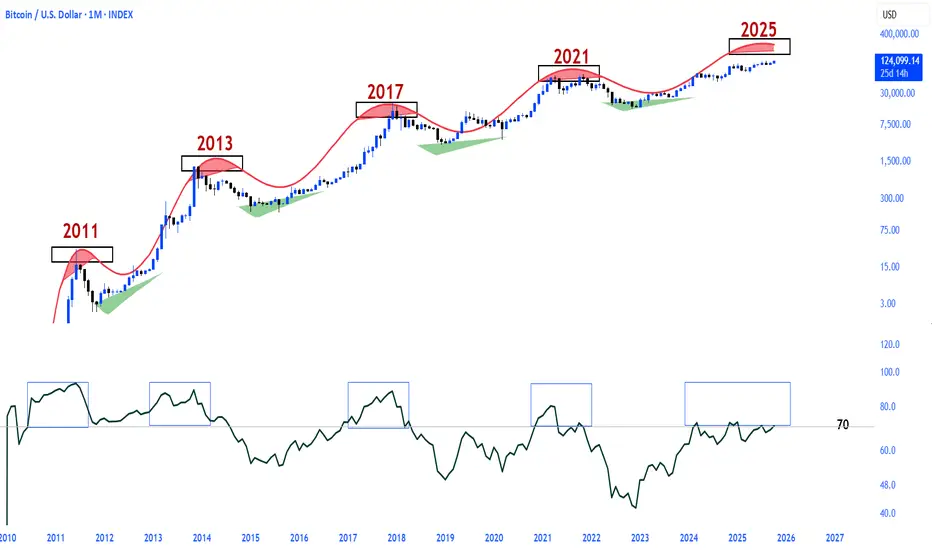
Bitcoin top not is in...The monthly RSI is back above 70 and hasn't even settled above the overbought level of 72.
The CRYPTOCAP:BTC rally will continue in the truest sense of the word.
Analytics: Market Outlook and Forecasts
📈 WHAT HAPPENED?
Last week, Bitcoin surprised us with its dynamics: despite the US shutdown, the cryptocurrency showed explosive growth. On the one hand, the shutdown is negative for the global market, people have less trust in the government. On the other hand, Bitcoin acts as an independent ecosystem perceived by people as a hedge asset in relation to fiat.
As a result of the massive inflow of liquidity, almost all of the sell zones were broken, with only a few offering resistance. Moreover, the all-time high (ATH) was reached and updated, now standing at $125,700.
💼 WHAT WILL HAPPEN: OR NOT?
The bullish momentum has now slowed down, with a strong absorption of buys. The pricing remains inefficient, increasing the likelihood of a correction.
The key area of attention is $125,000 (cluster anomalies). If there is a reaction from this level, we expect a move towards $120,000, where the nearest buyer activity zone is located.
If there is no reaction and a confident breakout of the current local high, we shift our focus to finding entry points for long trades during corrections.
Buy Zones:
• $120,400–$119,400 (absorption of selling pressure)
• $116,700–$115,000 (pushing volumes, strong chart imbalance)
• $112,500–$111,500 (mirror zone, volume anomalies)
• $110,000–$108,800 (strong absorption of selling pressure)
📰 IMPORTANT DATES
Macroeconomic events this week:
• October 8, Wednesday, 1:00 (UTC) — announcement of the interest rate decision in New Zealand;
• October 8, Wednesday, 19:00 (UTC) — publication of the US FOMC minutes;
• October 9, Thursday, 12:30 (UTC) — speech by US Federal Reserve Chairman Jerome Powell, as well as publication of the number of initial jobless claims in the US;
• October 10, Friday, 12:30 (UTC) — publication of the average hourly wage, unemployment rate, and change in the number of non-agricultural workers in the United States for September.
*This post is not a financial recommendation. Make decisions based on your own experience.
#analytics
BTC WeeklyBitcoin has always moved in repetitive cycles: a strong bull run, followed by a correction phase, and then starting a new rally from the lows. If we look at its price history, we can clearly see that these cycles repeat every few years with very similar patterns.
Right now, Bitcoin is in a position that looks very similar to the past cycles. When we align these patterns, it suggests that another correction could be ahead.
🔹 In my opinion, based on these cycles, Bitcoin could see a deeper pullback over the next year and even drop to around $47,000.
Of course, this is just a personal view based on past market behavior and not a guarantee — but history shows Bitcoin has repeated this path many times.

BTC 1H Analysis - Key Triggers Ahead | Day 52☃️ Welcome to the cryptos winter , I hope you’ve started your day well.
⏰ We’re analyzing BTC on the 1-Hour timeframe .
👀 On the 1-hour timeframe, Bitcoin has broken through all major resistance levels, setting a new ATH, and then experienced a 2% price drop due to profit-taking and FOMO-driven selling. It then moved toward its key support zone around $122,584, bounced from there, and is now moving toward its early trigger zone at $124,113.
🧮 The RSI oscillator shows two important levels — 63 and 45 — and once the volatility threshold crosses especially above 63, Bitcoin could see a sharp increase in volatility, activating its triggers and enabling breakout moves.
🕯 Bitcoin’s volume has decreased after each touch of resistance, but now with a noticeable volume increase, our early trigger could become active, allowing Bitcoin to form larger, high-volume candles either upward or downward. Since the high-wave cycle remains bullish, the current scenario still favors upside continuation and resistance breakouts.
🧠 For Bitcoin positions, it’s better to wait for all confirmations to align — including activation of the early trigger, an RSI breakout above 63, and rising buy volume — before opening a long position.
❤️ Disclaimer : This analysis is purely based on my personal opinion and I only trade if the stated triggers are activated .

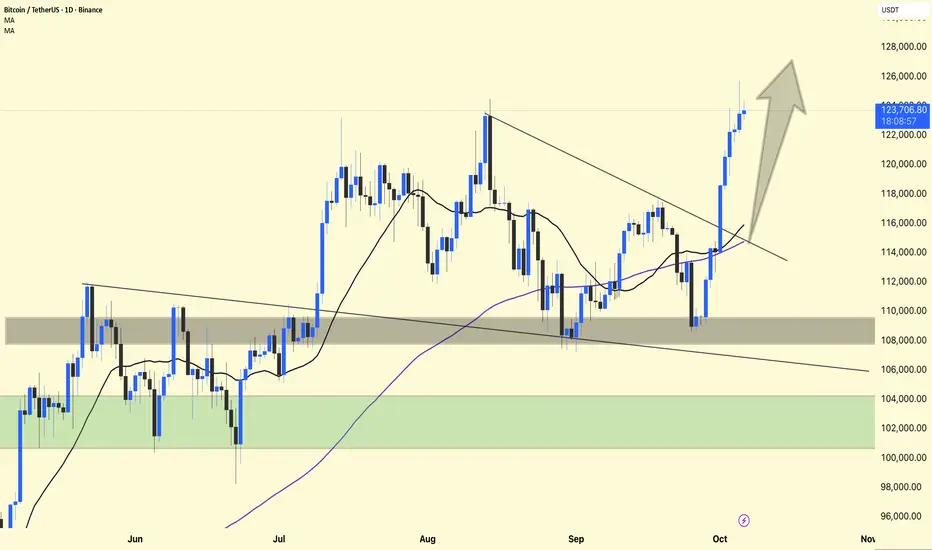
Bitcoin Technical Update – Strong Breakout!Bitcoin has successfully broken out of the descending trendline that had been holding the price down for several weeks. This breakout confirms a shift in market structure from bearish to bullish.
After finding strong support around the $110,000-$112,000 area, BTC bounced sharply and reclaimed both the 21-day and 100-day moving averages – a powerful bullish signal. As long as the price remains above $115,000 to $116,000, we can expect continued upward momentum.
The current move shows healthy strength with volume support, indicating strong buyer interest. If momentum persists, the next potential target is around the $125,000-$128,000 area, where some profit-taking could occur.
Support: $115,000 – $116,000 (previous resistance turned support)
Resistance: $125,000 – $128,000 (short-term target area)
Currently, the upside remains in bullish favor. If the market structure remains stable, any decline towards $116,000-$118,000 could provide a potential buying opportunity.
Remember: Avoid blindly chasing breakouts. Allow the price to retest or consolidate before entering — patience pays off in trend trades.
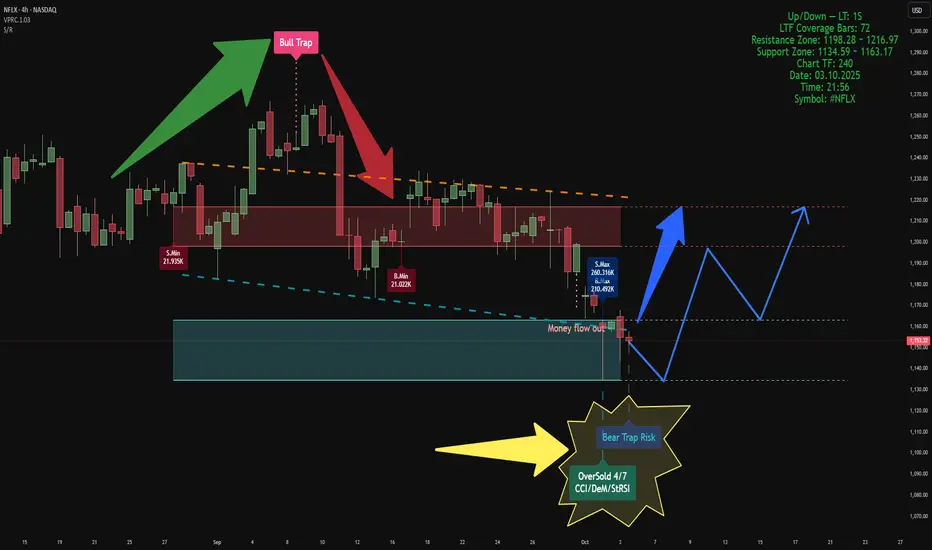
Volume-Based Market AnalysisUsing Indicators:
Smart Money Support/Resistance and ATAI Volume Analysis with Price Action V1.03
Analytical Configuration
This analysis combines two advanced indicators. The calculation period for both has been set to 52 bars, based on a lower timeframe of 1 second (1S), which provides 72 valid LTF candles. This configuration ensures that volume-based calculations remain within the valid data window for maximum accuracy.
Current Market Context
On the latest candle, a Bear Trap Risk signal appeared right after detecting an OverSold condition. This combination usually suggests weakening selling pressure near the end of a bearish leg and indicates the potential for buyer reaction. At that candle, both buy and sell volumes reached their highest values within the 52-bar window, but sellers maintained a slight advantage — approximately 260K sell volume versus 210K buy volume. This dominance by sellers in the OverSold zone reinforces the concept of volume exhaustion
Key Zones
• Support Zone: 1134 – 1163 USD
• Resistance Zone: 1198 – 1217 USD
Price is currently oscillating between these two zones. Based on the data, a short-term move toward the lower edge of the support zone is possible. If strong support holds, a rebound toward the upper boundary of resistance can be expected to retest or potentially break above it.
Structural Observation
In previous data, ATAI identified a Bull Trap at the resistance zone, which initiated the current bearish leg. Now, the emergence of a Bear Trap Risk near the support boundary is an intriguing reversal signal. If this trap functions similarly to the previous Bull Trap but in the opposite direction, we could expect a movement from the support base toward the resistance ceiling in the upcoming phase.
Summary
According to both indicators’ volume-based calculations, this is the most probable short-term scenario. However, this analysis is purely technical and volume-driven, and does not constitute any form of financial or investment advice.