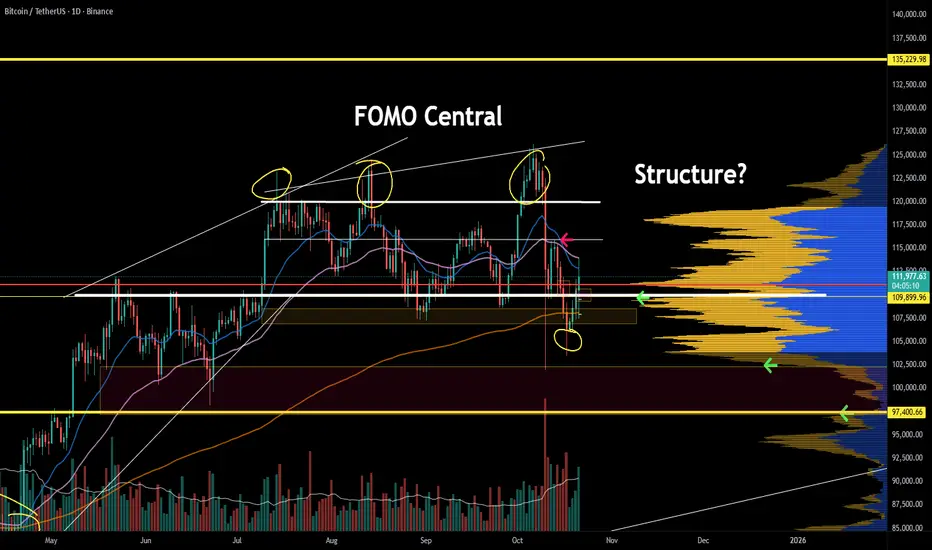
BTC: Shows an obvious volatile trendToday, BTC’s situation is relatively complex, with intertwined bullish and bearish factors, showing a volatile trend.
Price Movement: There has been sharp volatility, with rapid rises and falls. From the hourly chart, the price surged to around 114,000 last night, followed by a significant pullback from the highs, retesting the key support level around 107,500.
Influencing Factors:
News: The Federal Reserve held a meeting with payment companies to facilitate better institutional access to the stablecoin sector. This news triggered a short-term surge in Bitcoin prices. However, subsequent remarks by Trump proposing a 155% tariff led to a price decline. The uncertainty in news has had a significant impact on the market.
Market Sentiment: The fear index stands at 25, indicating a tendency toward panic in market sentiment. Additionally, the large traders’ long-short ratio shows a slight dominance of bears at 52.34%, reflecting relatively stronger short-term bearish momentum in the market.
Capital Flow: U.S. Bitcoin ETFs have seen net inflows exceeding $3.6 billion this month, the highest since January. Institutions like BlackRock continue to increase their holdings, forming bottom buying support for prices. However, the total open interest across the network has reached $48 billion, highlighting high leverage risks. A sharp price fluctuation could trigger massive contract liquidations, exacerbating market volatility.
Technical Analysis: On the hourly timeframe, the MACD has re-formed a death cross pointing downward. Although the blue bars have shortened and started to turn red, indicating a partial shift in short-term momentum, bears still hold the overall advantage. The upper resistance level is around $111,000, and the lower support level is around $107,500. A break below this key support could lead to further downside.
Trading Strategy:
Focus on range-bound trading. Avoid taking positions at mid-range levels, exercise caution in chasing trends, and patiently wait for key levels to enter trades.
Buy 107,500 - 108,500
SL 106,500
TP 109,500 - 110,500 - 111,500
Sell 111,000 - 110,500
SL 112,000
TP 109,500 - 108,500 - 107,500
Daily-updated accurate signals are at your disposal. If you run into any problems while trading, these signals serve as a reliable reference—don’t hesitate to use them! I truly hope they bring you significant assistance
BTCUSDT

Today's Bitcoin long-term trading strategySummary of the Core Situation in the Current Bitcoin Market
Institutional Funds Are "Bottom-Fishing"
Many large global investment institutions are buying Bitcoin. For example, some funds in the United States have increased their Bitcoin holdings by more than 2 billion US dollars in the past month. The purchase of such large sums of money provides support for Bitcoin's price, making it less likely for Bitcoin to plummet significantly.
Regulatory News Is "Mixed"
Some countries (such as the European Union) have recently clarified the rules for Bitcoin trading, which has made the trading more standardized and relieved the market to a certain extent. However, other countries (such as some regions in Asia) are investigating illegal Bitcoin platforms, which occasionally triggers short-term panic selling.
Retail Investors' Sentiments Are Divided
Some retail investors think that Bitcoin's price has risen quite a lot and are worried about a decline, so they have started to sell gradually. On the other hand, some believe that institutions are still buying and the price will rise further in the future, so they are waiting for a lower price to enter the market. This has led to a temporary balance between the buying and selling forces in the market.
Today's Bitcoin Trading Strategy
BTC @ buy:107000-108000
pt:109000-110000
sl:105000

BTCUSDTHello Traders! 👋
What are your thoughts on BITCOIN?
Bitcoin has entered a healthy corrective phase after hitting the upper boundary of its ascending channel. Price is now approaching a key demand zone, which could offer strong support for the next leg higher within the broader bullish trend.
As long as Bitcoin holds this zone, the bullish structure remains intact, and a rebound could target the channel top near $140,000
If Bitcoin breaks below the support zone and closes under the trendline, this would invalidate the current bullish setup, potentially leading to a deeper correction toward lower levels.
Don’t forget to like and share your thoughts in the comments! ❤️

BTCUSDT — at Edge of the Trend: Bullish or the Next Bear Trap?Main Narrative
Bitcoin is standing at a critical crossroads. After a deep correction from the 126K peak, the price is now forming a Symmetrical Triangle Pattern — a classic setup that appears when the market holds its breath before a major move.
Pressure from both sides — a descending resistance from sellers above and an ascending support from buyers below — is squeezing the price closer to the apex, the point where a decisive breakout becomes inevitable.
The next movement will decide whether the bulls regain control or the bears reclaim dominance.
---
Pattern & Structure Analysis
This triangle has formed after a strong downtrend, signaling a phase of consolidation and uncertainty.
There was one false breakout to the upside (yellow ×) — a typical liquidity trap where market makers lure buyers before pulling the price back inside the pattern.
Currently, Bitcoin remains trapped between:
Descending resistance (upper yellow line): around 110K–112K
Ascending support (lower yellow line): around 106.7K
This is a pressure zone — the longer the price stays inside, the more explosive the breakout will be once it happens.
---
Key Levels
Main Resistance: 110K – 112K (breakout zone)
Primary Support: 106.7K (bulls’ last stand)
Secondary Support: 103.6K and 102.1K (critical continuation zone)
Bullish Targets: 116K–118K (retest of previous resistance), and up to 126K if momentum expands
Bearish Targets: 103K → 102K → potential breakdown continuation below 100K if selling pressure dominates
---
Bullish Scenario — “Real Breakout or Just Another Trap?”
If the 4H candle closes above 112K with strong volume confirmation:
Buyers regain short-term control.
First target lies around 116K–118K (prior supply zone).
Sustained momentum could lift the price back toward 126K — the previous major high.
However, without volume confirmation, any breakout could turn into a second fake rally, often followed by a sharper decline.
---
Bearish Scenario — “Support Break = Bearish Continuation”
If the price breaks below 106.7K, confirmed by a strong 4H close and rising sell volume:
The breakdown could drive the price toward 103.6K, then 102.1K.
A confirmed close below 102K may trigger panic selling and open a path toward the next psychological zone below 100K.
In this case, the triangle would represent a continuation pattern, not a reversal — signaling further downside.
---
Market Psychology
This chart perfectly reflects a battle of patience between buyers and sellers.
The longer the consolidation lasts, the more energy builds up behind the next move.
Experienced traders know: long consolidations often end with violent breakouts.
---
Strategy & Key Notes
Wait for a confirmed 4H candle close beyond the triangle with strong volume.
Breakouts without volume = traps.
Keep position size small until direction is confirmed.
Enter only after a successful breakout retest to reduce risk exposure.
---
Conclusion
Bitcoin is entering a decisive phase.
A confirmed breakout above 112K could ignite a bullish run toward 116K–126K,
while a breakdown below 106K would confirm that the market is leaning back into a bearish phase.
This isn’t just another triangle — it’s a critical point that will define the medium-term trend for Bitcoin.
---
#Bitcoin #BTCUSDT #CryptoAnalysis #Breakout #TechnicalAnalysis #TrianglePattern #BTC #CryptoTrading #CryptoMarket

BTC update — still red, eyes on 109.3K📊 Market Update
BTC lost the +volume in the last 24H. With this time frame, BTC will only be back in the volume zone if it returns to 109.3K.
Until that, BTC stays in breakdown mode.
The new BTC cycle can start from 116K.
For now, we follow daily BTC to see if it turns green — starting from the low time frame, which is still red.
🔹 Market Structure
In the last 12H the market showed a breakdown trend.
In the last 4H, the market is building an accumulation trend — still processing.
Soon, new update with last follow.

Today's trading strategy for Bitcoin is hoped to be helpful to yPotential Positive Factors in the Market (Why the Long Logic Holds)
"Marginal Easing Expectations" in Regulatory Policies, Not Just Suppression
Against the backdrop of tightening global regulation, there are still implicit positive factors from "marginal easing" that provide underlying support for going long:
- Incremental Space from Accelerated Compliance: The G20 requires the implementation of full-process filing for Bitcoin transactions by 2026. While this may seem restrictive, it actually drives the industry from "disorder" to "compliance". After the filing process is completed, institutional funds will no longer need to hold back due to "compliance risks"—instead, they may enter the market in bulk (e.g., compliant funds like Grayscale are already laying the groundwork for post-filing products). The current low level around 108,200 may become a window for institutions to build positions in advance.
- Opportunities from Regional Policy Differentiation: Not all regions are tightening regulations. Southeast Asian countries (such as Singapore and Thailand) have recently relaxed restrictions on Bitcoin ETF issuances. In October, Bitcoin ETFs in the region recorded a net inflow of $320 million, making it one of the few global markets with positive capital inflows. This "regional incremental capital" may gradually spread to the global market, alleviating the pressure of capital outflows.
- Expectation Gap Correction in Regulatory Intensity: The U.S. SEC has initiated 3 additional lawsuits against non-compliant exchanges. Essentially, this is "cleaning up non-compliant platforms" rather than cracking down on the entire industry. Compliant platforms (e.g., Coinbase, Kraken) will instead see increased user and capital concentration as competitors decrease, indirectly driving growth in compliant trading volumes and benefiting long-term industry stability. Currently, market "panic sentiment" towards regulation has been overdone—if there are signs of policy easing in the future, prices are likely to rebound
Today's Bitcoin Trading Strategy
BTC@ buy:107000-108000
pt:109000-110000
sl:105000

$BTC – Make-or-Break ZoneA couple of things I want to highlight:
On the weekly chart, price is still at a critical level, retesting the S/R level for the second time.
Technically, if this move was truly impulsive, we shouldn’t be seeing price come back to the breakout area twice. We made a new ATH, but that strong rejection and marginal new high don’t look great.
That said, we could still get a three-tap on the trendline around 105.3k. A quick wick down there would be fine, but if price stalls at that level, that’d start to look a bit concerning.

BTCUSDT 2-Hour Chart Analysis !!BTCUSDT 2-Hour Chart Analysis
This 2-hour chart of Bitcoin/USDT shows the shift in price structure, as well as key technical levels and potential scenarios:
Bitcoin has broken out of a long-standing descending trendline and initially retested this breakout.
The market recently reached the resistance area around $111,000-$112,500, marked by the gray band.
Support:
The previous green box ($102,500-$106,000) remains a key demand area below, where buyers previously emerged.
Resistance:
The gray resistance area of $111,000-$112,500 has caused several rejections, but now the price is consolidating just below it after a breakout attempt.
Higher resistance at $123,000-$124,000 remains a distant target.
Retest and Breakout:
After reclaiming the trendline, the price has returned to test support at the breakout level and the lower trendline. This retest is significant: if bulls defend this area, we could see a new uptrend toward the $112,500 resistance area and possibly even higher, as indicated by the green arrow.
Upside Scenario:
If the price remains above the intersection of the trendline and horizontal support, a rally toward $115,000-$117,000 becomes possible.
Downside Risk:
Failure to hold the breakout level could cause the price to retrace to the green support area below $106,000.
DYOR | NFA

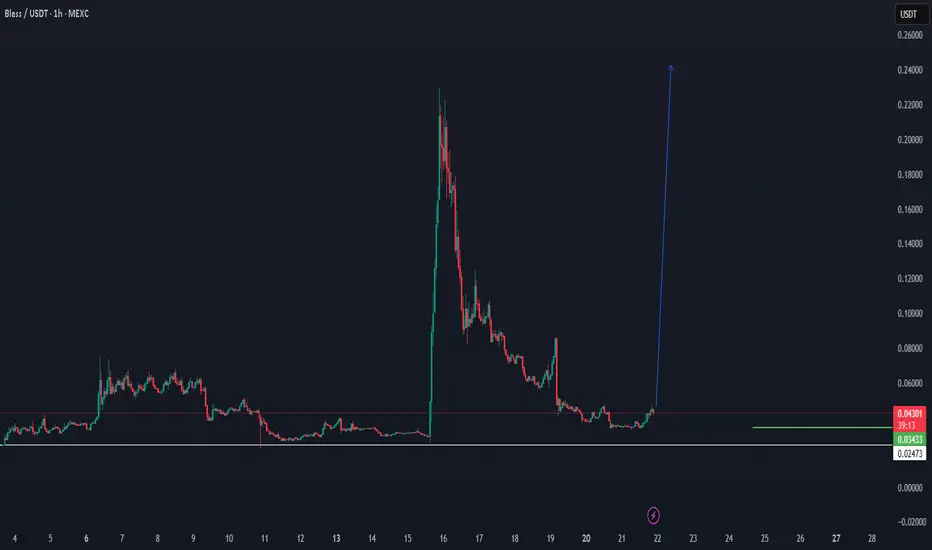
BLESS CAN DO IT AGAIN.. BACK TO $0,20+We following Bless from this bottom trend, with the expecting that it can return again with new wave, it can take some time, but the high chance is there depending on data.
BTC/USDT 4H AnalysisAfter taking out the sell-side liquidity, Bitcoin has shown signs of reversal and filled previous imbalance zones.
Currently, price is reacting from a Fair Value Gap (FVG) around the 110K area after a market structure shift (MSS).
🟢 The bullish scenario suggests that if this FVG holds, BTC could aim for the next buy-side liquidity around 126K as the main target.
🎯 First target: 115K – liquidity area above the short-term high.
🚀 Final target: 126K – buy-side liquidity sweep.
📌 Key zones:
Sell-side liquidity taken ✅
FVG (Potential bullish continuation area)
Buy-side liquidity at 126K
📅 Analysis based on Smart Money Concepts (SMC) and liquidity flow.
📖 For educational purposes only — not financial advice.

Bitcoin - Make it or break itBTC is at a level that will define whether we enter a bear market or a bull market. A Dip to the downside may cause a cascade effect that can take the market lower than expected. However, the majority of the signs in the market structure, momentum, and tradfi suggest that up is to be expected. To get shaken out with the evidence. Watch out for this bullish response if it does not produce something favorable, embrace for impact.
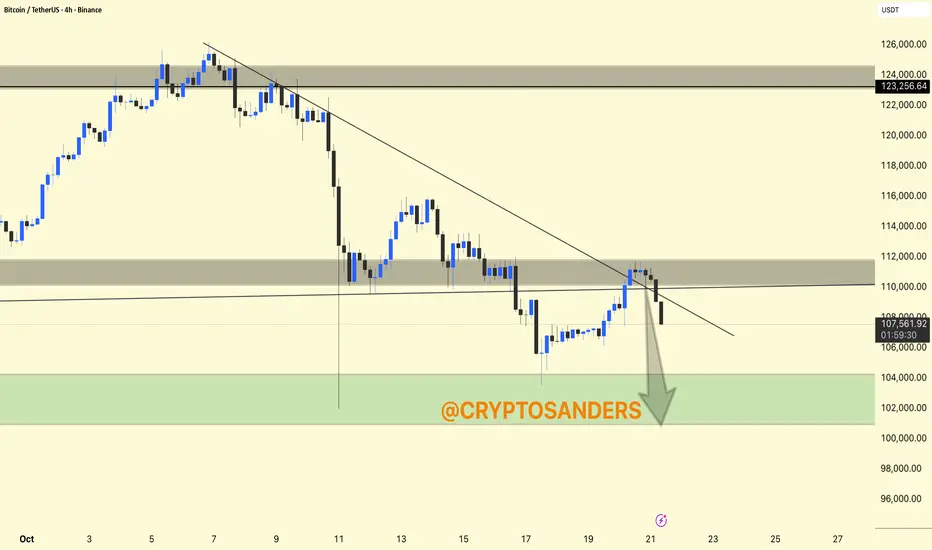
BTC:Continuing to pull back📈Looking at the 4-hour candlestick chart, Bitcoin continued to pull back and decline today. The short-term support level remains in the 107,000-107,500 range, which has provided support multiple times during previous downward movements. If the price breaks below this range, it may further drop to around 105,000. The resistance level is in the 112,000-113,000 range; a breakthrough here is expected to open up more upward space.
📝In the long term, after Bitcoin's fourth halving in April 2024, its daily production dropped from 900 to 450 coins, with the inflation rate falling below 1% for the first time. This has further strengthened its scarcity. Combined with the surge in institutional demand, the supply-demand gap is expected to widen, supporting a long-term upward price trend.
💡However, in the short term, the contradiction between continuous institutional inflows and profit-taking by short-term holders may lead to certain price fluctuations.
💎Trading Strategy:
Buy 107,000 - 107,500
SL 106,500
TP 108,000 - 109,000 - 110,000
Sell 111,500 - 111,000
SL 112,000
TP 110,000 - 109,000 - 108,000
Daily-updated accurate signals are at your disposal. If you run into any problems while trading, these signals serve as a reliable reference—don’t hesitate to use them! I truly hope they bring you significant assistance

Correct projection for BTCThe core conclusions of my analysis on Bitcoin today have all been verified by market trends, which can be summarized in three aspects: trend prediction, key level control, and trend logic:
1-Consistency with short-term trends: It was pointed out that "the 4-hour chart continues to pull back, with short-term support in the 107,000-107,500 range". Intraday BTC has continued to fluctuate around this support zone without breaking below the key level, and it was also noted that the resistance level is around 113,000,a breakthrough here is expected to open up more upward space. Today's fluctuations are completely in line with expectations.
2-Support from long-term logic: The long-term upward logic of "strengthened scarcity and expanded institutional demand after the 2024 halving" was reaffirmed. Although short-term fluctuations were affected by profit-taking, it has not deviated from the long-term positive framework.
3-We accurately captured "the restrictive effect of support and resistance levels on prices", with no deviations in judgments on "short-term fluctuation rhythm and long-term trend direction", effectively providing clear range and direction references for trading operations.

BUY BITCOIN BTCUSD - Low risk high rewardBitcoin experienced a big drop to the downside but it nows has clear signs of bullish movement ahead. There is currently a head and shoulders pattern forming which has given us high confidence that it will head to the upside. BUY NOW!

BTCUSDT - Signal#BTCUSDT - Signal
H4 - Formation of the 5th wave in continuation of the local trend. Stop at the low of the 4th wave.
Entry: 109078.62
TP: 111703.02 - 114354.47 - 118656.31 - 123553.38
Stop: 107265.89

Inverse Head & Shoulders on Bitcoin – Breakout or Bull Trap?Right now, Bitcoin ( BINANCE:BTCUSDT ) is moving within its Heavy Support zone($111,980-$105,820) .
Over the past couple of days, it tried twice to break this area but couldn’t. One big reason is that recently, there was news that Japan is considering allowing banks to invest in crypto . Also, yesterday, Trump confirmed he’ll meet with China’s president on October 31st , which the market took as a positive sign that US-China tensions might ease. Previously, the market dropped on news of potential tariffs, and now it’s reacting to the possible easing of those tensions.
In the last 24-48 hours , Bitcoin has formed an inverse head and shoulders pattern , which could signal a short-term bullish reversal. However, there are still important resistance levels and cumulative short liquidation areas overhead. We need to see if Bitcoin can break through those.
From an Elliott Wave perspective, Bitcoin still seems to be in a corrective structure, and until it gets above around $116,000 , there’s still a risk of further downside. So we shouldn’t get too excited about the recent 48-hour bounce.
In short, I expect Bitcoin might push up to those Resistance lines , the Resistance zone($114,300-$113,000) , and Cumulative Short Liquidation($115,241-$113,454) , thanks to the inverse head and shoulders, but it could face resistance there and possibly drop again.
Note: It seems that we may see an increase in Bitcoin with the opening of the US market, but because the SPX500 index( SP:SPX ) is in a correction situation, we can expect Bitcoin to fall again.
Note: Crypto market conditions depend on many parameters these days, and be sure to observe capital management.
New CME Gap: $107,690-$107,220
Cumulative Long Liquidation: $107,000-$105,782
Cumulative Short Liquidation: $112,241-$111,398
Please respect each other's ideas and express them politely if you agree or disagree.
Bitcoin Analysis (BTCUSDT), 1-hour time frame.
Be sure to follow the updated ideas.
Do not forget to put a Stop loss for your positions (For every position you want to open).
Please follow your strategy and updates; this is just my Idea, and I will gladly see your ideas in this post.
Please do not forget the ✅' like '✅ button 🙏😊 & Share it with your friends; thanks, and Trade safe.

TradeCityPro | Bitcoin Daily Analysis #202👋 Welcome to TradeCity Pro!
Let's dive into the Bitcoin analysis. The market has dropped again today. Let's review today's entry points together.
⏳ 1-Hour Timeframe
Yesterday, Bitcoin was rejected from the resistance it created at 111645, and with the bearish structure it formed, it made a bearish move after breaking 110213.
💥 The reason I removed the zone is that the price no longer reacts to it, and it seems that a box has formed between 111645 and 106319.
✅ The trigger that the price is currently on is the 107486 zone. Breaking this zone can give us a very risky and short-term short position.
✨ The RSI oscillator is near the Oversell zone, and with stabilization below this zone, there is a higher chance of a more significant bearish move with more momentum.
🔍 However, I can't rely much on momentum oscillators like RSI in these market conditions since there isn't a clear trend, and we don't have significant momentum to analyze the market with.
🧩 In these conditions, I believe the best tool to use is volume. Right now, selling volume is higher in the market, and in this bearish correction, the volume is decreasing. So, by breaking 107486, we can open a short position.
⚡️ If the market forms more structure and a long trigger appears, we can also open a long position after breaking the trigger.
💡 But the main triggers for long are breaking 111645, and for short, it's breaking 106319. The triggers between these two zones are very risky positions, and I won’t open a position with them. I prefer to wait for the main triggers.
❌ Disclaimer ❌
Trading futures is highly risky and dangerous. If you're not an expert, these triggers may not be suitable for you. You should first learn risk and capital management. You can also use the educational content from this channel.
Finally, these triggers reflect my personal opinions on price action, and the market may move completely against this analysis. So, do your own research before opening any position.

BTC 1H Analysis | Day 6🥳 Hey everyone! Hope you’re doing great! Welcome to SatoshiFrame channel.
✨ Today we’re diving into the 1-Hour Bitcoin analysis. Stay tuned and follow along!
👀 After faking the 111377$ resistance area, Bitcoin ran its stop-hunts and then moved toward its supports. In the process, after breaking the 109383$ support, it headed toward its current support in the 107508$ price area.
🔍 The exhaustion of buyers’ strength and the unusual participation of TakerSeller at the 111377$ price caused selling pressure on Bitcoin, making sellers the winners from that area. Bitcoin is now near its support, and the next resistances are at 109383$ and 111377$. With a break of these zones, it can move further upward.
🧮 On the RSI oscillator, we see that after losing the 50 zone, it moved strongly toward the oversell area and stayed there for a very short time—so short that we can call it a fakeout—and it formed a low near the 30 area. Now, losing the 30 zone and entering Oversell can be a confirmation for more selling pressure. The RSI resistance zone is at 50, and once the oscillation range passes above this zone, long-side momentum increases.
🕯 We’re going to check volume to understand better and get more data. After approaching its resistance, Bitcoin was accompanied by a decrease in buy volume, and subsequently sellers took control of the market; with increasing sell volume, Bitcoin’s price moved downward.
🧠 For a Bitcoin position we have 2 scenarios on the table that, if they occur, we can evaluate a position.
🟢 Long scenario: Break of the 109383$ resistance area and the oscillation limit crossing above the RSI 50 zone, together with increasing buy volume, with maker buyers also participating in this scenario for a price jump.
🔴 Short scenario: Break of the current support along with more selling pressure on Bitcoin, losing the 30 oscillation zone and RSI entering the oversell area.
❤️ Disclaimer : This analysis is purely based on my personal opinion and I only trade if the stated triggers are activated .

Chart analysis for Bitcoin. !!Chart analysis for Bitcoin.
A view of Bitcoin, focusing on key technical levels and market structure:
Trend and Price Activity
Downtrend Confirmation:
The price is clearly following a descending trendline. Attempts to break this line near the $111,000-$112,000 resistance level have failed.
Resistance Zone:
The gray area around $111,000-$112,000 represents a supply zone where the price struggled and faced selling pressure.
A very high resistance band exists near $123,000-$124,000 (upper chart), but the price is still well below this level.
Support Zone:
The large green box at $102,000-$106,000 marks a key demand zone, indicating where buyers could step in for a potential reversal or bounce.
DYOR | NFA
BTCUSDT — Decision Zone: Continuation or Major Correction Ahead?Bitcoin’s 2-Day chart (Bitstamp) is now approaching a critical macro zone — the $106,000–$101,000 support block, which acts as the last stronghold for bulls in this current uptrend.
This area represents a confluence of horizontal support and the main ascending trendline that has guided price since late 2024.
If buyers can defend this zone, Bitcoin could still experience one final leg up toward the cycle top.
However, a decisive breakdown below it would confirm the start of a major structural correction.
---
Structure and Pattern
Primary Pattern: Rising Wedge / Ascending Channel
The pattern indicates weakening bullish momentum — each higher high forms with less strength.
Such formations often end with a sharp breakdown once the support line fails.
Key Levels:
Support zone (yellow block): $106K – $101K
→ Confluence of trendline and horizontal support.
Immediate resistance: $116,500
Upper liquidity zone / cycle top target: $126K – $128.5K
---
Bullish Scenario — “The Final Push”
If Bitcoin successfully rebounds from the $106K–$101K zone, it could trigger the last upward wave toward $126K–$128.5K, potentially marking the final phase of this bull cycle.
Bullish Confirmation:
2D candle closes above $110K–$112K
Formation of a reversal pattern (hammer/pin bar) with increasing volume
Momentum indicators (RSI/MACD) start to turn upward
Upside Targets:
Target 1 → $116,500
Target 2 → $126K – $128.5K
Macro Narrative:
A bounce from this zone would likely lead to the final euphoric rally before distribution begins.
---
Bearish Scenario — “Breakdown of the Cycle”
If Bitcoin closes a 2D candle below $101K, the bullish structure will officially break down, confirming the start of a major correction phase.
This would validate the rising wedge pattern and shift momentum entirely to the bears.
Bearish Confirmation:
2D close below $101K
Failed retest around $104K–$106K
Rising selling volume
Downside Targets:
Target 1 → $92,500
Target 2 → $75,500
Macro Narrative:
A breakdown below $101K would mark the end of the bull market and the beginning of the re-accumulation phase below $90K.
---
Conclusion
Bitcoin is standing at its macro decision zone: $106K–$101K.
This range will determine whether we get one final bullish push — or the start of a major correction.
Holding above → potential rally toward $126K–$128K
Losing support → possible drop toward $92K–$75K
The next 2D candle will decide the macro direction of Bitcoin — continuation or collapse.
---
#Bitcoin #BTCUSD #BTCAnalysis #CryptoMarket #TechnicalAnalysis #PriceAction #SupportAndResistance #RisingWedge #BTCUpdate #BitcoinOutlook #CryptoTrend #MarketStructure #BitcoinChart #BTCOutlook

BTCUSD: Option A or B?Plan for today. 2 options for BTCUSD.
A: Break and close above 1 to go bullish.
B: Break and close below 2 to go bearish.
Option B is preferred with high timeline bearish view. However Option A is still a possibility with low probability.

BTC holds firmly above 110,000Today, BTC exhibited a trend of first declining and then rising.
At the opening, Bitcoin once dipped to 107,466, but subsequently, bulls began to gain momentum, driving the price to recover gradually. It successfully broke through the 110,000 mark and continued to rise.
From the perspective of market sentiment, the Fear & Greed Index is in the "Greed" zone, with the current index standing at 70. This indicates that despite short-term price fluctuations, the market remains optimistic about the overall trend. Such sentiment helps sustain the current consolidation and may provide momentum for a subsequent rally.
In terms of capital flows, on-chain data shows that although the overall capital flow is relatively complex, whales have recorded a significant net inflow in the latest cycle. Their inflow volume reached 207 million BTC, far exceeding the outflow volume of 160 million BTC. This strong buying power is the core driving force behind Bitcoin's ability to gain support at high levels and continue its upward trajectory.
Short-term trend forecast:
In the short term, BTC is likely to consolidate around 110,000. Attention should be paid to the resistance level near 112,000–113,000 on the upside and the support level near 107,500-107,000 on the downside. If it can break through the upper resistance, the price may surge toward the 115,000–118,000 range; if it falls below the lower support, it may drop to 105,000 or even lower.
Trading Strategy:
Buy 108000 - 109000
SL 107000
TP 110000 - 111000 - 112000
Sell 112000 - 111000
SL 113000
TP 110000 - 109000 - 108000
Daily-updated accurate signals are at your disposal. If you run into any problems while trading, these signals serve as a reliable reference—don’t hesitate to use them! I truly hope they bring you significant assistance

Correct projection for BTCBTC's movement today is fully consistent with our analysis, fluctuating upward within the range of 107,000 to 112,000. In terms of operation, it is necessary to closely follow this fluctuation range, adopt the "high short, low long" strategy, accurately seize the entry timing, and timely take profits when reaching the target level to ensure gains are locked in.
