BITCOIN IS IN A TRIANGLE UNTIL THE END OF 2025: EVERYTHING WILL 📣 Hello everyone!
I bring to your attention my medium-term view until the end of 2025 within the framework of this Bitcoin trading idea solely from the point of view of TA and my understanding of the chart.
🔹 Briefly and to the point:
1️⃣ I believe that Bitcoin's growth in October will be limited and right now the price is already close to local highs.
2️⃣ I expect an unexpected, disappointing drop in the BTC price after the recent ATN upgrade to $125,000 at the beginning of the month.
3. Anyone who flew into a long breakout will be thrown out of the market, many will believe in the beginning of a bear market and prematurely open short positions.
4️⃣ In November-December, I expect another small wave of growth, which will push the price of BTC a little over $130,000
5️⃣ I expect big events for Bitcoin in Q1 2026, but more on that later.
That's all for today, I wish you good luck in making independent trading decisions and making a profit. Please analyze the information you receive from me, always think only with your head!
Goodbye! ✊
BTCUSDT

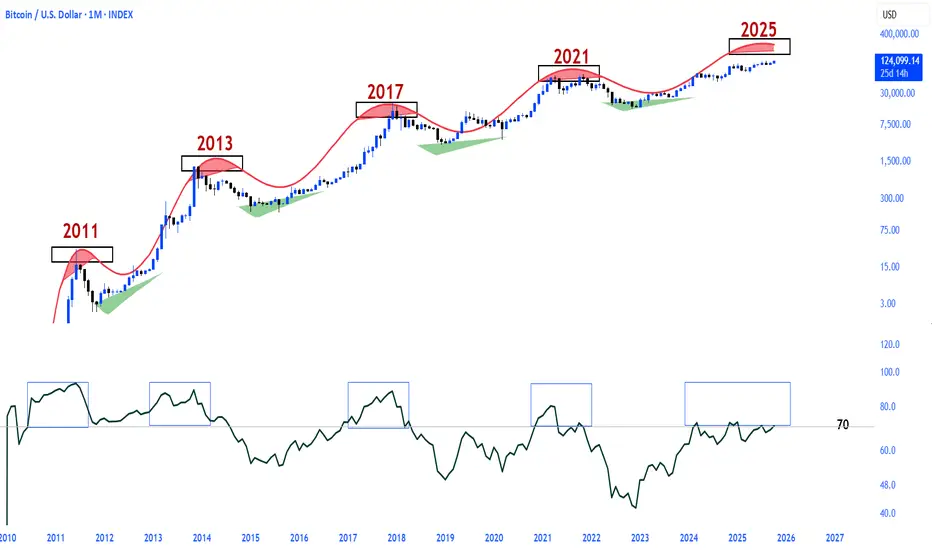
Bitcoin top not is in...The monthly RSI is back above 70 and hasn't even settled above the overbought level of 72.
The CRYPTOCAP:BTC rally will continue in the truest sense of the word.
Analytics: Market Outlook and Forecasts
📈 WHAT HAPPENED?
Last week, Bitcoin surprised us with its dynamics: despite the US shutdown, the cryptocurrency showed explosive growth. On the one hand, the shutdown is negative for the global market, people have less trust in the government. On the other hand, Bitcoin acts as an independent ecosystem perceived by people as a hedge asset in relation to fiat.
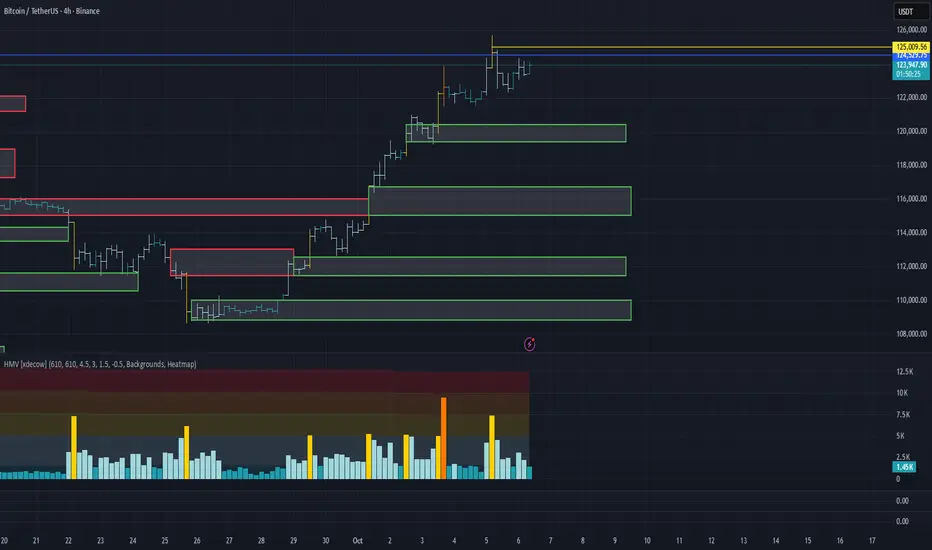
As a result of the massive inflow of liquidity, almost all of the sell zones were broken, with only a few offering resistance. Moreover, the all-time high (ATH) was reached and updated, now standing at $125,700.
💼 WHAT WILL HAPPEN: OR NOT?
The bullish momentum has now slowed down, with a strong absorption of buys. The pricing remains inefficient, increasing the likelihood of a correction.
The key area of attention is $125,000 (cluster anomalies). If there is a reaction from this level, we expect a move towards $120,000, where the nearest buyer activity zone is located.
If there is no reaction and a confident breakout of the current local high, we shift our focus to finding entry points for long trades during corrections.
Buy Zones:
• $120,400–$119,400 (absorption of selling pressure)
• $116,700–$115,000 (pushing volumes, strong chart imbalance)
• $112,500–$111,500 (mirror zone, volume anomalies)
• $110,000–$108,800 (strong absorption of selling pressure)
📰 IMPORTANT DATES
Macroeconomic events this week:
• October 8, Wednesday, 1:00 (UTC) — announcement of the interest rate decision in New Zealand;
• October 8, Wednesday, 19:00 (UTC) — publication of the US FOMC minutes;
• October 9, Thursday, 12:30 (UTC) — speech by US Federal Reserve Chairman Jerome Powell, as well as publication of the number of initial jobless claims in the US;
• October 10, Friday, 12:30 (UTC) — publication of the average hourly wage, unemployment rate, and change in the number of non-agricultural workers in the United States for September.
*This post is not a financial recommendation. Make decisions based on your own experience.
#analytics
BTC WeeklyBitcoin has always moved in repetitive cycles: a strong bull run, followed by a correction phase, and then starting a new rally from the lows. If we look at its price history, we can clearly see that these cycles repeat every few years with very similar patterns.
Right now, Bitcoin is in a position that looks very similar to the past cycles. When we align these patterns, it suggests that another correction could be ahead.
🔹 In my opinion, based on these cycles, Bitcoin could see a deeper pullback over the next year and even drop to around $47,000.
Of course, this is just a personal view based on past market behavior and not a guarantee — but history shows Bitcoin has repeated this path many times.

BTC 1H Analysis - Key Triggers Ahead | Day 52☃️ Welcome to the cryptos winter , I hope you’ve started your day well.
⏰ We’re analyzing BTC on the 1-Hour timeframe .
👀 On the 1-hour timeframe, Bitcoin has broken through all major resistance levels, setting a new ATH, and then experienced a 2% price drop due to profit-taking and FOMO-driven selling. It then moved toward its key support zone around $122,584, bounced from there, and is now moving toward its early trigger zone at $124,113.
🧮 The RSI oscillator shows two important levels — 63 and 45 — and once the volatility threshold crosses especially above 63, Bitcoin could see a sharp increase in volatility, activating its triggers and enabling breakout moves.
🕯 Bitcoin’s volume has decreased after each touch of resistance, but now with a noticeable volume increase, our early trigger could become active, allowing Bitcoin to form larger, high-volume candles either upward or downward. Since the high-wave cycle remains bullish, the current scenario still favors upside continuation and resistance breakouts.
🧠 For Bitcoin positions, it’s better to wait for all confirmations to align — including activation of the early trigger, an RSI breakout above 63, and rising buy volume — before opening a long position.
❤️ Disclaimer : This analysis is purely based on my personal opinion and I only trade if the stated triggers are activated .

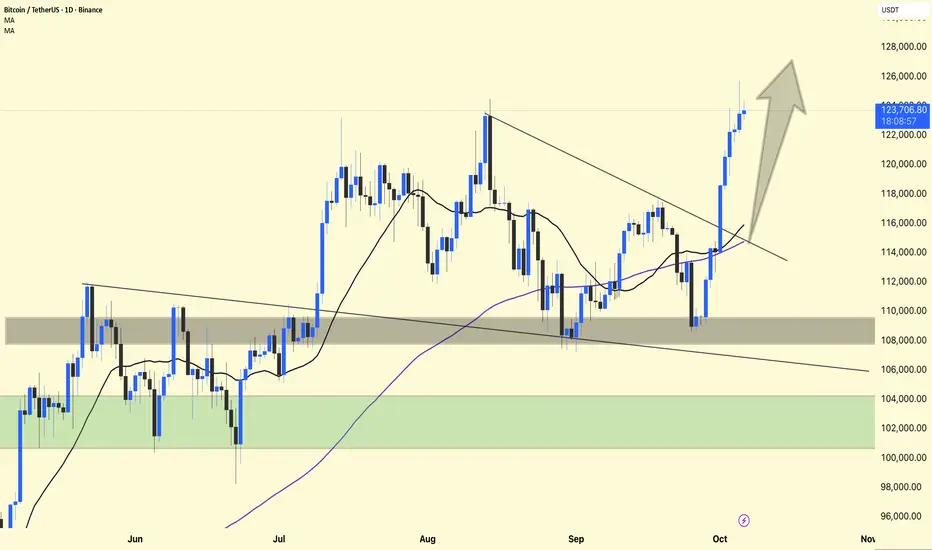
Bitcoin Technical Update – Strong Breakout!Bitcoin has successfully broken out of the descending trendline that had been holding the price down for several weeks. This breakout confirms a shift in market structure from bearish to bullish.
After finding strong support around the $110,000-$112,000 area, BTC bounced sharply and reclaimed both the 21-day and 100-day moving averages – a powerful bullish signal. As long as the price remains above $115,000 to $116,000, we can expect continued upward momentum.
The current move shows healthy strength with volume support, indicating strong buyer interest. If momentum persists, the next potential target is around the $125,000-$128,000 area, where some profit-taking could occur.
Support: $115,000 – $116,000 (previous resistance turned support)
Resistance: $125,000 – $128,000 (short-term target area)
Currently, the upside remains in bullish favor. If the market structure remains stable, any decline towards $116,000-$118,000 could provide a potential buying opportunity.
Remember: Avoid blindly chasing breakouts. Allow the price to retest or consolidate before entering — patience pays off in trend trades.
bitcoinbtc usdt daily analyse
time frame 4 hours
risk rewards ratio > 5 woooow
target 123.000 $
btc is in the down side of my critical red box
here is good area to pump
LS is very tight to decrease my probably damage
so I open a long position to win

BTCUSDBTCUSD needs correction and further upside to break the ATH again.
Disclosure: We are part of Trade Nation's Influencer program and receive a monthly fee for using their TradingView charts in our analysis.

TradeCityPro | Bitcoin Daily Analysis #187👋 Welcome to TradeCity Pro!
Let’s go over Bitcoin’s analysis — today, Bitcoin has recorded a new ATH. Let’s review the market conditions together.
📅 Daily Timeframe
In the daily timeframe, Bitcoin is moving inside an ascending channel with a steady upward slope.
⭐ After a corrective move from the top of the box, the price made a fake breakdown of the channel’s bottom and then, with the bullish momentum that followed, moved upward and managed to set a new ATH.
✔️ During the correction, the volume was decreasing, but after the price was supported at the key support zone and the fake breakdown occurred, buying volume entered the market.
✨ The main confirmation of the bullish continuation could be taken after breaking above 117056. Currently, the next confirmation trigger is a price stabilization above 123433.
💥 In my opinion, since RSI is getting rejected from the 70 level and the price has reached a strong resistance zone, there’s a high chance that the market will range below this resistance for a few days to test it.
🧩 At the moment, the main RSI resistance level seems to be 75.38 — if this level breaks, the main market momentum could start, leading to a sharp move upward.
📊 It’s completely normal for the trend to show weakness after reaching an ATH, because this level is Bitcoin’s largest supply zone. These wicks hitting the resistance zone don’t necessarily mean trend weakness — it’s typical for the price to form such candles when testing its all-time high.
🔑 What really matters is how the price reacts in the next few attempts at this zone, which will tell us whether we have an actual trend weakness or not.
💫 Right now, the most important support Bitcoin has built is around 107000. If a bearish move begins, the first confirmation of a downtrend will be breaking this area. However, the main confirmation of a full bearish reversal would be the break of 100961.
🎲 Overall, since the price is currently at the top of the market, finding precise triggers on Bitcoin is difficult. But considering Bitcoin dominance has the potential to drop, altcoins could provide excellent trading setups in the coming days if that dominance decline begins.
❌ Disclaimer ❌
Trading futures is highly risky and dangerous. If you're not an expert, these triggers may not be suitable for you. You should first learn risk and capital management. You can also use the educational content from this channel.
Finally, these triggers reflect my personal opinions on price action, and the market may move completely against this analysis. So, do your own research before opening any position.

UPTOBER 2017 \ 2025Bitcoin is entering a parabolic phase again.
The same energy,
similar structure,
the spirit of 2017.
CRYPTOCAP:BTC 🔃

Bitcoin Swing Trade Setup – Institutional Inflows Fuel Bulls🎭 BTC/USD – Money Heist Plan 🚀 (Swing + Scalping Strategy)
📊 BTC/USD Real-Time Market Data
Current Price: $111,156.01
24h Change: +$2,117.61 (+1.94%)
Day’s Range: $108,540.93 – $111,180.45
52-Week Range: $49,538.00 – $123,640.00
😰 Fear & Greed Index
Score: 49/100 → Neutral 😊
Trend: Shifted from “Fear” to “Neutral” in the last 24 hours.
🧠 Investor Sentiment Outlook
Retail Traders: Cautious (63% worry about crypto safety).
Institutional Traders: Bullish (💵 $3.7B net inflows in August).
🌍 Fundamental & Macro Score
Policy Uncertainty: High (U.S. tariffs, Fed policy shifts).
Fed Rate Cut Probability: High (expected September cut).
Key Event: Non-Farm Payrolls (Sept 5; forecast 45K jobs).
Gold Rally: $3,508/oz (+30% YTD, strong hedging demand).
🐂 Market Outlook
Short-Term: Neutral → Slightly Bearish (September volatility ahead).
Long-Term: Bullish (Institutional inflows + macro liquidity).
Bull/Bear Score: 55% Bullish vs 45% Bearish.
🎯 Thief’s Trading Plan (Layered Entry Strategy)
I’m setting up multiple limit orders (“Thief Layers”) instead of going all-in — this spreads risk, builds better entries, and keeps flexibility.
Entry (Layered Buys):
$109,000 → $109,500 → $110,000 → $110,500
(Add more layers as per your own strategy)
Stop Loss (Thief SL):
$107,500 (Adjust for your own risk appetite)
Target Zone (Profit Extraction):
$116,000 (Checkpoint before major resistance zone)
💡 Key Takeaways
BTC rebounded +1.94% but faces headwinds from whale profit-taking & policy risks.
Neutral sentiment (49/100) reflects a balanced investor mood.
Friday’s NFP jobs data could shape Fed rate expectations → big volatility catalyst.
🔍 Related Pairs to Watch
BITSTAMP:ETHUSD | COINBASE:SOLUSD | BITSTAMP:XRPUSD | BINANCE:BTCUSDT | CRYPTOCAP:BTC.D
#BTCUSD #Bitcoin #CryptoTrading #SwingTrade #Scalping #TradingStrategy #LayeredEntries #CryptoCommunity
✨ “If you find value in my analysis, a 👍 and 🚀 boost is much appreciated — it helps me share more setups with the community!”

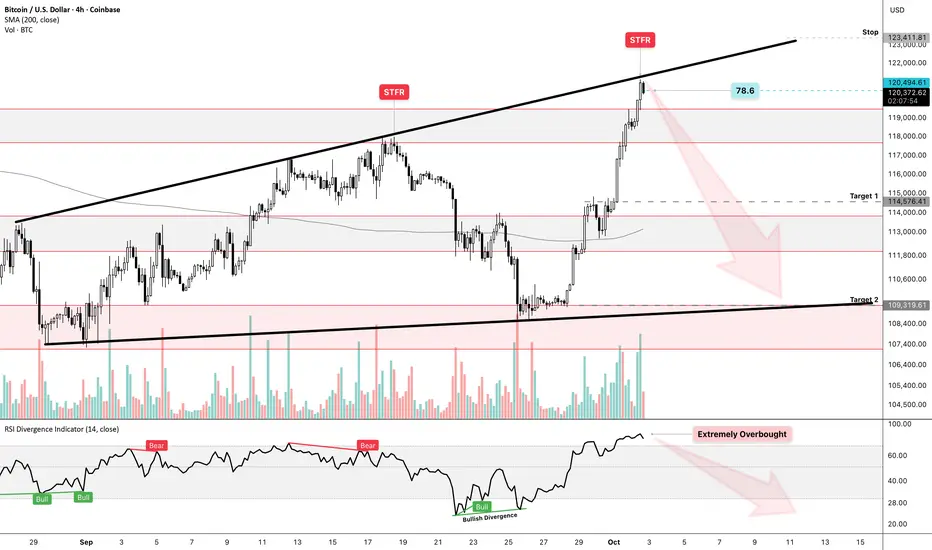
BTCUSD – Go Short or Go Broke | H4 Setup📝Thesis: Just entered a short on COINBASE:BTCUSD based on a confluence of technical and macro signals. This isn’t just about overbought RSI - it’s about asymmetric risk, deceptive bullish structure, and a broader bearish undertone most traders are ignoring.
📉 Setup Breakdown
RSI (H4): 85.12 – Extremely Overbought. Historically, this zone has triggered sharp pullbacks. Previous RSI peaks marked “Bear” on chart confirm the pattern(July, August 2025).
📊 Chart Structure: Rising wedge approaching STR resistance zone + 78.6 fib level. Price action looks exhausted, and volume is fading.
🌐 Macro Bias: Despite local bullish momentum, the broader trend remains bearish. Credit spreads are widening, and macro liquidity is tightening. Risk-off tone is creeping in.
⚖️ RR Profile: ATH is just ~$4K above. Downside targets offer cleaner reward zones with tighter invalidation. Stop placed just above STR zone.
🎯 Trade Parameters
✅ Entry: Near STR resistance zone
⛔️ Stop: Above upper trend line / STR zone
🟠 Target 1: Mid-channel support
🟢 Target 2: Lower fib confluence zone
🧠 Macro Overlay
U.S. credit spreads are widening (HY index at 2.75%, CDS spreads rising).
Government shutdown risk is escalating.
Fed is in risk-management mode - not panic yet, but tone is shifting.
October is historically volatile (see 2008 analogs) - watch for liquidity stress.
⚠️ TL;DR
Shorting INDEX:BTCUSD here isn’t just technical - it’s strategic. Overbought RSI + bearish wedge + macro stress = asymmetric setup.
Risk is capped, reward is clean. Let’s see how it plays out.
$BTC / $GOLDCRYPTOCAP:BTC / TVC:GOLD 🔃
2013 | 1 Btc = 1 Gold
2017 | 1 Btc = 16 Gold
2021 | 1 Btc = 37 Gold
2025 | 1 Btc = 31 Gold \ More is coming
In December 2024, 1 Bitcoin was worth 41 gold, but there was no monthly close above the 2021 ATH level.

BTC ANALYSIS🔮 #BTC Analysis 🚀🚀
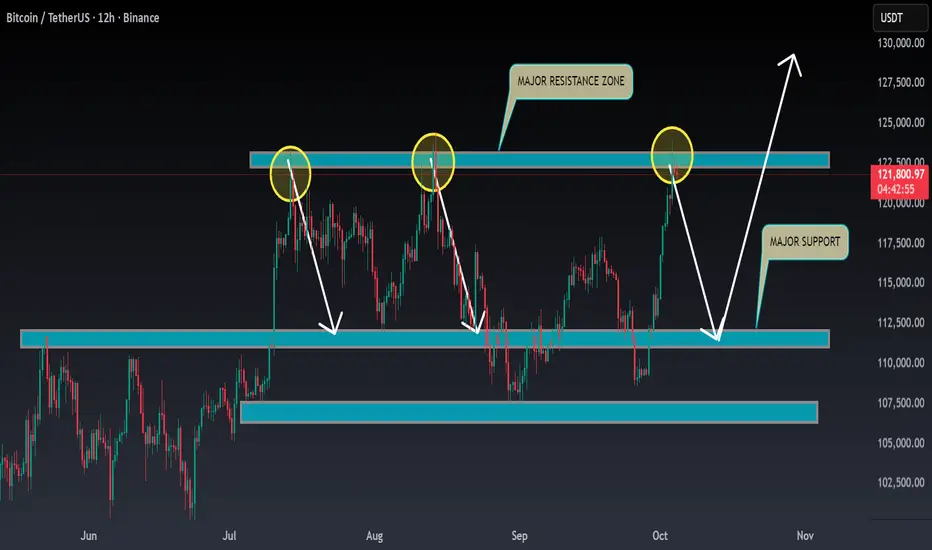
💲💲 #BTC is trading between support and resistance area. There is a potential rejection again from its resistance zone and pullback from support zone. If #BTC breaks the major resistance zone then we would see a bullish move or else we will get a downfall towards its major support zone
💸Current Price -- $1,21,800
⁉️ What to do?
- We have marked crucial levels in the chart . We can trade according to the chart and make some profits. 🚀💸
#BTC #Cryptocurrency #DYOR
BTCUSD trade idea BTC/USDT 15m Analysis – Possible Breakout Setup
Price has been respecting an ascending trendline, creating higher lows (121,576 → 121,787 → 121,970) which shows buyers are stepping in earlier each time.
We can also see the time between resistance retests shrinking, which often signals seller exhaustion and builds pressure for a breakout.
📌 Key Levels:
• Short-term resistance: 122,750 – 123,000
• First TP: 123,371
• Second TP: 123,900
• Invalidation: Below 121,970 (third low)
As long as price holds above the trendline, the structure favors a bullish breakout confirmation toward the upside targets.

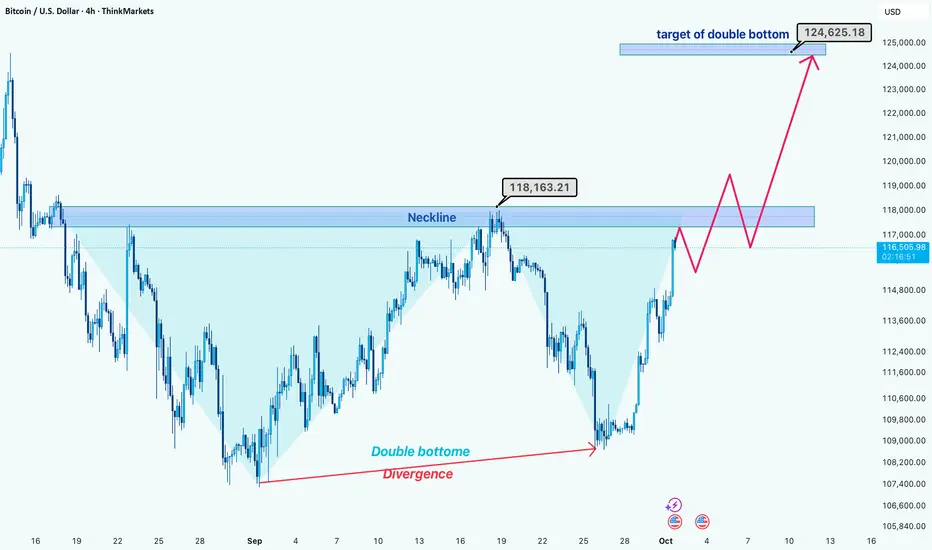
Bitcoin Technical: Double Bottom Setting Up for $124.6K?Hi guys!
Bullish Divergence
Bitcoin has recently formed a bullish divergence, which signals that selling pressure is weakening and buyers are stepping in.
Double Bottom Formation
A double bottom pattern is clearly visible, but the critical neckline resistance around $118,163 hasn’t been broken yet. This area is the key confirmation level.
Potential Breakout
Thanks to the bullish divergence, there’s a strong possibility that BTC will break above this neckline in the coming sessions.
Long Position Strategy
The safest long entry would be after the neckline breakout and a small pullback (correction) to confirm support. This reduces the risk of a false breakout.
Target Projection
If confirmed, the double bottom pattern projects a target around $124,600, offering a solid upside potential from the current levels.
Disclaimer: As part of ThinkMarkets’ Influencer Program, I am sponsored to share and publish their charts in my analysis.
ElDoradoFx PREMIUM 2.0 – Weekend Bonus BTCUSD Analysis 04/10/25
BTC is trading around 122,280, consolidating after an explosive rally of over +11,000 pips from the 110,600 demand zone. After a strong bullish impulse, momentum is slowing as price hovers near short-term resistance.
⸻
🔍 Technical Outlook
Daily (1D):
BTC printed a massive bullish breakout from the descending channel, rallying from 110,600 to 123,800 before facing rejection at 123,900 — a previous structural high and psychological resistance.
• MACD: strong bullish momentum but starting to flatten, suggesting exhaustion.
• RSI: near 70, indicating overbought conditions.
• Parabolic SAR: still below price (bullish bias intact).
→ The daily structure remains bullish, but pullbacks are likely before continuation.
Intraday (1H):
Price is forming a short-term range between 121,950–122,900.
• The 200 EMA (white) is below price at 120,800, confirming ongoing bullish structure.
• However, MACD histogram shows decreasing buying volume and potential cross to the downside → early sign of correction.
• RSI hovering around 55–60, neutral zone → consolidation after high volatility.
Short-Term (15M / 5M):
BTC is showing lower highs while holding the 122,150–122,250 zone, building a potential bull flag.
• On the 15M chart, a small descending channel connects the highs at 122,790 → 122,460 → 122,300.
• 5M chart shows repeated liquidity sweeps below 122,180, followed by immediate rebounds → strong short-term demand.
Fibonacci Golden Zone (from swing low 120,779 → swing high 123,887):
Golden zone = 122,000–122,300 — BTC is trading exactly inside it now, offering a high-probability reload area for buyers if defended successfully.
⸻
📈 High-Probability Entry Zones (Max 60 pips SL)
🎯 Buy Setup (Fibonacci Golden Zone Support):
• Entry: 122,000–122,200
• SL: 121,900 (below structure)
• TP1: 122,600
• TP2: 122,900–123,000
• TP3 (extended): 123,800 (previous high)
→ Confluence: Fib Golden Zone + short-term EMA support + strong RSI defense.
🎯 Sell Setup (Short-Term Resistance Rejection):
• Entry: 122,850–123,000
• SL: 123,100
• TP1: 122,450
• TP2: 122,100
→ Only valid if price fails to hold above 122,850, confirmed by bearish candle structure on 15M.
⸻
📌 Breakout Levels to Continue Trend
• Bullish Continuation: Above 123,000–123,200 → momentum could extend into 123,900–124,400.
• Bearish Continuation: Below 121,900 → opens correction toward 121,200–120,800 (EMA + liquidity pool).
⸻
📅 Fundamental Watch (Weekend)
• No major events until Monday.
• Weekend liquidity is extremely thin, expect sharp stop hunts and sudden wicks.
• CME futures closed at 122,350 → small gap risk on Sunday open.
• Market sentiment remains cautiously bullish after strong week for risk assets.
⸻
⚠ Key Technical Zones
Resistance:
• 122,850 → 123,000 → 123,900 (major)
Support:
• 122,000 → 121,900 → 120,800
⸻
✅ Summary
BTCUSD is consolidating inside the Fibonacci golden zone (122,000–122,300) after a massive breakout week. The bias remains bullish while above 121,900, but momentum is slowing. Scalpers can buy dips within the golden zone for short-term 200–600 pip reactions. A clean breakout above 123,000 confirms bullish continuation, while a break below 121,900 triggers a correction toward 120,800.
— ElDoradoFx PREMIUM 2.0 Team

BTC analysis.Give me some energy !!!The price surged, breaking the triangle after 6 months, and now it can be said that Bitcoin will soon reach $150,000.
PREVIOUS ANALYSIS

BITCOIN STILL IN THE ZONE - UPDATE 03-10-2025📊 Market Update
BTC remains positive on the lower time frame at 119.8, while the main trend is holding at 110.3. In the next BTC update, we’ll see whether BTC is still maintaining its positive structure — any new changes will be added.

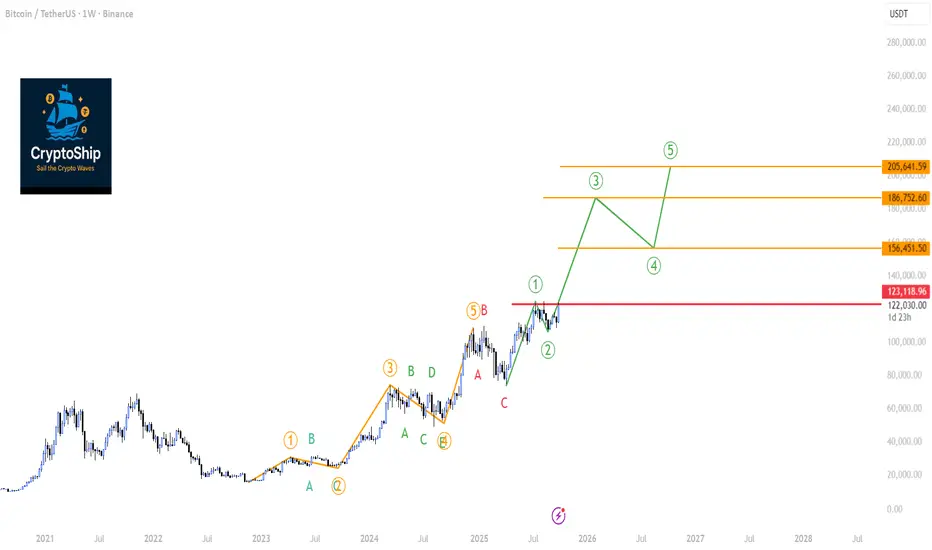
BTC vs. The Broader Market: A Dangerous Powerful Wave is Coming Today, we're taking a deep dive into the two most important charts in the crypto space: Bitcoin (BTC/USDT) and the Total Crypto Market Cap (TOTAL). Using an Elliott Wave framework on the weekly timeframe, we can see a clear bullish structure taking shape. However, some underlying weaknesses in key indicators warrant a cautious approach. Let's break it down.
1. Bitcoin (BTC/USDT): The Path to a new All-time high Hinges on a Key Level
As we can see on the weekly chart, Bitcoin appears to have completed a major five-wave impulse cycle which topped out around the $108,000 mark. This was followed by a necessary ABC corrective phase.
The exciting part is what comes next. We are potentially witnessing the beginning of a brand new five-wave impulse.
Wave (1): Appears to have started from the $74,000 low and peaked near $124,000.
Wave (2): A healthy correction followed, finding support around $107,000.
If this count is valid, we are now in the early stages of Wave (3), which is typically the most powerful and extended wave in an impulse sequence.
The Critical Condition:
For this bullish count to remain the primary scenario, the current weekly candle must NOT close below $123,000. A weekly close below this crucial level would risk invalidating the start of this new impulse, suggesting that we may still be within a more complex corrective structure (such as a regular flat correction Check the article).
Also during wave (3) the Weekly RSI must go beyond "80" showing strong momentum ( if it fails to do so then it's a caution signal to be strongly considered because a reversal could happen at any time!)
Indicator Analysis:
Bearish Divergences: We must note the lingering bearish divergences on both the RSI and MACD. These signals are suspicious and suggest that momentum is not fully confirming the recent price highs. They need to be monitored closely.
Volatility Coiling: The Bollinger Band Width Percentile (BBWP) is showing significant contraction. This coiling of the bands indicates that weekly volatility is decreasing, which often precedes a massive price expansion in the coming weeks or months, However the lack of BBWP exhaustion (spectrum crossing 90%) remains a bullish sign combined with the contraction
Trend Strength: The ADX is rising on the weekly chart, confirming that a strong trend is in progress.
Volume: On-Balance Volume (OBV) and general volume profiles appear adequate for now.
2. Total Crypto Market Cap (TOTAL): The Broader Market Picture
The Total Crypto Market Cap chart tells a very similar story, reinforcing our Bitcoin analysis. The bullish phase began in sync with BTC back in November 2022.
The current Elliott Wave structure for the entire market is as follows:
Wave (1): Completed in March 2024.
Wave (2): Corrected into May 2024.
Wave (3): Finshed on March 2024
Wave (5): Finshed on December 2024
Currently the Total market cap chart is closely alligned with BTC chart which confrims the BTC leadership is intact. The current Elliot count of TOTAL market cap indicated wave (1) started April 2025 but curretly wave 2 showing caution signals
A Significant Red Flag - The Volume Divergence:
While the price structure remains bullish, there's a concerning signal under the hood. On the weekly RSI, we see a double bottom pattern, which is typically bullish. However, looking at the On-Balance Volume (OBV) during the same period, the OBV printed a lower low.
This is a classic bearish divergence between price/momentum and volume. It indicates that the recent push higher is not being supported by genuine, strong volume, suggesting conviction is weak.
Alternative Scenario:
If this volume weakness persists, we might see Wave (2) extenstion to around $3.23 Trillion. This would lead to a deeper Wave (2) correction, From that support, Wave 3 could launch that would still likely reach our ultimate ATH.
Conclusion: Bullish Outlook with a Note of Caution
Bringing both analyses together, the macro view for the crypto market remains decisively bullish. The Elliott Wave structures on both BTC and the TOTAL chart point towards significantly higher valuation, the lack of BBWP exhaustion on weekly charts of BTC & Total market cap remains a strong bullish indication combined with the BBWP expansion.
However, the market is showing signs of fatigue. The bearish divergences on Bitcoin's indicators and the critical volume divergence on the TOTAL chart cannot be ignored. This suggests that while the overall destination is uptrend, the journey might include a corrective dip before the next explosive leg higher.
Key Takeaways:
Overall Bias: Bullish.
Key Level for BTC: Watch the weekly close relative to $123,000. This is our line in the sand for the current impulsive structure.
Key Concern: The lack of strong volume confirming the market's recent move up warrants caution.
Volatility: Brace for a significant expansion in price movement. The compressed BBWP on both charts suggests a major move is brewing.
Stay vigilant and manage your risk accordingly. The next few weekly closes will be critical in determining whether we blast off directly or take a detour first.
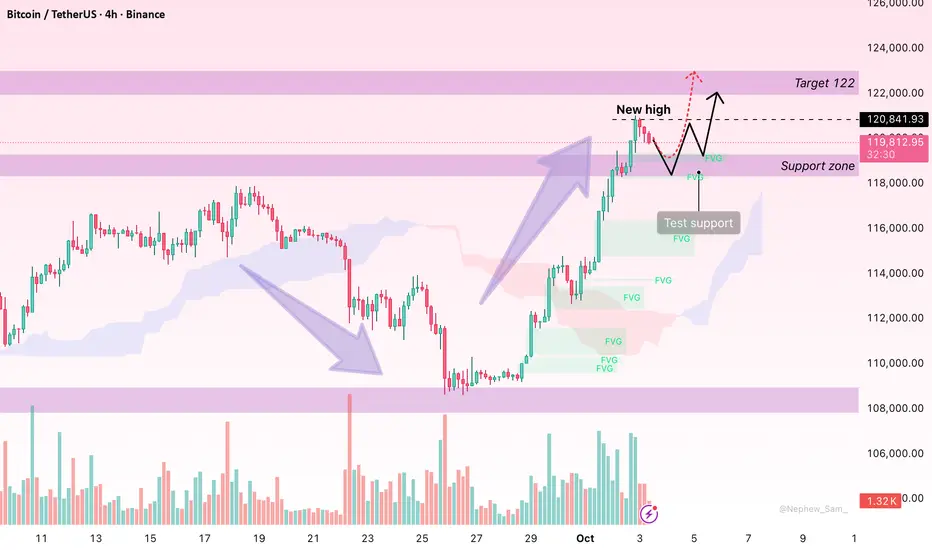
Bitcoin: Mild Pullback Before Eyeing Fresh HighsHello everyone, Bitcoin continues to capture attention after reaching a peak of 120,324 USD before easing slightly to around 119,793 USD. This pullback is viewed as a technical pause within a broader uptrend rather than a sign of reversal.
From a technical perspective, BTC remains above the Ichimoku cloud and is supported by FVG zones around 119,000–118,500 USD. Trading volume surged at the 120,000 USD level, highlighting strong institutional buying and reinforcing the bullish outlook.
On the news front, the US dollar is weakening due to the risk of a government shutdown, while capital inflows from ETFs and major institutions continue to flow into the market. Combined with the current low interest rate environment, Bitcoin increasingly stands out as an attractive safe-haven asset.
In the near term, Bitcoin is expected to hold support at 119,000–118,500 USD and rebound towards 122,000 USD, with extended targets at 125,000 USD and even 128,000 USD if momentum remains strong.
Only a break below 118,500 USD would open the door for a deeper correction towards 117,800–116,500 USD before recovery attempts resume.
What’s your view? Will BTC/USDT hold the line and move on to conquer 125,000 USD?
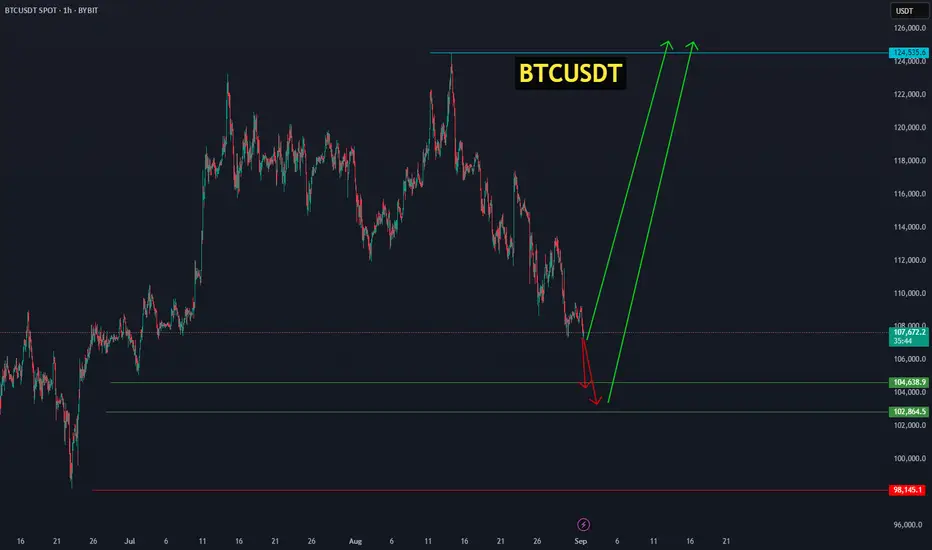
Bitcoin from the 102,864 zone is set to ignite its next bullish Bitcoin will either start its upward move from the current price or from the range of 104,638.9 – 102,864.5, aiming for targets between 118,000 and 124,535. BINANCE:BTCUSDT
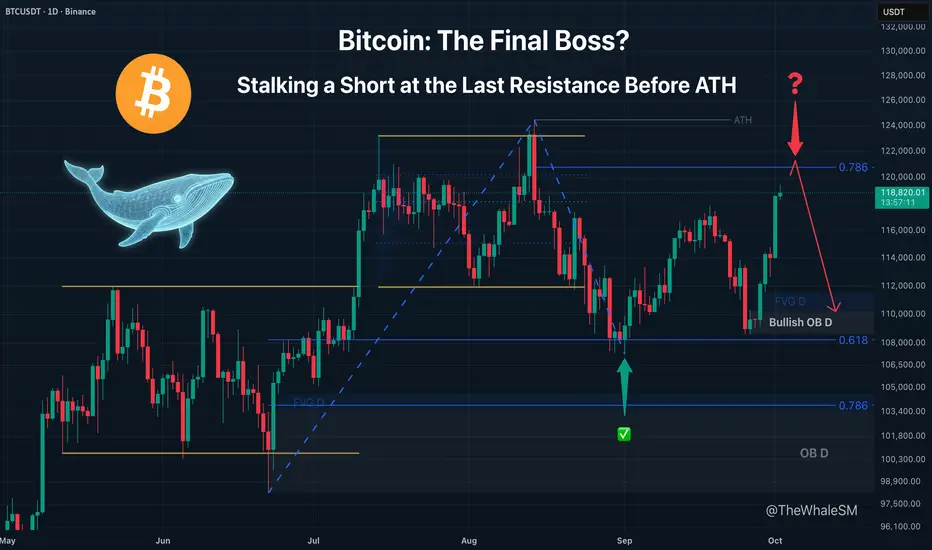
BTC: New ATH or One More Correction? The 78.6% Level DecidesIn every great story, there is a final challenge before the ultimate prize. For Bitcoin, that moment is now. The price is approaching the last major line of resistance that stands between the current price and a new All-Time High. This analysis breaks down that critical level and the tactical, counter-trend opportunity it may present.
Bitcoin is continuing its uptrend after the correction to the 61.8% Fib level, which I showed in the trade idea " Bitcoin's Tumble: How Deep Does the Rabbit Hole Go? ", and is now approaching a very important level that will determine whether a new ATH will be formed or if the asset will correct further before that.
This is the 78.6% Fib level - the last resistance level from which a short can be considered.
Conditions for the Short Setup:
🔑 POI: 78.6% Fibonacci Retracement Level
🔎 ENTRY CONDITIONS: The price must find acceptance below the 78.6% level. Since this is a daily structure, this may require daily candle bodies closing below the level for confirmation.
🎯 MINIMUM TARGET: Bullish Daily Order Block below.
❌ INVALIDATION: A confirmed break and hold above the 78.6% level. A break here would signal a probable move to a new ATH.
~~~~~~~~~~~~~~~~~~~~~~~~~~~~~~~~~~~~~~~~~~~~~~~~~~~~~~~~~~~~~~~~~
The principles and conditions for forming the manipulation zones I show in this trade idea are detailed in my educational publication, which was chosen by TradingView for the "Editor's Picks" category and received a huge amount of positive feedback from this insightful trading community. To better understand the logic I've used here and the general principles of price movement in most markets from the perspective of institutional capital, I highly recommend checking out this guide if you haven't already. 👇
P.S. This is not a prediction of the exact price direction. It is a description of high-probability setups that become valid only if specific conditions are met when the price reaches the marked POI. If the conditions are not met, the setups are invalid. No setup has a 100% success rate, so if you decide to use this trade idea, always apply a stop-loss and proper risk management. Trade smart.
~~~~~~~~~~~~~~~~~~~~~~~~~~~~~~~~~~~~~~~~~~~~~~~~~~~~~~~~~~~~~~~~~
If you found this analysis helpful, support it with a Boost! 🚀
Have a question or your own view on this idea? Share it in the comments. 💬
► Follow me on TradingView for timely updates on THIS idea (entry, targets & live trade management) and not to miss my next detailed breakdown.
~~~~~~~~~~~~~~~~~~~~~~~~~~~~~~~~~~~~~~~~~~~~~~~~~~~~~~~~~~~~~~~~~