Next Volatility Period: Around December 23rd
Hello, fellow traders!
Follow us to get the latest updates quickly.
Have a great day!
-------------------------------------
#BTCUSDT
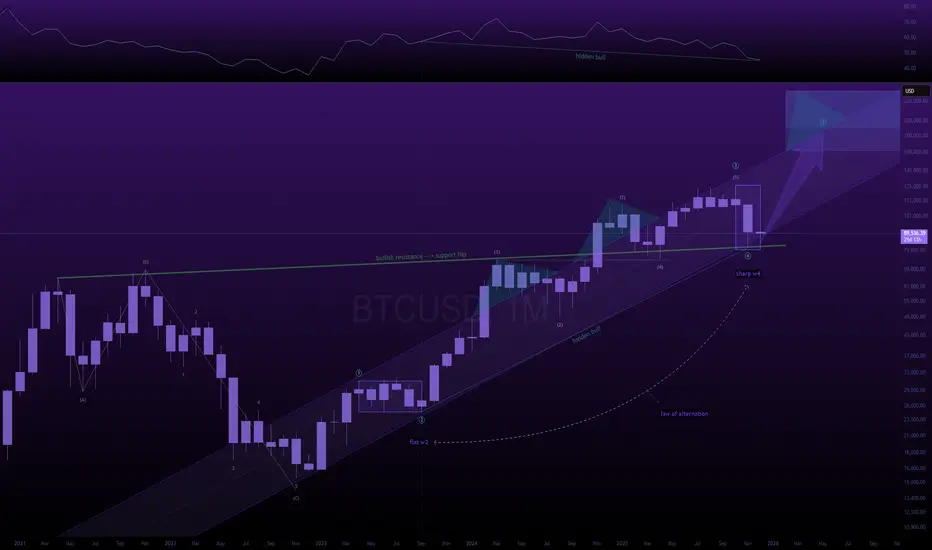
To initiate a bullish trend, the price must rise above and sustain the OBV Low indicator level.
Considering the basic trading strategy of buying around DOM(-60) ~ HA-Low and selling around HA-High ~ DOM(60), the current price position represents a buying opportunity.
However, if the price falls between DOM(-60) and HA-Low, a stepwise downward trend is likely, so you should consider a response plan.
If the price falls below the DOM(-60) indicator, you should check for support around the 69000-73499.86 level.
This is because the 69000-73499.86 level represents an important support and resistance zone for sustaining an uptrend from a long-term perspective.
If the price declines from the 69,000-73,499.86 range, it is expected to form an uptrend around 42,000, a level never seen again.
-
If the price rises above the OBV Low indicator level and continues its upward trend, we should check for an upward breakout near the area circled on the chart.
If the price fails to break out, we should consider a response plan, as this could signal a full-blown bear market.
If the price continues to rise, the target levels are: - Right Fibonacci ratio 2.618 (133,889.92)
- Right Fibonacci ratio 3 (151,018.77) ~ 3.14 (157,296.36)
It is expected to re-establish the trend by rising near the above range.
The coin market is likely to experience a major bear market around the week of January 26, 2026.
-
Thank you for reading.
I wish you successful trading.
--------------------------------------------------
- Here's an explanation of the big picture.
(3-year bull market, 1-year bear market pattern)
I will explain more in detail when the bear market begins.
------------------------------------------------------
BTCUSDT

BTCUSDT Long: Demand Support Fuels Push Toward $92,500Hello, traders! BTCUSDT previously traded within a well-defined Descending Channel, confirming strong bearish pressure and controlled sell-side momentum. Price consistently respected the channel boundaries, producing lower highs and lower lows until a decisive breakdown occurred near the lower channel edge. After this breakdown, Bitcoin reached a clear Pivot Point, where sellers began to lose control and buyers stepped in aggressively. This reaction marked the end of the bearish impulse and initiated a structural shift. From this pivot low, price started forming higher lows, signaling the emergence of demand and the beginning of a recovery phase.
Currently, BTC broke above local resistance and entered a Range phase, where price consolidated between the 88,000 Demand Zone and the 92,500 Supply Zone. Multiple breakout attempts occurred inside this range, confirming active participation from both buyers and sellers. However, each dip toward the demand area was quickly absorbed, showing strong buyer interest and defense of the lower boundary. A rising Demand Line formed beneath price, reinforcing bullish pressure and supporting higher lows within the range. This structure indicates accumulation rather than distribution, suggesting preparation for a directional move.
My primary scenario is bullish as long as BTCUSDT holds above the 88,000 Demand Zone and continues respecting the ascending demand line. The recent pullback into demand appears corrective rather than impulsive, favoring continuation to the upside. I expect price to push back toward the 92,500 Resistance, which represents the upper boundary of the range and a key decision level. A clean breakout and acceptance above 92,500 would confirm bullish continuation and open the path for further upside expansion. Manage your risk!

BTCUSDT – Chart Update (4H)BTCUSDT – Chart Update (4H)
BTC is respecting the rising trendline but facing strong resistance near 87.5K–88K.
The current structure suggests a weak bounce, with sellers still active at resistance.
Below 87.5K: Risk of pullback towards 85.5K → 84.5K support
Above 88K (hold): Trend continuation towards 90K+
For now, this is a make-or-break zone — wait for confirmation before bias.
DYOR | NFA.

BTC/USDT | Tests ahead! (READ THE CAPTION)As you can see, the BTC is ranging between the Demand zone and IFVG. BTC dropped to the mean threshold of the demand zone before going back up to the low of the FVG, at $88,350 level, then again dropping to the high of the Demand zone, at $86,680 level.
At the moment, BTC doesn't seem to be making any meaningful movements. If BTC fails to bounce back from the Demand zone and goes lower, a drop to 80,955, the high of the Bullish OB is likely to happen.
If BTC manages to bounce back up and go through the IFVG, it can go up all the way to the low of 4H FVG at 94,515 to challenge it once more.

BTC – Weak Rebound Below EMAs, Bias Still Toward CorrectionHello everyone, Domic here.
Looking at BTC on the H4 timeframe right now, the overall feeling is not panic — but there is certainly nothing reassuring either. Price is trading around 85,700 USD, sitting firmly below both the EMA34 and EMA89, and that alone already says a lot about the current market condition.
Since mid-month, a lower high – lower low structure has become fairly clear. The rebound we are seeing at the moment is essentially just a technical pullback after the prior sharp sell-off, as price attempts to climb back up and retest resistance. However, BTC has still failed to reclaim the EMA34, which shows that buying pressure is not strong enough to regain short-term control. At this stage, EMA34 acts as an overhead pressure ceiling, while EMA89 remains the key boundary defining the H4 trend. As long as price stays below both of these moving averages, the market should still be viewed from a defensive perspective.
On the macro and news side, BTC is not being driven by any crypto-specific shock, but rather by broader macro conditions and the risk-on / risk-off environment. The Fed continues to signal higher rates for longer, making it difficult for risk assets to attract fresh inflows. US Treasury yields remain elevated, pushing short-term capital toward the USD and bonds instead of crypto. US equities are undergoing a mild correction, and BTC, at this stage, is still moving quite in sync with the broader risk asset complex. In addition, inflows into spot Bitcoin ETFs have cooled significantly compared to the earlier surge, further weakening the price support.
From my perspective, as long as BTC remains below the EMA34, any upward move should still be treated as a rebound into resistance. And while price stays below the EMA89, the H4 trend remains in a corrective state.

BTCUSD: weak oscillating patternToday, BTCUSD has extended its correction trend that started in October, exhibiting a weak oscillating pattern. Prices have been range-bound around the core zone of $85,000–$86,000. Following the flash crash after the price challenged the $90,000 level, the pair is now lingering near the critical support at $85,000, with bears firmly in control of the market.
Support Levels:
$85,000 serves as the current core lifeline. This level corresponds to the 0.786 Fibonacci retracement of the uptrend that began in April. A daily close below this threshold will most likely trigger a new round of panic selling, opening the door to the next support zone of $78,000–$80,000. In the short term, a weak support has formed around $86,000, though its effectiveness has already been undermined. From the perspective of the daily EMA indicator, $85,000 also coincides with the EMA 400 level, further underscoring its significance as a support level.
Resistance Levels:
For any short-term rebound, the primary resistance zone lies at $87,000–$88,000, with $87,200 and $87,500 as key intraday resistance points. Stronger resistance is concentrated at $91,000 (the midpoint of the previous consolidation phase) and $94,700. Additionally, the descending trend line from the October high has formed a robust resistance barrier. Without the support of large-scale spot buying, it will be difficult for any rebound to break through these levels.
Trading Strategy:
Sell 86500–87000
SL 87500
TP 85000 - 84000 - 83000
Buy 85000 - 85200
SL 84500
TP 86000 - 86500 - 87000

BTCUSDT - Intraday Long From Demand Zone?Alright traders, here’s a clean intraday idea — no moon talk, no hopium overdose, just logic.
BTC is currently chilling in a sideways range between 85k–90k after the recent correction.
On-chain and bull-market indicators are still far from anything euphoric, so no signs of a cycle top panic just yet.
Also worth noting:
Yesterday we saw strong ETF inflows (~457M USD), which fits nicely into the classic
“buy the dip, ask questions later” narrative.
Now the fun part — liquidity.
Coinglass is showing:
• long liquidity stacked below around 84–85k
• heavy short liquidity above in the 89–92k zone, especially near 92–93k
Which gives us the classic scenario:
👉 flush a bit lower
👉 grab liquidity
👉 squeeze higher into the short cluster
⸻
The Plan (Simple and Clean)
I’m looking for a long from the demand zone around 85–86k.
• Entry (limit): 85,700
• Stop loss: 84,700
(clean break below = likely move toward deeper 82k liquidity)
• Target: 89,300
(first liquidity pocket below 90k)
That gives us a very decent R:R around 1:3.5+, which is exactly what we want for intraday trades.
This is purely a range mean-reversion play inside the 85–90k box, especially ahead of important macro data.
⸻
Important Rules (No Exceptions)
• Limit order is valid only until 14:30 CET
• If it doesn’t fill before macro → cancel the order
• No averaging below 85k
• Stop loss is respected, no hero trading
This is an intraday idea, not a marriage proposal.
⸻
BTC does BTC things, macros do macro things, and liquidity does what it always does.
Let’s see if the market plays the script this time.
Trade safe, manage risk, and let the range do the work 📊🚀

BTCUSD Supply Zone Rejection | Bearish Continuation SetupBTCUSD rejected from supply zone and broke the ascending channel. Bearish momentum suggests a move toward lower demand areas.Risk Management (Very Important)

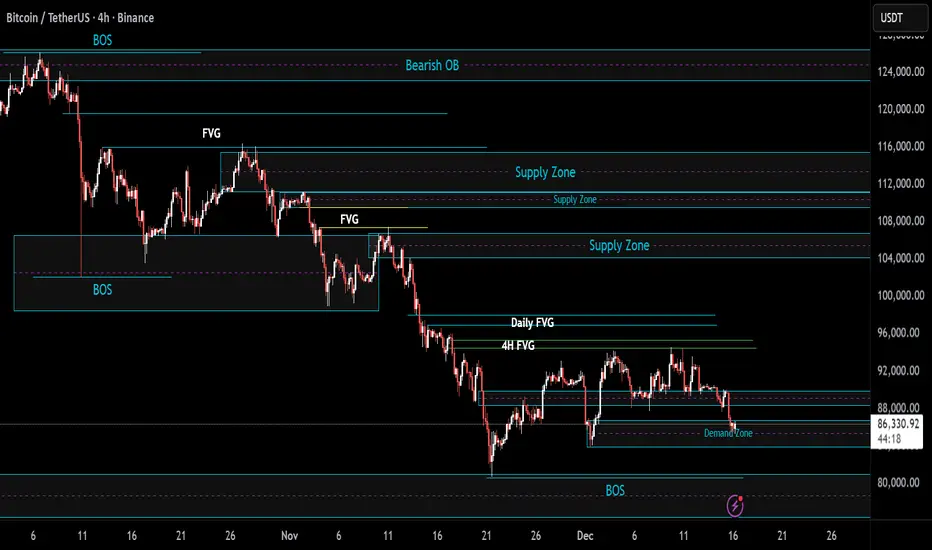
BTCUSDT Review December 17 2025Short-term price movement ideas.
Price has tested the weekly area of interest, from which we received confirmation on the daily chart in the form of a BtS. The daily zone has already been tested, and we also have confirmation in the 4H FVG, where price is currently trading. After the test of the 4H FVG, we observed volume on the 1H timeframe in the form of an FVG. If this 1H FVG is confirmed, a short position can be considered. If not, we should expect a manipulation of the 4H high followed by confirmation on the 1H timeframe.
Be flexible, adapt to the market, and the results will come quickly. Good luck to everyone.


BTC/USDT 4-hour short chart update!!Price is reacting at the rising trendline support.
Holding above 84.5K keeps the bullish structure intact; a breakdown may bring further downside.
DYOR | NFA.

Bitcoin BTC price analysis📊 US macro data has been updated — and CRYPTOCAP:BTC reacted with a bounce to the upside.
Altcoins, meanwhile, still look confused, as if they don’t know where to run yet 🤷♂️
😨 Fear & Greed Index: 11.
That’s extreme fear — and historically, such levels often mark zones where a gradual recovery can begin. Possibly even starting tomorrow.
📈 Overall, the OKX:BTCUSDT price action in 2025 looks very similar to #Bitcoin ’s behavior in 2021–2022.
We really want to believe we’re already in “Phase 2” of this fractal.
Because if this is still “Phase 1”, history suggests a scenario like:
➡️ first $103,000 BTC,
➡️ then potentially a deeper move toward $53,000.
🤔 What do you think — are we already transitioning into recovery, or is another painful leg still ahead?
______________
◆ Follow us ❤️ for daily crypto insights & updates!
🚀 Don’t miss out on important market moves
🧠 DYOR | This is not financial advice, just thinking out loud

here's how bitcoin reaches 185k part 2.good morning,
in my last btc post i promised you my macro btc analysis if the post reached 5 likes,
so here you are.
---
the count is extremely simple;
from the 2022 bear market lows, btc has come up quite impulsively.
i label the entire leg from september 2023 -> october 2025 as a wave (3).
if you look closely, none of the waves overlap in this leg.
sure it might have an unconventional look, but it's not invalid by any technical standards.
---
if i'm correct with my analysis, wave (5) should see an equal appreciation as the length of wave (1) - could become slightly longer, too. usually in cases such as this, you can measure the distance of wave (1) and project it out from the bottom of wave (4);
> look for 100.00% - 123.60% - 161.80% extensions.
this puts the average upside target between 161k - 248k
---
we have had a sustained reading of extreme fear almost all month.
btc is at the bottom of the bullish pitchfork.
most people have given up hope. (bullish contrarian signal)
business cycle has yet to top.
fed man stopped quantitative tightening and has hinted at a balance sheet expansion.
aggressive rate cuts.
monthly hidden bullish divergence present between wave (2) and wave (4) pivot lows.
we are flipping previous cycle highs into support (horizontal support).
bitcoin capitulation metric has hit an all time high this cycle (each one has marked a major low).
---
all of this leads me to believe that we are not finished with the current bull trend.
---
🎯 = 185k
BTC Trade Set Up Dec 16 2025I am expecting a continuation of the bearish trend especially if price respects this 4h FVG. The target is demand and lower SSL

Bitcoin Short-Term Long Opportunity - Trade #2BTCUSDT is oversold on the 4H chart. We're trading the retracement towards the resistance of the trend. The situation hasn't changed - we're short in the bigger picture and expect lower lows within the next few weeks. The surprises will occur in the direction of the trend. Keep that in mind while taking this trade. We're relying on technicals, not on fundamentals. The algos will take care of it until macroeconomics takes over again.
Limit-Buy (Long): 86,500
Stop-Loss: 84,700
Target: 91,200
Leverage: 7x
Be prepared. Use limit orders (less fees) and place the orders beforehand. You don't want to time the market, since you won't be awake 24/7.
Good luck!

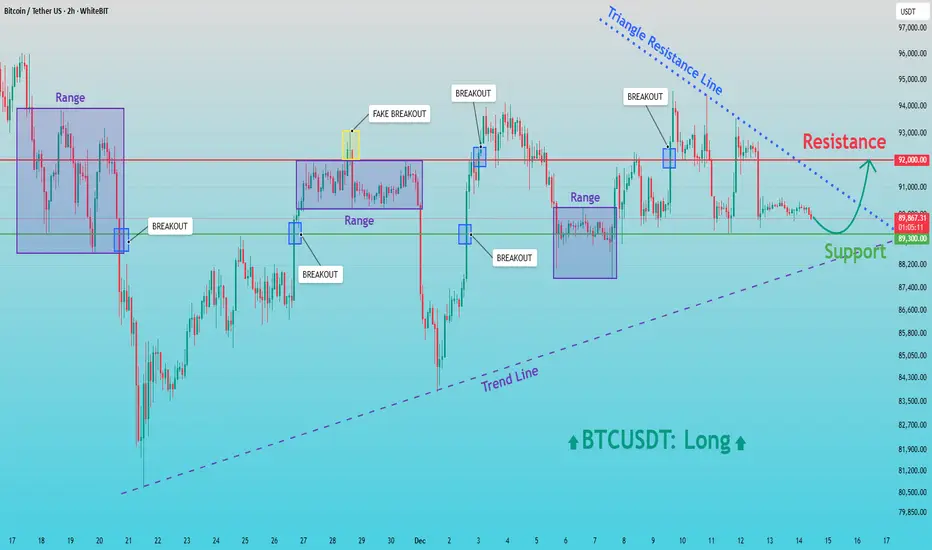
BTCUSD: Buyers in Control - Resistance Retest AheadHello everyone, here is my breakdown of the current BTCUSDT setup.
Market Analysis
BTCUSDT is currently trading within a broadly bullish structure, supported by a rising trend line that has been respected after the major sell-off and subsequent recovery. Following the strong decline, price formed a base near the lower levels and initiated a reversal, creating higher lows and shifting market control back to buyers. After the initial rebound, Bitcoin entered multiple Range phases, where price consolidated and built liquidity. Each range was followed by a breakout, confirming sustained buying interest. Some of these moves included fake breakouts, which briefly trapped participants before price continued to respect the broader bullish structure.
Currently, BTCUSDT is holding above the key Support Zone around 89,300, which has repeatedly acted as a demand area. Price is also compressing under a descending Triangle Resistance Line, while the rising trend line continues to support the market from below. This creates a tightening structure, suggesting that a decisive move is approaching. The 92,000 Resistance level remains the main barrier overhead, where sellers have previously stepped in and rejected higher prices.
My Scenario & Strategy
My scenario remains bullish as long as BTCUSDT holds above the 89,300 Support Zone and continues to respect the ascending trend line. I expect buyers to defend this area and gradually build pressure toward the upper resistance. A clean breakout above the 92,000 Resistance, especially with strong momentum, would confirm bullish continuation and open the path for a move toward higher levels, aligned with the broader trend.
However, if price fails to break the triangle resistance and loses the 89,300 Support, a deeper pullback toward the trend line could occur before buyers attempt another recovery. Until such a breakdown happens, the structure favors buyers. For now, the market remains constructive, with support holding and resistance at 92,000 as the key level to watch.
That’s the setup I’m tracking. Thank you for your attention, and always manage your risk.
Is $50 oil in the offing? Yes, definitely.Hi my dears
According to the current policies, we should see oil prices fall to the $50 range. Of course, technically, the important $55 level is being broken, which makes this possible.
What do you think?

Bitcoin in a correction - stabilization after a bearish impulseBitcoin is not moving in a clen trend, but rather in a corrective structure. The candles are relatively small, with visible wicks on both sides, which reflects hesitation and an ongoing balance fight between buyers and sellers. The most recent candles after the sharp sell-off suggest stabilization rather than an immediate reversal. There is no strong, impulsive bullish candle closing near the highs, which would normally signal clear directional intent.
Decline produced several candles with long lower wicks. This usually points to localized buying interest and defensive behavior around key levels, but it is not yet a textbook reversal pattern such as a hammer or bullish engulfing. On the way down, bearish candles closed relatively low, confirming that selling pressure was genuine and not just a liquidity sweep. At this stage, the candles speak more about absorption than about a confirmed trend change.
Price has moved into classic reaction zones, including the 0.382–0.5 retracement of the prior upside leg. These areas often act as balance zones where price either consolidates or builds a base. However, there is no perfectly completed harmonic structure like a clean ABCD with strong counter-momentum, which again supports the idea of accumulation rather than an aggressive reversal.
The WWV adds an important layer. Volume expanded mainly during the sell-off, but there was no explosive spike that would suggest panic or capitulation. This looks more like controlled distribution or a methodical move lower to collect liquidity. Recently, volume has started to fade, which often precedes range-bound behavior or a short-term technical bounce.
Bitcoin has completed a strong bearish impulse and is now sitting in a potential stabilization zone. Candles suggest caution, volume suggests waiting, momentum shows exhaustion but not reversal, and the table confirms a neutral-to-defensive market state. The market is asking for patience. The next meaningful move will be defined by how price reacts to nearby levels and whether momentum and volume start to align in one clear direction.

Bitcoin Pullback to Resistance — Next Drop Loading?As I expected , Bitcoin( BINANCE:BTCUSDT ) has begun its decline from the resistance zone($94,850-$93,000) and has reached its target.
Currently, Bitcoin is moving near the resistance zone($90,900-$90,100), the Cumulative Short Liquidation Leverage($91,840-$90,110), and other resistance lines.
From an Elliott Wave perspective, it appears that Bitcoin has completed its five-wave downward sequence and is now in the process of forming the corrective waves upward, likely within the resistance zone($90,900-$90,100).
Moreover, since the USDT.D% ( CRYPTOCAP:USDT.D ) has successfully broken the upper line of its falling wedge pattern, we can anticipate further increases in USDT.D%, which could put additional downward pressure on Bitcoin.
Additionally, considering that the S&P 500 index( SP:SPX ) is likely to resume a bearish trend, and given Bitcoin’s correlation with the SPX, a further decline in Bitcoin is not unexpected.
In conclusion, based on the above analysis, I expect that Bitcoin will at least test the support lines and, if those are broken, it may continue to decline toward the Cumulative Long Liquidation Leverage($87,000-$85,663). If the momentum of breaking these support lines is strong, we can expect even more significant downward movement.
Do you think Bitcoin can go below $87,000?
First Target: Support lines
Second Target: Cumulative Long Liquidation Leverage($87,000-$85,663)
Stop Loss(SL): $92,000(Worst)
Points may shift as the market evolves
💡 Please respect each other's opinions and express agreement or disagreement politely.
📌Bitcoin Analysis (BTCUSDT), 1-hour time frame.
🛑 Always set a Stop Loss(SL) for every position you open.
✅ This is just my idea; I’d love to see your thoughts too!
🔥 If you find it helpful, please BOOST this post and share it with your friends.

BTC/USDT | Bears in control? (READ THE CAPTION)Good day folks, hope you're doing okay.
As you can see and I previously mentioned, BTC dropped to the demand zone and now it's being traded at 86,560 level.
However, it is yet to break out of the demand zone, if it fails to do so, a drop to the low of the demand zone at 83,860 is possible. If it goes up, it'll be met by the FVG at 88,350.
BTCUSDT – Downtrend - The Market Enters a Critical TestBitcoin is losing bullish momentum and gradually shifting into a phase dominated by selling pressure. After multiple failed recovery attempts, BTCUSDT is showing clear signs of buyer fatigue as short-term capital pulls back and risk-off sentiment spreads across the market.
From a market context perspective, caution is prevailing as investors wait for key U.S. economic data. The U.S. dollar is showing signs of recovery, while Treasury yields stabilize, reducing the appeal of risk assets like Bitcoin in the short term. As a result, speculative flows have become more defensive.
On the price chart, the short-term bullish structure has been broken. Bitcoin continues to form lower highs, signaling that sellers are taking control of price action. Recent rebounds are weak and purely technical, quickly met with selling pressure—typical behavior during the early stages of a developing downtrend.
Notably, key support zones below are being gradually eroded. A clear break of these levels could trigger stop-loss cascades, accelerating the downside move. In this environment, attempting to catch the bottom carries significant risk.
From a trader’s perspective, selling on pullbacks remains the preferred strategy. Trading in alignment with the prevailing trend, maintaining strict risk management.

Does this look bullish to you? Limit Sell (Short): 93,400
Stop Loss: 95,200
Target: 83,700
Leverage: 7x
Good Luck!

BTCUSDT – 4H Quick Update:
BTC has slipped below the rising trendline and is now testing the 85.9K–84.5K support level.
A strong hold here could see the price bounce back towards 87.5K–88K, while a breakdown could extend the decline to 82.2K.
DYOR | NFA.
