BTCUSD: hold a bullish viewThe current price is around 112700, up 0.17% from the previous trading day. It has fluctuated within the 111000 - 113300 range in the past 24 hours, showing a narrow - range consolidation trend. However, it has not yet broken below the 111000 support level, so we still hold a bullish view. That said, the market is currently in a phase of game between "institutional accumulation and short - term caution"—do not blindly chase the upside.
Buy 112000 - 112500
TP 113000 - 113500 -114000
Daily-updated accurate signals are at your disposal. If you run into any problems while trading, these signals serve as a reliable reference—don’t hesitate to use them! I truly hope they bring you significant assistance
BTCUSDT

TradeCityPro | Bitcoin Daily Analysis #179👋 Welcome to TradeCity Pro!
Let’s move on to Bitcoin analysis. After a few days, it’s time to resume our updates.
⌛️ 4-Hour Timeframe
After breaking the 116,960 zone, Bitcoin failed to hold above it and the upward move turned out to be a fake breakout.
⚡️ Following that, a corrective move began. After consolidating below 114,819, the price continued its correction down to 111,524.
✔️ So far, the reaction to this level has been positive, with several green candles forming off this support.
🔑 However, the key point is that volume hasn’t increased, which is not a good sign for buyers.
🔍 If 111,524 breaks, the downtrend could extend toward the main support floor below.
💥 On the other hand, if price manages to create higher highs and higher lows above 111,524 and volume starts to pick up, a confirmed close above 114,819 could offer a long entry setup.
📈 A breakout of 116,960 will remain the primary long trigger. A clean break above that level will confirm the start of a new bullish leg.
❌ Disclaimer ❌
Trading futures is highly risky and dangerous. If you're not an expert, these triggers may not be suitable for you. You should first learn risk and capital management. You can also use the educational content from this channel.
Finally, these triggers reflect my personal opinions on price action, and the market may move completely against this analysis. So, do your own research before opening any position.

Will Tesla's stock price reach $600? Yes!
Hi my dears
I am at your service with Tesla stock analysis. This year and the following years, the stock growth trend will continue.
If you want to make big profits from the market, just follow my analysis.

Big profit on EURNZD? Are you ready?
Hi dears
I am at your service with my EUR NZD analysis. This year is the year of growth of the Euro currency and it seems that this trend will continue to grow.
If you want to make big profits from the market, just follow my analysis.

How to Avoid Bear and Bull Traps When Trading BitcoinWhen trading Bitcoin (BTCUSDT), you’ve probably heard of terms like Bear Trap and Bull Trap. These are traps that the market sets to deceive us, causing us to make wrong decisions and suffer losses. Let’s explore how to identify and avoid these traps.
1. What are Bear Trap and Bull Trap?
Bear Trap: This occurs when Bitcoin's price drops significantly, leading us to believe that a downtrend has begun, so we sell. But then, the price suddenly rises sharply. The result? We sell at the wrong time and miss out on potential profits.
Bull Trap: On the other hand, a Bull Trap happens when Bitcoin's price surges, making us think that an uptrend will continue, so we buy. But then, the price reverses and drops sharply, causing us to lose money by buying too early.
2. How to Identify Bear Trap and Bull Trap
Bear Trap: When the price drops but without strong trading volume, and RSI is in the oversold region, but the price does not continue to fall.
Bull Trap: When the price rises but trading volume does not follow suit, and RSI is overbought, but the price fails to maintain the uptrend.
3. How to Avoid Falling Into These Traps
Use Stop-Loss: Set stop-loss orders at key support and resistance levels to protect your account if the market moves against your expectations.
RSI: Use RSI to identify when the market is overbought (Bull Trap) or oversold (Bear Trap), helping you make better decisions.
EMA: Use moving averages like EMA 50 and EMA 200 to determine the main market trend and avoid being misled by “false moves”."
Bitcoin Analysis On Lower TimFrameBitcoin’s movement has truly become complex and trendless, and the drops are not happening with momentum. It’s worth taking a look at Bitcoin’s moves on the lower timeframes.
For opening a short position, we need to wait for the red-marked zone.
If the price reaches the red zone and we enter a position, we will not exit our short position in the green-marked zone, and in this analysis, we are not looking for long trades.
For risk management, please don't forget stop loss and capital management
Comment if you have any questions
Thank You
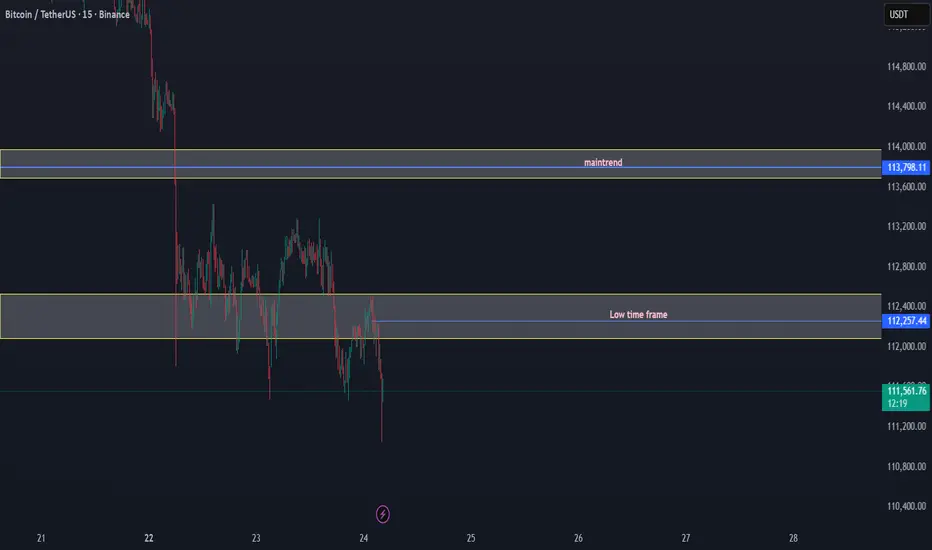
BTC/USDT Breakdown: Loss of Key Levels Confirms Bearish Structur📉 BTC/USDT Market Update
Bitcoin has broken down key structural levels, confirming a bearish outlook in the short to mid-term.
✅ Low Time Frame Support Lost: The $112,083 – $112,531 demand zone has failed to hold, indicating that buyers are losing control on lower time frames.
✅ Main Trend Zone Rejected: The $113,798 – $114,000 supply area acted as strong resistance, and BTC was unable to reclaim this key trend level.
✅ Momentum: Current price action shows continuation to the downside, with sellers stepping in aggressively after repeated failed attempts to sustain higher levels.
Bias: Bearish
As long as BTC trades below $113,800, the market structure favors sellers. Further downside pressure may target the $111,000 – $110,800 range in the near term.
⚠️ Key Levels to Watch:
Resistance: $113,800 – $114,000 (Main trend rejection zone)
Support: $111,000 – $110,800 (Next liquidity pool)
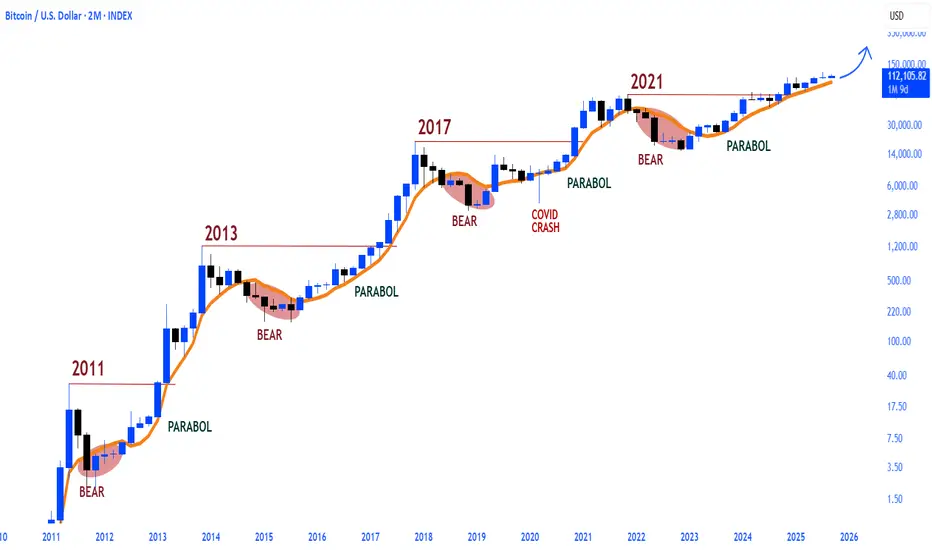
Bitcoin top not is in.Bitcoin has continued its run as long as it remained above the MA7 on a cycle basis, and it is still above it at present.
CRYPTOCAP:BTC ⤴️
Bitcoin Reward – Bullish Thieves or Bearish Bandits?🚨💰 BTC/USD "Bitcoin vs U.S. Dollar" Crypto Market Grand Heist Plan 🎭🚨
🕵️♂️ Dear Thief OG’s, Money Makers & Market Bandits 💎💰
It’s time to lock & load the Bitcoin Heist Plan with both sides of the robbery open (Bullish & Bearish)! ⚡
🔑 Entry Zones (Where the Robbery Begins)
📉 Bearish Bandits: Any price level! Rob the upside liquidity & run it down!
📈 Bullish Thieves: Pullback entry 108,000.0 and above – sneak in with style & power.
🛑 Stop Loss (Escape Route)
🔒 For Bullish: Thief SL @ 105,000.0 🚨
⚠️ Reminder, OG’s: Adjust your SL with your own strategy & risk plan. Don’t get caught by the market police 👮♂️💥.
🎯 Target (The Loot Bag)
🏆 Bullish Robbery Target: 124,000.0 💸
🏴☠️ Bearish Robbery Targets:
1️⃣ 110,000.0
2️⃣ 104,000.0
📜 Thief’s Market Note
This isn’t just a trade, it’s a crypto robbery blueprint – choose your side, Bullish or Bearish, and execute like a true Thief Trader. Always plan your entries in layers, stack the loot, and manage your risk like a pro bandit. ⚡💼
🔥💥 If you love the heist style, Boost this idea 💥🔥
Every boost adds fuel to the Thief Trading Crew 🚀💎.
Stay alert, stay sharp, and remember… the market is the biggest bank, and we are here to rob it! 🤑🎭💰

Continue waiting for a reboundFor BTC, stick to buying low as we suggested yesterday 🐂. As long as the support level between 110000 and 111000 holds 🛡️, we can continue waiting for a rebound 📈
Buy @111000 - 111500
TP 113000 - 113500 -114000
Accurate signals are updated every day 📈 If you encounter any problems during trading, these signals can serve as your reliable guide 🧭 Feel free to refer to them! I sincerely hope they'll be of great help to you 🌟 👇
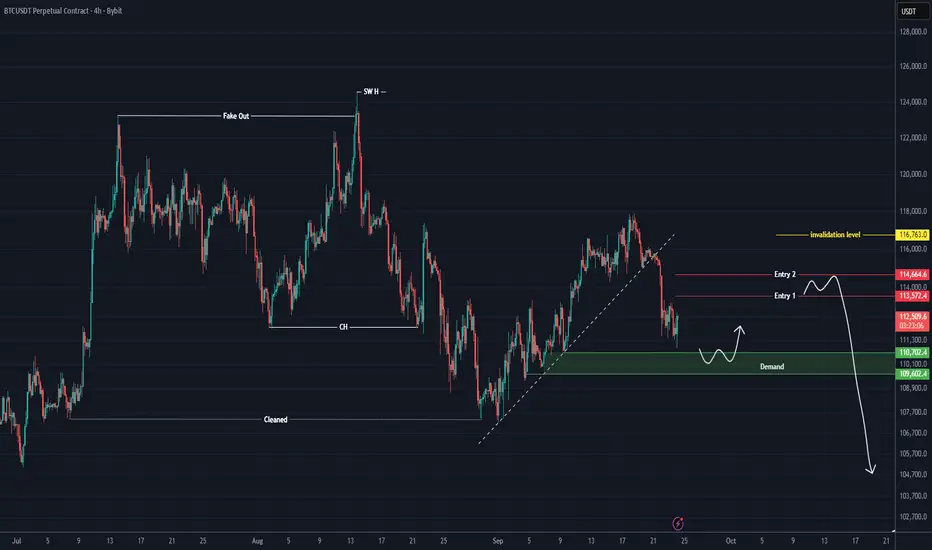
BTC Swing short SetupIf setup failed, then possible btc may form 3 drive pattern n dump again, in this case will share new setup, while not bearish but looking for a good correction, take short with low margin from first setup, n 4% on second setup must use SL on both short setups. Best Of Luck. Don't short any alt coin, wait for btc to retrace these levels and open long for swing setups, will share some good gems, after confirmation

BTCUSDT.P LONGBTCUSDT.P LONG
An uptrend of up to 200 MA is possible in the market
Price: 112,481.10 $
Main target 114069.0 $
SL 109803.0 $

BTC at Crossroads: Next Bullish Leg Loading?📢 NFX COINBASE:BTCUSD Trade Update
In this video analysis, we took a deep dive into the BINANCE:BTCUSD market - what happened, where we are now, and what’s likely to happen next.
📍 OKX:BTCUSD is currently sitting at a key area of interest. While there’s a lot of uncertainty among traders, I believe we’re positioned for the next strong bullish leg up. I shared my detailed thoughts in the video.
💬 Let me know what you think and drop your charts in the comments below.

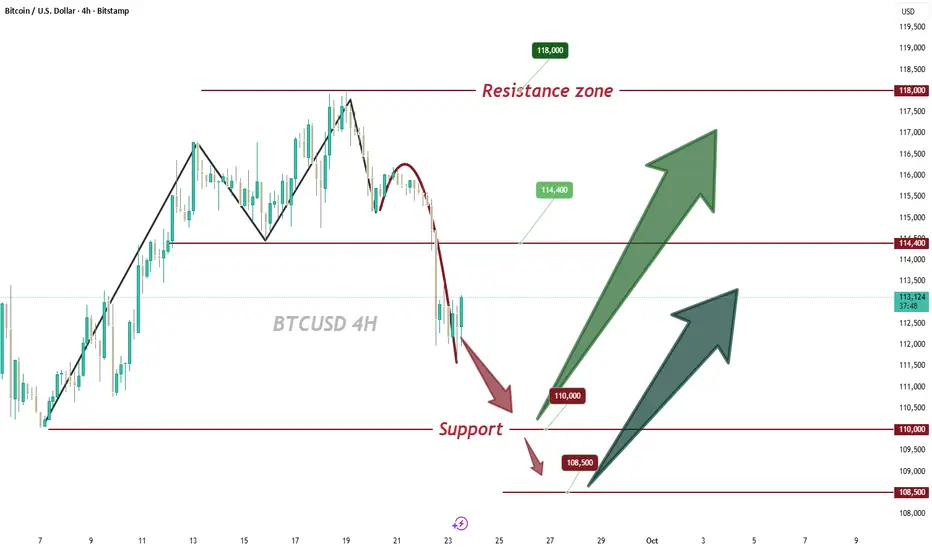
BTC 1H Analysis - Key Triggers Ahead | Day 46👋🏻 Hi, how are you?
❄️ Welcome to the cryptos winter , I hope you’ve started your day well.
Shall we jump into the Bitcoin analysis?
⏰ We’re analyzing BTC on the 1-Hour timeframe.
👀 On the 1-hour timeframe for Bitcoin, we can see that after the recent drop, Bitcoin has formed a trading structure between a resistance and a support zone. A breakout from this structure — either to the upside or downside — could provide a trading opportunity. Currently, Bitcoin is trading near its resistance at $113,146, while holding support around $111,780. A break of either level may trigger the next move.
🧮 Looking at the RSI oscillator, after exiting oversold conditions, it’s now hovering near the 50 zone. Two key RSI levels to watch are 40 and 56; breaking above or below these levels could set the stage for Bitcoin to start moving out of its current structure.
🕯 The candle size and volume have increased when testing the $11,780 support, indicating the presence of buyers. However, the issue is that the number and volume of red candles are still dominant. The key question is whether buyers will step in strongly this time to defend support.
🧠 For positioning, it’s worth keeping a close eye on altcoins such as AVAX, which has shown strong upward momentum and recovered much faster compared to Bitcoin. Recently, Google search trends also indicate stronger interest in altcoins and the broader bull run narrative. That’s why Bitcoin might not be the best option for long-term positions right now. Even if you take a BTC trade, the potential might only extend to reward ratios like 1:2 or 1:3. Instead, focus more on altcoins that are showing bullish trends against Bitcoin.
❤️ Disclaimer : This analysis is purely based on my personal opinion and I only trade if the stated triggers are activated .

SOL/USDT Intra day - Long IdeaBINANCE:SOLUSDT.P is showing a Bullish Divergence, if it breaks out, i am looking for longs :)

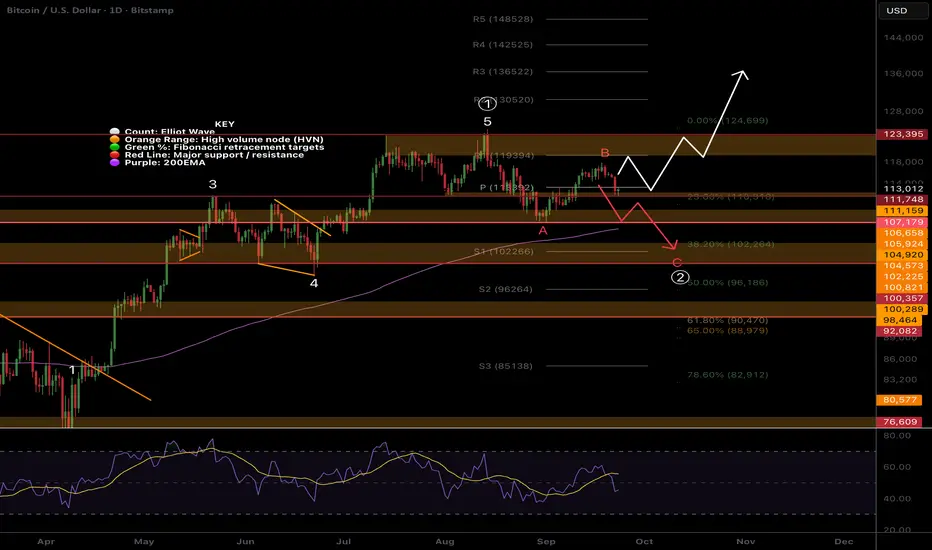
BTC Continues to Range, Lower to come in wave C of 2?Local Analysis / Targets / Elliot Wave
Yesterdays BTC pullback could be wave 2 of 1 terminating with a swing below the daily pivot point straight into the demand High Volume Node. Bulls want to see this move back above the pivot at least today.
Alternatively wave B of the wave (2) pull back could be complete at $117k, wave C has a target of the S1 daily pivot, High Volume Node Support and 0.382 Fibonacci retracement at $102k. This would coincide with a swing below the daily 200EMA and recovery offering a long signal.
RSI is at the EQ and bearishly crossed.
Standard Deviation Band Analysis
Bitcoin standard deviation bands remain the same as price grinds along its upwards trend just above the fair value regression line after testing it as support. Not much to add here, all is normal!
Safe trading
BTC low time frame entering LONG📊 Market update
BTC started at 112.9K with a green uptrend on the lower time frame, suitable for scalp trading. For confirmation of the main trend, BTC should target 114.5K to enter a new uptrend.
⏱️ About altcoins
OG/USDT and JOE/USDT are showing some trend volume.

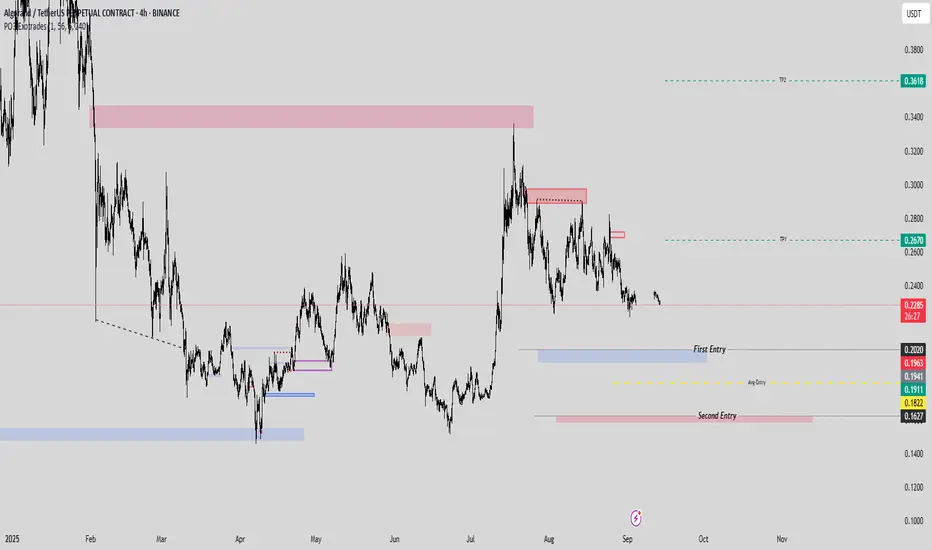
ALGO/USDT Double-Entry Precision Signal with 80% profitHere’s a strategic setup for #ALGOUSDT designed to lock in gains and eliminate downside risk through a two-tiered entry.
- Entry 1: 0.2020
- Entry 2: 0.1627 (purely to reduce overall trade risk; not a profit-seeking leg)
- TP1: 0.2670 (take 50% off the table)
- TP2: 0.1627
---
After TP1 is hit and you’ve secured half your position, shift your stop to breakeven on the remaining size. You can free-risk by moving your stop in the platform or setting a manual alert once 0.2670 is reached. This ensures the rest of the trade carries zero risk while letting profits run.
---
Note: the second entry point isn’t aimed at generating additional profit—it serves solely to widen your safety net and lower the average cost of your position. Trade smart, manage risk, and let the market work in your favor.
BINANCE:ALGOUSDT.P
BTCUSDTHello Traders! 👋
What are your thoughts on BITCOIN?
Bitcoin appears to be moving within a descending channel. Upon reaching the upper boundary of the channel, which coincided with the major resistance zone at 117,000 – 120,000 USDT (and the 61.8% Fibonacci retracement ), the price entered a corrective move.
The short-term ascending trendline has already been broken.
As long as the price stays below 118,000 – 120,000, the correction is likely to continue.
Despite the short-term selling pressure, the medium-term trend remains bullish.
The ongoing correction could serve as a healthy pullback before the larger uptrend resumes.
Don’t forget to like and share your thoughts in the comments! ❤️

BTC Futures market manipulation
Bitcoin sold off today, right after the futures market opened. It could have come down already during the weekend, but it didn’t.
That makes it look like clear futures market manipulation, shaking out weak hands and creating fear so big players can buy from you at lower prices.
Drop looks impulsive, and with no gaps above, there is a riks for more intraday weakness.

BTC 4H Analysis - Key Triggers Ahead | Day 45😃 Hey , how's it going ? Come over here — Winter got something for you!
⏰ We’re analyzing BTC on the 4-Hour timeframe.
👀 On the 4-hour timeframe, Bitcoin formed a lower low followed by a lower high and lost its key support around $115,115 at the start of the new week, pushing price further down. Currently, BTC is testing support at $112,500, and if this level breaks, it could move toward lower supports.
🧮 The RSI oscillator shows that BTC fell below the 40 level toward oversold territory, triggering significant selling pressure. Bitcoin is now attempting to stabilize above the 30 level. If it fails, further downward movement is likely.
🕯 Red candle sizes and volumes have surged sharply at the start of this week, generating considerable FOMO in the market. If a large candle forms, it is likely to be bearish. The key question: will buyers step in to defend Bitcoin at this level?
🧠 Focus on short positions; long positions are removed for now.
A break of the current support could trigger additional short opportunities.
Watch the RSI carefully: if it exits oversold in the higher timeframe, short positions can be opened with more confidence. RSI acts as a multi-timeframe indicator, helping indicate market direction.
❤️ Disclaimer : This analysis is purely based on my personal opinion and I only trade if the stated triggers are activated .

Bitcoin's $1B Liquidation Nightmare—What's Next?Dive into Bitcoin's wild $1B liquidation chaos triggered by Powell's rate speech! From the half-point cut hype to the market's "holy sh*t" moment, I break down the events, lessons on money management, and why doing nothing might be your best move today. Full analysis inside—watch now! If it clicks, give a thumbs up and follow for more crypto insights.

#BTC is plummeting! Will it continue to fall?📊 #BTC is plummeting! Will it continue to fall?
🧠From a structural perspective, the yellow support zone around 115,000 ultimately failed to hold, turning it into resistance. Only by holding above this level can we maintain an optimistic bullish outlook; otherwise, we need to be wary of the risk of a further pullback!
➡️The neckline support failed to hold, so this level will provide weak resistance. Strong resistance lies around 114,000-115,000.
➡️We've currently held above the daily S/R ratio. The next key support level is at the weekly S/R ratio.
🤜If you like my analysis, please like 💖 and share 💬
BITGET:BTCUSDT.P
