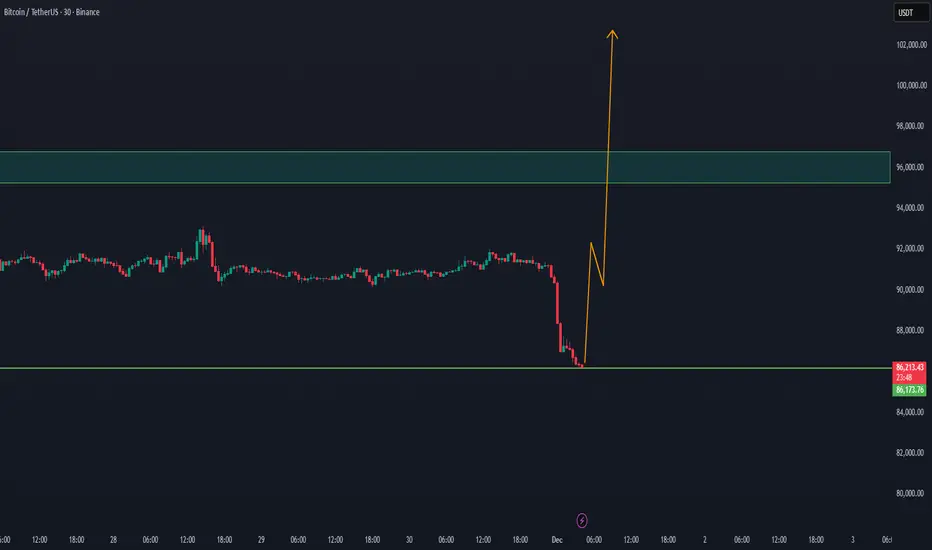
AFTER THE EXPECTED CORRECTION BTC ON WAY TO 100k+WE did expect with the last BTC update that a correction could happen at Bitcoin.
With the new study update, there is a good chance BTC will return step by step to the 100k level
Since the price action, new whale volume can enter BTC.
our previous update with the expectation of BTC fall
BTCUSDT
BTC/USDT 4H Chart 🔍 MARKET STRUCTURE
The chart shows a broad ascending channel in which BTC has been moving for several days:
Lower trend support: ~$87,500 – $88,000
Upper trend line: ~$94,500 – $95,000
The price has clearly rebounded from around $89,200, an important demand level.
📈 KEY LEVELS
Support
USD 89,284 – local support from which a rebound occurred
USD 87,804 – the next, much stronger support level consistent with the trendline
Resistance
USD 91,466 – currently being tested
USD 94,141 – key resistance and the upper band of the channel
📊 CHART SITUATION (4 hours)
1. Price action
The price has made a strong upward impulse from support at USD 89,280.
It is currently reaching local resistance at USD 91,450 – USD 91,700.
If this level is broken, the target is USD 94,000 – USD 94,500.
If it fails, a pullback to USD 90,200/USD 89,300 can be expected.
📉 MACD
Your MACD shows:
Bullish crossover – buy signal.
The histogram changes from red to green → momentum is increasing.
The curves are diverging, confirming the strength of the move.
This indicates that the short-term trend is turning bullish.
📌 TWO TRADING SCENARIOS
🟢 BULLISH Scenario (more likely)
Condition: H4 candle breakout and close above USD 91,700.
Targets:
TP1 → USD 92,800 – USD 93,200
TP2 → USD 94,000 – USD 94,500 (upper channel)
Stop-loss (if you were going long):
below USD 90,500
Safer below USD 89,280
MACD confirms this scenario.
🔴 BEARISH Scenario
Condition: rejection of USD 91,700 and a close below USD 90,500.
Targets:
TP1 → USD 89,300
TP2 → USD 87,800 (key trendline)
A drop to USD 87,800 would be an ideal place for large players to buy again.

BTC/USDT | Another run over 100K? (READ THE CAPTION!)By analysing the 4H BTCUSDT chart, we can see that a fall into the FVG and dropping all the way too $87700, it has reacted positively and is now being traded at $91700!
We shall see if BTC manages to go through the daily FVG, which is the $96900-$98000 zone. If BTC goes over than zone, another run to over $100K is possible!
This analysis will be updated!

A Bearish SentimentHey guys, Bitcoin on the 4H is setting up what looks like a textbook distribution pattern, and I'm leaning bearish here despite the recent bounce off $87,688.
Price is currently trading at $91,332, sitting in a really uncomfortable middle zone. We're above the short-term moving averages (EMA20 at $90,193 and EMA50 at $90,276), which on the surface looks bullish. But here's the problem: we're still firmly rejected below the EMA200 at $93,179, and that level's been acting as a ceiling for multiple sessions now. Every time we push toward $92,900-$93,200, sellers step in hard. That's your primary supply zone, and it's reinforced by the Bollinger Band upper limit at $92,918.
The indicator stack is where things get really interesting. ADX is screaming at 77.1, that's extreme trend strength, folks. But which trend? The MACD is still bearish at -286.85 versus signal at -284.68, telling us the momentum remains to the downside despite this bounce. More importantly, check out the Stochastic at 96.4, that's massively overbought on the 4H timeframe. When you see Stochastic that extended, you're usually near a local top, not the beginning of a rally.
Here's where it gets spicy: the MFI is sitting at just 22.9. Let that sink in. Price is pushing higher, Stochastic is overbought, but money flow is absolutely anemic. That's classic divergence, price going up on declining participation. Smart money's distributing into strength while retail's buying the breakout. I've seen this movie before, and it doesn't end well for late buyers.
Volume analysis supports the bearish thesis. We're running 30% above average at $26,852, which confirms active participation. But notice the wick structure: 18.4% lower wick shows buyers stepped in aggressively, yet we've got a 5.6% upper wick showing sellers immediately absorbed that pressure. In a healthy uptrend, you want to see small upper wicks and strong closes. This candle structure screams exhaustion.
From a structural perspective, we've formed a higher low (bullish), but we haven't confirmed a higher high yet (neutral to bearish). That makes this a potential bear flag rather than a reversal pattern. The Bollinger Bands are telling a similar story, we're trading just above the middle band at $90,391, but we haven't been able to sustain any momentum toward the upper band. That middle band is now acting as resistance rather than support, which is a bearish flip.
Support levels to watch: immediate support sits at the HMA55 around $90,540, then the EMA20 at $90,193. If those break, we're looking at a quick move back to the lower Bollinger Band at $87,864, which aligns with today's low of $87,688. That zone saw significant buying interest earlier, so it should provide a bounce, but if it fails, we could see acceleration toward the $86,200-$85,500 range where weekly support clusters.
Resistance is clearly defined: $92,918 (Bollinger upper), $93,179 (EMA200), and $93,500 (psychological). Any sustained move above $93,200 would invalidate this bearish setup and suggest we're heading for price discovery toward the $95,000 zone. But with current momentum and indicator readings, I'm assigning less than 30% probability to that scenario.
Trading setup: I'm looking at short entries in the $89,800-$90,500 range if we get a lower high formation on the 1H chart. Stop loss goes above $92,500 to give room for a false breakout. Targets are $87,800 (TP1), $86,200 (TP2), and $85,000 (TP3) for the aggressive traders. Risk/reward on this is roughly 1:2.5 to first target, which is acceptable given the confluence of bearish signals.
The internal market state shows bullish bias but only 38.6% directional confidence, that's essentially a coin flip, and when the algos are this uncertain, I fade the recent move. The 6-2 bull-bear stack sounds bullish until you realize that's only 75% agreement, and with ADX this high, we need near-unanimous confirmation for continuation.
Bottom line: this looks like a corrective bounce within a larger downtrend rather than the start of a new leg up. The combination of overbought Stochastic, weak money flow, bearish MACD, and resistance cluster overhead tilts the probabilities toward downside resolution. I'm giving this a 68% confidence bearish call, not slam-dunk territory, but enough edge to take a position with proper risk management.
What are you guys seeing here? Are you fading this bounce or waiting for confirmation above $93,200?

Bitcoin (BTCUSDT) – Intraday Trend & Pattern AnalysisHi!
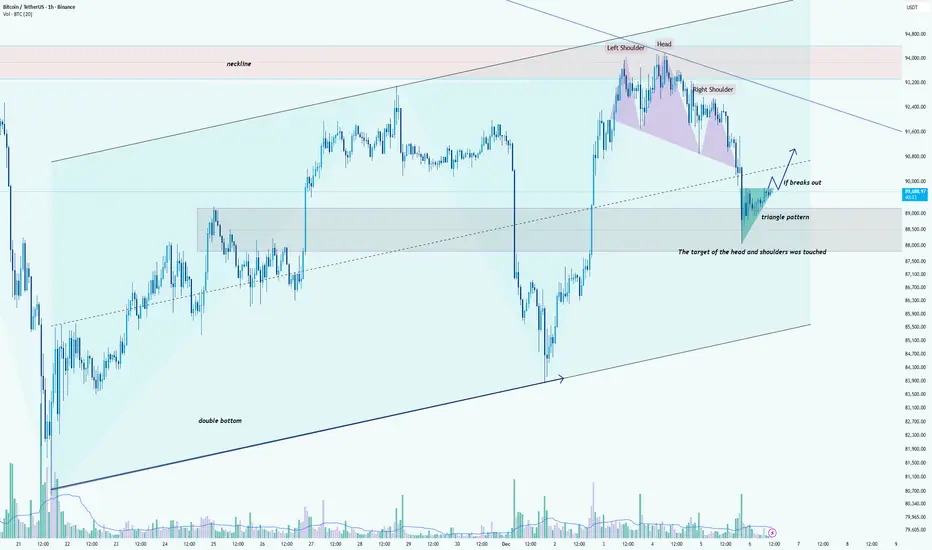
Bitcoin continues to trade within a broader ascending structure, supported by an established rising trendline that has guided price higher over the past weeks. After forming a double bottom near the lower boundary of this channel, BTC initiated a strong rally toward the major resistance zone around 95,000 USDT, where a clear head-and-shoulders reversal pattern appeared. The neckline later broke, and its measured target has already been fully achieved, confirming the pattern’s validity.
Following the completion of this decline, the price stabilized inside the previous consolidation zone and began forming a triangle pattern, signaling compression and potential trend continuation. BTC is now testing the upper boundary of this triangle. A confirmed breakout above the pattern could trigger a bullish continuation toward 90,500–91,200 USDT, aligning with the dashed trendline and short-term resistance levels.
Failure to break upward may lead to a retest of the triangle’s lower boundary or even the broader demand area around 88,000–88,500 USDT, which previously acted as a reaction zone.
Overall, as long as the price remains above the ascending channel’s main support, the medium-term structure favors buyers. A breakout from the triangle will be the key signal for renewed bullish momentum.
Bitcoin Weakness Unfolding – Kijun Break Confirms Bear Bias🚨 BITCOIN (BTC/USD) BEARISH PROFIT PATHWAY 🚨
Hey Traders! 👋 A compelling bearish setup is unfolding on PURPLETRADING:BTCUSD. This swing trade plan leverages a classic Ichimoku signal with a sophisticated entry method for optimal risk distribution.
📉 THE BEARISH THESIS:
The bearish momentum is confirmed by a decisive breakout BELOW the Kijun Sen (Baseline). This indicates a significant shift in medium-term momentum, favoring the sellers.
🎯 MY TRADING PLAN:
Direction: BEARISH 🐻
Style: Swing Trade
Strategy: "The Thief" Layer Entry
⚡ ENTRY STRATEGY (The "Thief" Layer Method):
Instead of one risky entry, we use multiple sell limit orders at key resistance levels. This averages our entry price and builds a position as price moves in our anticipated direction.
Proposed Sell Limit Layers:
Layer 1: 96,000.00 🟥
Layer 2: 94,000.00 🟧
Layer 3: 92,000.00 🟨
Layer 4: 90,000.00 🟩
You can adjust the number of layers and prices based on your capital & risk appetite.
🛑 RISK MANAGEMENT (STOP LOSS):
A safety stop loss is placed above a key resistance zone at 98,000.00.
⚠️ IMPORTANT NOTE: This is MY plan. You MUST adjust your stop loss based on your personal risk tolerance and strategy. Protect your capital!
🎯 PROFIT TARGET (TAKE PROFIT):
Our primary target is 82,000.00, where we expect a confluence of:
Strong Support from the Triangular Moving Average (TriMA).
Oversold Conditions on lower timeframes.
A potential bull trap being sprung.
💡 SMART EXIT TIP: Consider taking partial profits on the way down. You are NOT obligated to hold until the final target. Secure profits according to your own plan!
🔍 RELATED ASSETS & KEY CORRELATIONS:
Watching these related markets can provide confirmation and strengthen the thesis:
TVC:DXY (U.S. Dollar Index): 🟢 A stronger DXY often puts downward pressure on Bitcoin. Watch for bullish momentum in the dollar as a tailwind for this bearish BTC setup.
BITSTAMP:ETHUSD (Ethereum): Crypto majors often move in tandem. If Ethereum shows similar weakness and breaks key supports, it confirms a broader crypto market pullback.
^SPX (S&P 500 Index): In recent years, BTC has shown correlation with risk-on assets. A declining stock market could accelerate the sell-off in Bitcoin.
AMEX:GBTC (Grayscale Bitcoin Trust): Monitor for significant discounts or premiums to NAV, as it can reflect institutional sentiment.
✅ LIKE & FOLLOW if you find this analysis helpful! It helps the algorithm and keeps you updated on my latest market insights. ✅
📣 Let me know your thoughts in the comments! Are you bullish or bearish on Bitcoin here? 👇

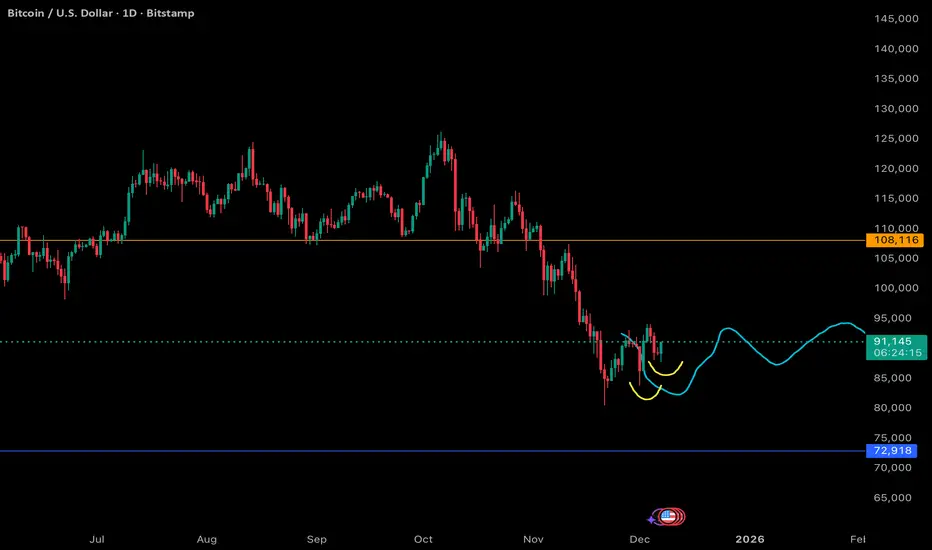
BTC Update: Another Higher Low Forming - Bullish Through the ChoBTC continues to follow the exact pathway laid out by the chop line. Despite the volatility, price action is developing in a very constructive manner. We’ve now carved out another higher low, which reinforces the shift from trending downside into early base-building.
This is classic bullish behavior inside a consolidation phase:
- sellers push into support
- buyers step in earlier each time
- higher lows start stacking
- momentum gradually tilts upward
The yellow curves highlight where demand continues to show up. Each reaction is smoother, less aggressive, and more controlled, which typically reflects accumulation rather than panic-driven selling.
As long as BTC respects this rising structure, the market is quietly strengthening beneath the surface. The chop isn’t noise - it’s the transition pattern you want to see before a larger reversal leg kicks in.
BTC is bullish through the chop, and the structure is tracking perfectly with the projected path.
BTC/USD) Bearish trend analysis Read The captionSMC Trading point update
Technical analysis of Bitcoin (BTC/USDT), showing likely support/resistance zones + moving averages + a projected downside “target.” I think the analysis has merit — but it also carries risks. Here’s a breakdown of what works & what to watch out for:
---
What the analysis does well (strengths)
Use of support and resistance zones: The chart marks a “key support zone / breakout level” and a “resistance level.” That’s textbook technical analysis — horizontal zones where price has previously stalled or reversed tend to work as future decision points.
Dynamic resistance via moving averages: The chart uses EMAs (50 and 200) — those help traders spot trend direction and possible dynamic resistance/support. When price is below a major EMA (like the 200), that EMA often acts as resistance rather than support.
Clear target defined: Having a target around ~$83,783 (as drawn) gives a concrete downside level if the bearish case plays out. This is useful for planning scenarios and risk management.
Logical structure: support → breakdown → target: The idea seems to be that price broke a support zone (or tested and failed), is now below important moving averages — which supports the bearish bias. If support fails, move down toward target. That’s a valid “trend + structure” bearish setup.
---
What to be cautious about (weaknesses / risks / what’s uncertain)
Support/resistance zones are not guarantees: As described in guides for support/resistance — these zones work because many traders place orders there, but price can ignore them, especially under high volatility or news triggers.
EMAs as dynamic resistance/support are probabilistic: While 50-EMA or 200-EMA often act as resistance/support, they are not always respected — especially in volatile crypto markets.
Timeframe & context matter: The chart seems 1-hour, which means the zones and signals are relatively short-term. Levels that look robust on a 1-h chart may dissolve quickly when broader contexts (daily/weekly) shift. Many TA educators stress using multiple timeframes to confirm strong levels.
No certainty of target — market structure can change: The “target point” assumes continuation of bearish momentum. But if price action reverses, or some bullish catalyst emerges, the setup becomes invalid. This is true for any technical projection.
---
What this setup implies — possible scenarios
Bearish scenario (the chart’s base case): Since price is below both EMAs and has recently broken support, BTC could drift toward the projected target around $83,000–$84,000 if downward pressure continues, especially if sellers dominate near EMAs/resistance zones.
Invalidation / bull scenario: If BTC climbs back above the 50 and 200 EMAs, or reclaims a broken support zone, that bearish thesis fails — and price may instead bounce back toward higher resistance. In that case, the target becomes irrelevant.
Choppy / range-bound scenario: Price may hover between the support/resistance / EMA zones, bouncing up/down without reaching the target — which is common in crypto when there’s no strong directional catalyst.
Mr SMC Trading point
---
My view: Reasonable as a probabilistic bearish trade — but not a guarantee
Your chart offers a plausible bearish setup. It makes sense to watch how price interacts with the EMAs and the support/resistance zones. However: because markets are never deterministic, it’s best to treat this as one possible scenario, not a sure bet.
If I were trading this, I’d probably:
Wait for confirmation (e.g. a breakdown + close below support, or rejection at EMA) before committing.
Define risk controls: like where to set a stop-loss (maybe just above the 200-EMA or above recent consolidation), and a realistic profit target as indicated.
Monitor for catalysts (volume spikes, news) — these can up-end technical setups quickly in crypto.
---
Please support boost 🚀 this analysis

$BTC/USDT ANALYSISBitcoin on the 8-hour chart is consolidating within an ascending triangle formation, showing clear higher-low structure support near the rising trendline. The price is currently trading below both the 50-period moving average and the Ichimoku Cloud, which are acting as strong dynamic resistance levels. The highlighted red zone around 92,000–93,500 USDT represents a heavy supply area where previous rejections occurred.
As long as Bitcoin holds above the ascending trendline support near 86,000–86,500 USDT, the structure remains intact, suggesting buyers are still defending this zone. A clear breakout above the 50 MA and the 92,000 USDT resistance region would confirm a bullish continuation toward 95,000 USDT and beyond. However, failure to hold the rising support trendline could trigger a short-term correction toward 84,000 USDT before any recovery attempt.

BTC Consolidating Below a Major Resistance ZoneBitcoin is currently moving within a narrow range while respecting a clear upper resistance zone. Repeated reactions from this level show that it remains an important decision area for market participants.
A strong response from resistance could lead to a deeper pullback toward the lower range area. However, sustained acceptance above this zone may allow price to continue higher. Structure and volume reaction will be key.

BLACK SWAN322 and black swan
i cant tell more all in the chart. My last predict not in TV i predicted 10 october because i have signal from space)

BTC at Critical Support — Bounce or Breakdown?BTC 4H Update
BTC is still moving in a controlled pullback after failing to break the 93,241 resistance. The rejection shows the market continues to respect this supply zone, and price is now hovering just above short-term support.
The key area to watch is the 88,850–89,200 support zone. If BTC can hold this level, a rebound toward 90,193 is likely, followed by another attempt to break the major resistance. A successful breakout would open the path toward the 98k–99.5k zone shown on the chart.
However, if this support breaks, price may slide into the OB 87,670–86,300 or even revisit the 85,650–85,000 support area — the same zone that created the recent higher low. Losing that level would weaken the bullish structure.
For now, structure is still intact, and BTC just needs a clean bounce to maintain upward momentum.

BTCUSDT Long: Buyers Defend 91K Zone – Targeting 96K ExpansionHello, traders! The current BTCUSDT price action is developing within a strongly structured bullish environment after a prolonged decline driven by the Descending Channel. Earlier, the market broke down from the upper supply region and continued to move lower while respecting the descending channel boundaries. After reaching a pivot low near the demand zone around 91,000, buyers stepped in, initiating a reversal and shifting momentum to the upside. Following this, Bitcoin formed a clean Ascending Channel that confirmed growing bullish pressure. Price then entered a Range phase, indicating temporary equilibrium before the next impulsive move. After completing this consolidation, BTCUSDT created a clear Head and Shoulders reversal structure near demand, signaling a strong bullish reversal. Buyers took control and pushed price sharply upward, breaking through the range and reclaiming higher structure levels.
Currently, BTCUSDT is trading inside a new Ascending Channel, steadily climbing toward the 96,000 supply level, where sellers previously reacted. As long as price remains above the 91,000 demand zone and continues to respect the ascending channel structure, the bullish scenario remains valid. The next upside target is the 96,000 resistance area, aligned with the upper channel boundary.
My scenario is a continuation toward 96,000 as long as buyers maintain control of the channel. However, a strong rejection from this supply zone may trigger a corrective pullback back toward demand before buyers attempt another move upward. Manage your risk!

TradeCityPro | Bitcoin Daily Analysis #243👋 Welcome to TradeCity Pro!
Let’s move on to today’s Bitcoin analysis. The market is still ranging because it’s the weekend, but today there is a strong chance of movement.
⏳ 1-Hour Timeframe
After the drop to the 88,890 zone, the market formed a range structure yesterday, and Bitcoin is now preparing for its next move.
✔️ Bitcoin’s volume was very low yesterday (Saturday), and this low volume has continued today as well.
💡 However, since we’ve recently seen New York session volatility on Sundays, today we may also see movement.
💥 With RSI pulling back to the 50 level and failing to stabilize above it, bearish momentum can enter the market.
🧩 If RSI enters the oversold zone, this bearish momentum will increase even more.
🎲 If 88,890 breaks, opening a short position is logical, and the price may move toward 85,818.
⚖️ But today, the market can also give us a long setup.If the 90,022 level breaks, we can look for a long position.
🎯 The next resistance levels for Bitcoin are 91,974 and 93,609.
✨ The most important note for both triggers is VOLUME.The breakout must be supported by increasing volume.
📊 If volume stays this low and doesn’t improve, the probability of fake breakouts increases significantly.
🔭 But if the breakout happens with rising volume, the trend can continue smoothly.
❌ Disclaimer ❌
Trading futures is highly risky and dangerous. If you're not an expert, these triggers may not be suitable for you. You should first learn risk and capital management. You can also use the educational content from this channel.
Finally, these triggers reflect my personal opinions on price action, and the market may move completely against this analysis. So, do your own research before opening any position.

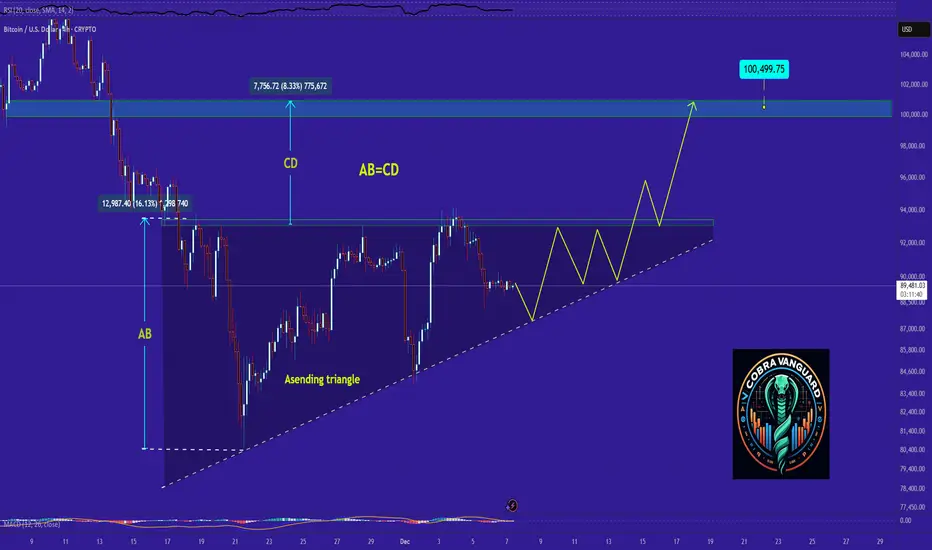
I think the only one Liking my post is me!The price on the 4h timeframe is within an ascending triangle, which can be promising. If the price breaks this pattern with bullish candles, it could easily rise by the distance of AB=CD.
Bitcoin Momentum Building — Bullish Plan Activated!BTC/USDT — “BITCOIN VS TETHER”
Crypto Market Opportunity Blueprint (DAY / SWING Trade) 💹✨
🔥 Plan: Bullish plan confirmed
The structure is supported by a Hull Moving Average (HMA) pullback, behaving like a clean re-accumulation phase — showing buyers quietly loading before the next expansion wave.
This pattern typically appears before trend continuation legs, especially when volatility compresses after a strong impulse.
🎯 Entry
📌 YOU CAN ENTRY AT ANY PRICE LEVEL
(Structure shows strength across multiple levels with buyers defending dips.)
🛡️ Stop Loss
⚠️ This is thief SL @ 86000
Dear Ladies & Gentleman (Thief OG's), adjust your SL based on your own strategy & personal risk tolerance.
🔍 Important:
I am not recommending to use only my SL.
It's your own choice — you can make money then take money based on your own risk.
🎯 Target
Price is moving into a zone where the moving averages act as a strong resistance, combined with overbought conditions and potential trap formation, so escaping with profits is wise.
📌 Our target @ 98000
Again — Dear Ladies & Gentleman (Thief OG's):
I am not recommending to set only my TP.
You can make money then take money at your own risk.
📡 Related Pairs to Watch (Correlations & Key Behaviors)
Below are correlated assets that help confirm BTC/USDT’s flow, momentum, and broader crypto market direction. These are presented in $ format for TradingView tagging.
1️⃣ BINANCE:ETHUSDT (Ethereum)
Strongest beta-pair to Bitcoin.
When BTC shows re-accumulation, ETH often leads the breakout earlier.
If ETH breaks major resistance first → increases confidence in BTC continuation.
2️⃣ BINANCE:SOLUSDT (Solana)
High-momentum asset; reacts faster than BTC.
If SOL pumps aggressively while BTC consolidates → indicates risk-on sentiment across crypto.
Good for measuring market confidence.
3️⃣ BINANCE:BNBUSDT (BNB)
Acts as a market stability indicator.
If BNB stays firm above key moving averages, liquidity remains strong across the crypto market.
Helps confirm medium-term bullish structure.
4️⃣ BINANCE:ETHBTC (Ethereum / Bitcoin Ratio)
A critical relative-strength indicator.
If ETHBTC drops → capital rotates into BTC dominance, supporting your Bitcoin bullish plan.
If ETHBTC rises → broad alts strength, but BTC may not accelerate instantly.
5️⃣ CRYPTOCAP:TOTAL2 (Altcoin Market Cap)
When TOTAL2 rises with BTC → marketwide confidence.
When TOTAL2 stagnates but BTC rises → BTC-only rally (typical before big breakouts).
Useful to detect inflow distribution.
6️⃣ TVC:DXY (US Dollar Index)
Inverse correlation with Bitcoin.
If DXY weakens → supports BTC bullish continuation.
Important for swing traders taking multi-day positions.
7️⃣ CRYPTOCAP:USDT.D (Tether Dominance)
When USDT.D drops → money flowing from stablecoins into crypto.
When USDT.D rises → risk aversion.
Perfect tool for confirming if BTC demand is real.
📈 Summary Insight
Together, BTC’s HMA pullback + re-accumulation structure, rising momentum across correlated pairs, and declining defensive indicators build a high-probability bullish continuation environment for the next expansion wave.

$BTC Floating in an Imbalance ZoneCRYPTOCAP:BTC is sitting inside a mid-range LVN cluster.
Price is around 89.6k, right on the edge of a thin LVN band. This isn’t a high-volume acceptance zone, so there’s no real stability — price is basically floating in an imbalance pocket, and volatility can snap either way.
If we hold above the 89k-88k, we could see a rotation back toward 95–97k to rebalance into the upper LVN.
But if 88k gives out, a quick drop toward 87.5–86.5k is likely. This would be your ideal long sweep zone.
Note: LVNs rarely act as strong support. When they break, the move usually accelerates. The downside magnet becomes the 87–86.5k HVN base — the ideal sweep zone for longs.

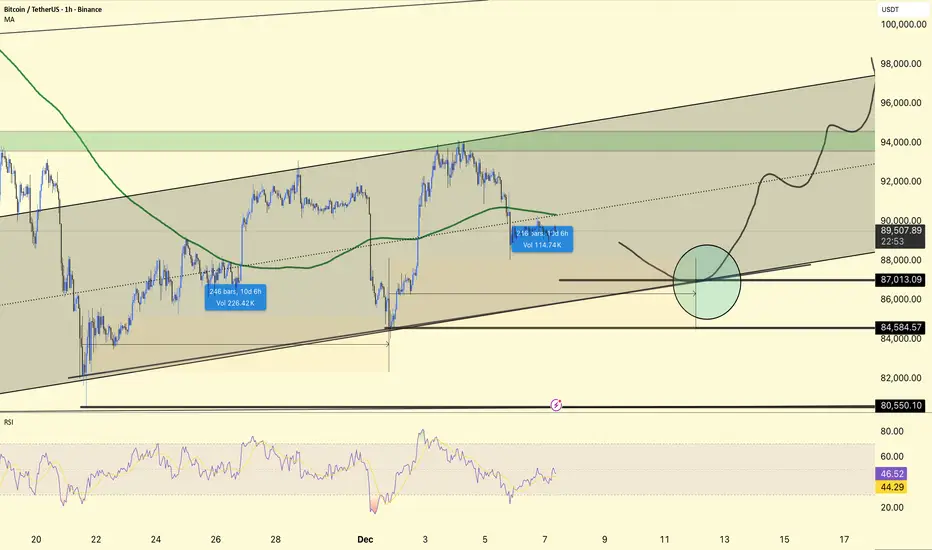
#BTC 4HOUR CHART UOPDATE !!BTCUSDT is still trading within an ascending channel, now pulling back towards the mid-lower portion of the structure after failing to sustain above 90k on the latest push.
The price has rolled over from the upper half of the channel and is heading towards the main confluence zone around 87,000–88,000, where the lower channel line, previous horizontal support, and your marked circle align.
84,584 and 80,550 remain the next downside reference supports; holding above 87k maintains the short-term bullish channel, while a break below 84,584 would increase the risk of a deeper correction towards 80k.
A decline into the 87k area, followed by basing and a continuation back towards 92k–94k, and if buyers defend the channel as drawn, possibly to the 96k–98k channel top.
The RSI is mid-range rather than overbought, so there is room for another leg down or a sharp bounce to test support; using 87k–84.5k as the main invalidation band for aggressive longs fits within the current 4H structure.
DYOR | NFA,
BTC Is Just Hunting Liquidity… AgainI’m watching the mid-range retracement zone (0.5–0.618), which lines up with the previous inefficiency.
If price returns there, it could act as a manipulation window before the next expansion phase.
Until then, market bias stays neutral-to-reactive, not predictive.
Let price tell the story via liquidity grabs and structural confirmation.
If fib golden ratio zone reject the price BTC will go to at least 80k before going deeper.
If price managed to breakout of this zone with multiple strong retests, BTC will go to new ATH.
Good Luck!
If you like our analysis, join our TG group.
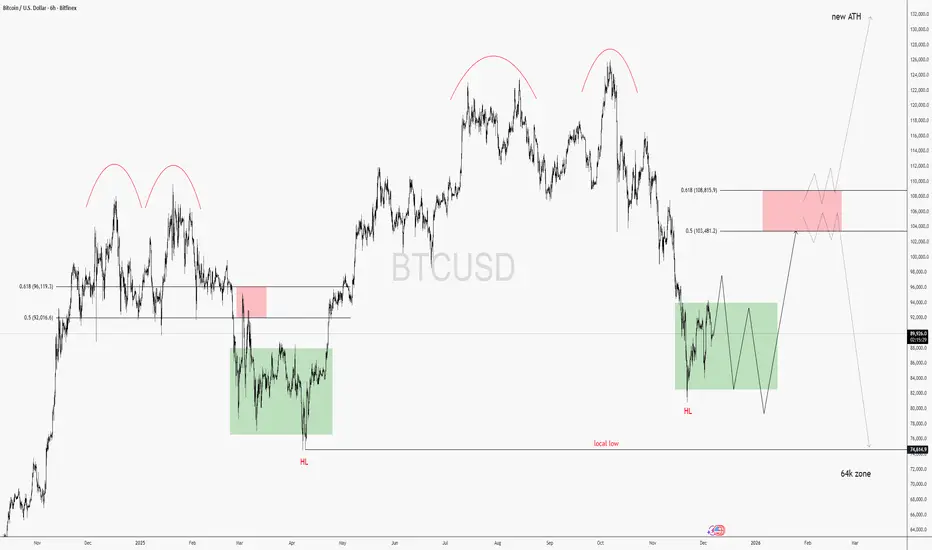
BTC/USDT Weekly AnalysisBitcoin is currently in a corrective phase after a strong weekly sell-off.
Price has a clear Weekly Fair Value Gap (FVG) sitting around the previous weekly high in the 95k–97.5k area.
📌 Technical idea:
Price could retrace back into the weekly FVG to rebalance inefficiency and grab liquidity above the previous weekly high.
After tapping that zone, a bearish reaction is expected.
Final target is the previous weekly low, where major liquidity rests.
📍 Key levels:
Weekly FVG zone: 95,000–97,500
Liquidity grab above previous weekly high
Target: previous weekly low around ~75,000
🎯 Bias: Bearish after mitigation

TradeCityPro | Bitcoin Daily Analysis #242👋 Welcome to TradeCityPro!
Let’s move on to the Bitcoin analysis. Today is Saturday, and after yesterday’s drop, the market is ranging and resting.
⌛️ 1-Hour Timeframe
Yesterday, we saw clear signs of correction and bearish momentum in Bitcoin, and with a sell-off candle, the price dropped to the 89,082 level.
🔭 After reaching this zone, the correction has paused, and Bitcoin is now moving sideways near 89,082.
💥 On the RSI oscillator, we had a descending trendline that RSI respected very well.
✨ Now that this trendline has been broken, RSI is testing the 42.25 resistance level.
⚡️ If RSI breaks above this level, we will have the first signal of bullish momentum returning to Bitcoin.
🎲 If we get that confirmation from RSI, we can then look for a long trigger on the Bitcoin chart itself.
🧩 Once BTC breaks the short-term structure it forms by then, we can open a long position.
🎯 However, since today is Saturday, I personally prefer to wait and avoid opening any trades until the new week starts.
💡 Still, I’ll stay behind the chart, and if the bullish scenario plays out, I will open a long position.
📊 For a short position, we can enter on a break of 89,082, but honestly, many altcoins paired with BTC have much better short triggers right now.
❌ Disclaimer ❌
Trading futures is highly risky and dangerous. If you're not an expert, these triggers may not be suitable for you. You should first learn risk and capital management. You can also use the educational content from this channel.
Finally, these triggers reflect my personal opinions on price action, and the market may move completely against this analysis. So, do your own research before opening any position.

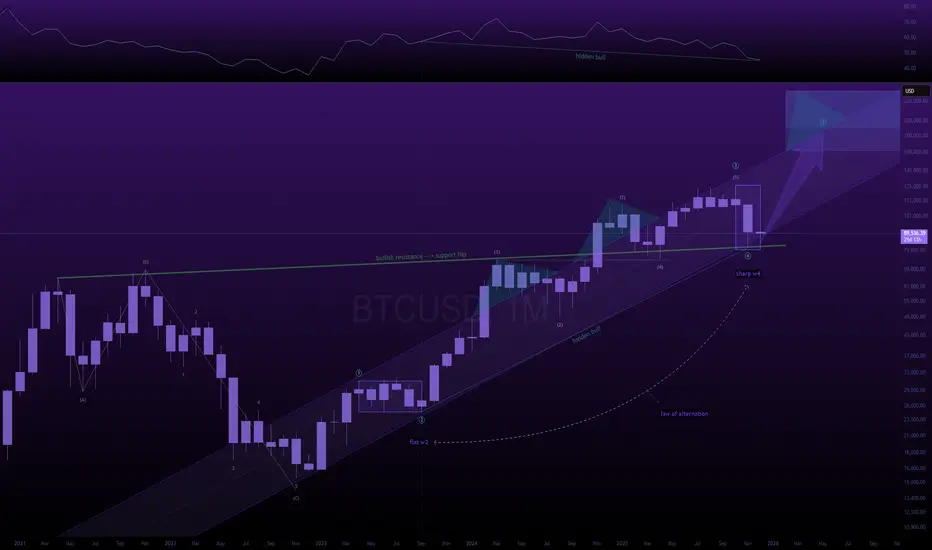
here's how bitcoin reaches 185k part 2.good morning,
in my last btc post i promised you my macro btc analysis if the post reached 5 likes,
so here you are.
---
the count is extremely simple;
from the 2022 bear market lows, btc has come up quite impulsively.
i label the entire leg from september 2023 -> october 2025 as a wave (3).
if you look closely, none of the waves overlap in this leg.
sure it might have an unconventional look, but it's not invalid by any technical standards.
---
if i'm correct with my analysis, wave (5) should see an equal appreciation as the length of wave (1) - could become slightly longer, too. usually in cases such as this, you can measure the distance of wave (1) and project it out from the bottom of wave (4);
> look for 100.00% - 123.60% - 161.80% extensions.
this puts the average upside target between 161k - 248k
---
we have had a sustained reading of extreme fear almost all month.
btc is at the bottom of the bullish pitchfork.
most people have given up hope. (bullish contrarian signal)
business cycle has yet to top.
fed man stopped quantitative tightening and has hinted at a balance sheet expansion.
aggressive rate cuts.
monthly hidden bullish divergence present between wave (2) and wave (4) pivot lows.
we are flipping previous cycle highs into support (horizontal support).
bitcoin capitulation metric has hit an all time high this cycle (each one has marked a major low).
---
all of this leads me to believe that we are not finished with the current bull trend.
---
🎯 = 185k
BTC Wave 4 Bounce Looks Like a Trap! Is it?BTC is still moving inside a clear corrective channel, with the current bounce likely forming wave 4 before one final drop toward the 1.618 extension near 79,650 . The highlighted red zone shows a potential trap area where price may lure traders into thinking a reversal has started. Until BTC breaks above the channel convincingly, the broader structure still favors a wave 5 decline. The wave count from 1–2–3 supports this final leg down before any major recovery.
Stay Tuned!
@Money_Dictators
