BTC 1H Analysis - Key Triggers Ahead | Day 36💀 Hey , how's it going ? Come over here — Satoshi got something for you!
⏰ We’re analyzing BTC on the 1-Hour timeframe.
👀 On the 1-hour timeframe for Bitcoin, we can see that BTC has successfully stabilized above the alarm zone at $111,300 and is now sitting right below the resistance at $112,105. With stronger volume and volatility, this setup could give us a long trade opportunity.
⚙️ Key RSI oscillator levels are at 70 and 50. If price action pushes RSI beyond these levels, Bitcoin can continue its current bullish move and sustain the trend. At the moment, RSI is sitting just below the Overbought threshold, and once it enters this zone, the identified resistance could be broken more easily.
🕯 With the start of the new week, buying volume has increased, and the weekly candle closed fairly strong. On the 1-hour chart, the size, volume, and number of green candles are all rising.
📊 Looking at the 15-minute timeframe of Tether dominance (USDT.D), after breaking and stabilizing below 4.45%, dominance continues to move lower. The next support lies at 4.41%, and if this is broken and confirmed, Bitcoin could see even stronger upside momentum early in the week.
🔔 Currently, Bitcoin is sitting just below its resistance. The best approach is to wait for a pullback, either below or above this level, and then open a position with a setup candle confirmation or a multi-timeframe breakout. Two possible scenarios exist here, where a pullback could also give us a tighter stop-loss opportunity.
❤️ Disclaimer : This analysis is purely based on my personal opinion and I only trade if the stated triggers are activated .
BTCUSDT

BTC Accumulates and Recovers, Rate Cut Near💎 BTC PLAN UPDATE – Early Week (09/08 )
BTC Analysis (D1 timeframe)
Main trend:
BTC is in a recovery phase after breaking out of the downtrend channel (blue).
Currently, the price is hovering around 112K–113K, approaching a key resistance zone.
Key levels:
• Near resistance: 113,590 – 114,124 (confluence of Fib 0.382 and EMA 34).
• Stronger resistance: 116,150 – 117,600.
• Near support: 111,200 (Fib 0.5) and the rising trendline.
• Deeper support: 108,400 – 104,800 (previous lows + Fib 0.618–0.786).
Possible scenarios:
• Scenario 1 (preferred): Price tests resistance at 113,590 → pulls back to 111K–110K → then bounces upward again.
• Scenario 2: If strong buying pushes through 113,590 and holds above 114K, the next target will be 116K–117K.
Overall outlook:
The short-term trend is leaning towards recovery.
However, the 113K–114K resistance zone will determine whether BTC continues higher toward 116K–117K, or drops back to retest supports below 111K.
👉 In summary: BTC is recovering, but 113K–114K is the key zone. A successful breakout could open the way to 116K–117K. A rejection could bring price back to test 111K or even deeper at 108K.

Analytics: Market outlook and forecasts
📈 WHAT HAPPENED?
Last week, Bitcoin reached the first sell zone at $112,400-$113,300 (local volume zone), from which we’ve already received a reaction twice.
During the last test of this zone, a large volume was formed, which was positioned in short. This indicates the potential for a decline to the level of $108,000. On the other hand, the untested liquidity beyond the $113,500 level suggests the opposite and acts as a "magnet" for the price.
Currently, we’re trading within a local range where market sales are being absorbed.
💼 WHAT WILL HAPPEN: OR NOT?
We anticipate a move towards the new zone of $112,200-$113,200 (volume zone), from which a short-term movement is likely to develop if there is a reaction.
The opposite scenario is a strong breakout of this zone during buyer activity. In this case, a test of the $114,400-$115,500 zone (volume zone) and the ~$116,500 level (volume anomaly) is likely.
In this scenario, the $112,200-$113,200 marks will become a mirror volume support zone, and the global long trend will resume.
Buy Zones:
$108,000–$102,500 (accumulated volumes)
Sell Zones:
$112,200–$113,200 (volume zone)
$114,400–$115,500 (volume zone)
~$116,500 (volume anomaly)
$117,200–$119,000 (accumulated volumes)
$121,200–$122,200 (buy absorption)
📰 IMPORTANT DATES
Macroeconomic events this week:
• September 10, Wednesday, 12:30 (UTC) - publication of the US Producer Price Index (PPI) for August;
• September 11, Thursday, 12:15 (UTC) - announcement of the Eurozone deposit rate for September and the Eurozone interest rate decision;
• September 11, Thursday, 12:30 (UTC) — publication of the US basic consumer price index and the number of initial jobless claims for August;
• September 11, Thursday, 12:45 (UTC) — press conference of the European Central Bank (ECB);
• September 12, Friday, 6:00 (UTC) — publication of the UK GDP for July and the German consumer price index for August.
*This post is not a financial recommendation. Make decisions based on your own experience.
#analytics

Bitcoin Targets $116K or $104K Post-CPIMy main bias is to the upside, expecting more upward movement, contingent on holding $104,770. The upcoming CPI data is the key catalyst. On the 4-hour chart, a break above $111,721 targets $116,722, while a break below $109,464 targets the key support zone at $104,777.

Bitcoin Is Hiding Something BIG (Target Revealed)In Episode 17 of my Bitcoin daily analysis , we just hit a +2.3% gain from the last long trigger, and now BTC is pressing against a critical resistance. If this level breaks with volume, the next +2.7% move could be right around the corner.
In this video, I’ll break Bitcoin down across weekly, daily, and 4H timeframes to show you:
Why this resistance is so important 🔑
How I set my next upside target step by step
The role of volume, BTC dominance, and TOTAL2/TOTAL3 in confirming moves
Whether altcoins (like ETH and SOL) are about to outperform Bitcoin
❌ Don’t FOMO.
✅ Stick to risk management.
✅ Trade your plan, not your emotions.
If you found this analysis helpful, share it with your trading friends and let’s grow smarter together.

BTC/USDT 4hour chart update !! BTC/USDT
Downtrend Channel Broken
Bitcoin was moving inside a descending channel (highlighted).
The price has now broken above the channel, indicating a potential trend reversal from bearish to bullish.
Support Zone
The green area around $107,000 – $108,000 acted as strong demand/support.
BTC bounced sharply from this zone, confirming that buyers stepped in.
50 Red MA (short-term) → Recently crossed above price, but BTC reclaimed it, turning it into support.
200 Green MA (long-term) → Sitting around $114,000, which may act as the next resistance.
Trendline Support
An ascending trendline (black) is holding current price action.
As long as BTC respects this line, the short-term outlook remains bullish.
Resistance: $114,000 (200 MA zone) → first big hurdle.
Higher target: $118,000 – $120,000 if momentum continues.
Support: $110,000 (trendline) and $108,000 (demand zone).
📈 Outlook
Bullish bias as long as BTC holds above $110,000 support/trendline.
A break above $114,000 could trigger a push towards $118K – $120K.
If BTC loses $110K, risk of retesting $107K – $108K support zone.
DYOR | NFA

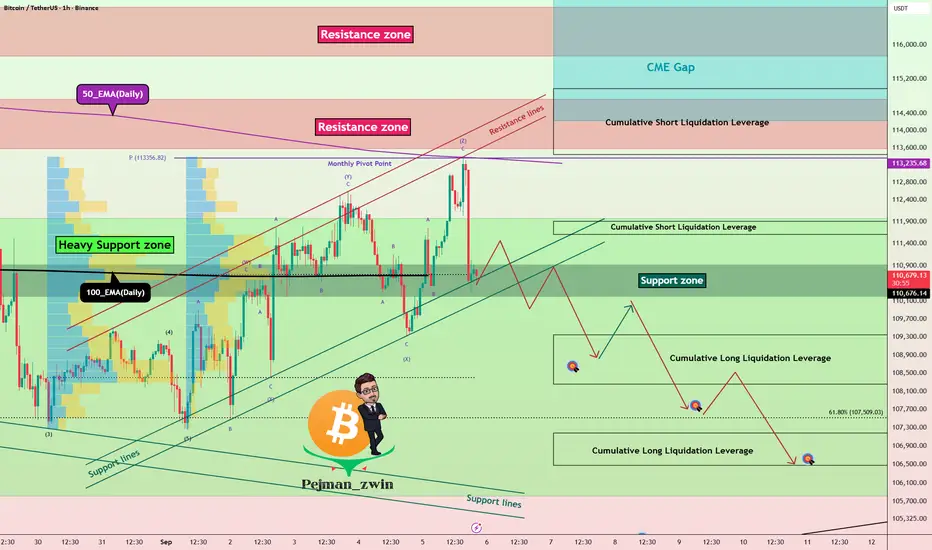
Bitcoin Roadmap – Breakdown Toward $107K or Bounce?Bitcoin ( BINANCE:BTCUSDT ) has been moving with high momentum this week , with the US indexes and Gold ( OANDA:XAUUSD ) bullish .
Bitcoin is currently trying to break the Support lines , Support zone($110,920-$110,200) and 100_EMA(Daily) .
In terms of Elliott Wave theory , it seems that the waves that Bitcoin has made this week have been in the form of a Triple Three Correction(WXYXZ) .
I expect Bitcoin to decline to at least $109,133(First Target) AFTER the Supports are broken.
Second Target: $107,740
Third Target: $106,660
Stop Loss(SL): $114,108(Worst)
Note: As I said at the beginning of this analysis, the financial markets have been a bit emotional and sudden with their movements this week, so always be prepared for any scenario and pay more attention to capital management.
Note: Generally, trading volume is low on Saturdays and Sundays. Perhaps it is a bit far-fetched to expect a break of the Heavy Support zone($111,980-$105,820) during the weekend. What do you think?
Cumulative Short Liquidation Leverage: $114,976-$113,440
Cumulative Short Liquidation Leverage: $111,907-$111,607
Cumulative Long Liquidation Leverage: $109,346-$108,259
Cumulative Long Liquidation Leverage: $107,181-$106,479
CME Gap: $117,235-$113,800
Please respect each other's ideas and express them politely if you agree or disagree.
Bitcoin Analysis (BTCUSDT), 1-hour time frame.
Be sure to follow the updated ideas.
Do not forget to put a Stop loss for your positions (For every position you want to open).
Please follow your strategy and updates; this is just my Idea, and I will gladly see your ideas in this post.
Please do not forget the ✅' like '✅ button 🙏😊 & Share it with your friends; thanks, and Trade safe.

BTC 1H Analysis - Key Triggers Ahead | Day 35💀 Hey , how's it going ? Come over here — Satoshi got something for you !
⏰ We’re analyzing BTC on the 1-Hour timeframe .
👀 On the 1-hour timeframe for Bitcoin, we can see that after touching its resistance at $111,300, Bitcoin moved toward its short alarm zone and activated it. However, the market didn’t show much selling pressure or bearish momentum. Currently, Bitcoin is ranging with very low volume, but with the new week starting, stronger volume could enter the market.
⚙️ Key RSI levels for Bitcoin are at 70 and 50. If RSI crosses these thresholds, Bitcoin could start a strong move — most likely at the beginning of the new week.
🕯 The size and number of green candles have slightly increased, and we are now sitting right below the critical resistance at $111,300. It’s likely that this level will be broken in the coming week.
🖥 This week has plenty of economic news events, which means the market could see high volatility. Overall, it looks like a good week for trading.
📊 Looking at the 1-hour timeframe of Tether dominance (USDT.D), after a strong rally it recently got rejected from the 4.51% level. The market sentiment shifted toward long positions, and selling pressure didn’t sustain. If 4.45% in Tether dominance breaks down, significant USDT could flow into Bitcoin and altcoins.
🔔 The key alarm zones for Bitcoin are set at $110,500 for short positions and $111,300 for long positions. Breaking these zones in the upcoming week could give us solid trade opportunities. Keep in mind that the economic news scheduled this week can strongly influence the market.
❤️ Disclaimer : This analysis is purely based on my personal opinion and I only trade if the stated triggers are activated .

BITCOINBTC is completing side ways correction move, its still not done yet and need some more time.
Disclosure: We are part of Trade Nation's Influencer program and receive a monthly fee for using their TradingView charts in our analysis.

TradeCityPro | Bitcoin Daily Analysis #171👋 Welcome to TradersCity Pro!
Let’s move on to Bitcoin analysis. Yesterday, Bitcoin continued ranging. Let’s see what triggers the market gives us today.
⌛️ 1-hour timeframe
Yesterday, after Bitcoin’s volume dropped to the lowest possible level, the market made a downward move and faked around the 110473 zone, and now it’s back inside the box again.
📊 The top of the box is at the 111654 zone, and if it breaks, the price can move toward the 113233 zone.
✔️ I still believe volume is very important, and as long as no significant volume comes in, the market won’t move. Even if it does, like yesterday’s drop, the chance of it being fake is very low.
📉 For a short position, we can enter with the 110473 trigger, but in my opinion, considering the higher cycles, it’s still not logical to open shorts. However, if buying volume enters, we can enter a long position with the long triggers we have.
🔔 In market conditions like this, when the volume is so low, one thing that really helps avoid unnecessary stop-losses is to avoid opening positions for a while and miss the first leg of the next price move.
⚡️ In this case, it’s true that we miss one leg that could have given us a risk-to-reward opportunity, but on the other hand, it prevents us from getting stopped out inside the ranging box. It also keeps our mind free from open trades so we can open new positions in the next legs, which are more reliable and have a higher win rate.
❌ Disclaimer ❌
Trading futures is highly risky and dangerous. If you're not an expert, these triggers may not be suitable for you. You should first learn risk and capital management. You can also use the educational content from this channel.
Finally, these triggers reflect my personal opinions on price action, and the market may move completely against this analysis. So, do your own research before opening any position.

Bitcoin (BTCUSDT) –> Double Top Playing OutHello guys!
On the 4H chart, Bitcoin has completed a double top formation. After failing to break above the 122,000 zone twice, the price rolled over and eventually broke below the neckline support.
Currently, BTC is pulling back toward the broken neckline area (112,000–113,000). This level may now act as resistance, setting up a bearish retest before continuation lower.
Key Technical Points
Double Top: Confirmed by two failed attempts to push higher.
Broken Neckline: Now turned into resistance.
Target of the Pattern: Based on the structure, the projected move points toward 105,000–105,500, which also aligns with a strong demand zone.
Scenario
If price rejects at the neckline retest, we can expect a move down toward the 105K region . A sustained break below 105K could accelerate bearish momentum, while reclaiming 113K would invalidate the pattern.
📌 Bias: Bearish below 113K, looking for continuation toward 105K.

bitcoin 2017 vs. 2025Bitcoin Same rhythm, same feelings.
History is repeating itself, the trend is still strong.
CRYPTOCAP:BTC

BTCUSD📊 BTC/USDT Analysis
✅ Update: TP2 successfully hit as per plan. (As in Previously shared plan)
⚠️ Catch: BTC made a new 1H HH around 113,434, but failed to break the 4H resistance at 113,506±.
🔎 Key Observations:
4H structure remains bearish (Lower Highs intact).
1H still holding bullish structure with HLs along the trendline.
Price is currently retesting our buying trendline zone, showing respect to HLs.
🎯 Scenarios:
Long 📌 Plan:1
Aggressive traders:
1️⃣ Bullish Case (Buying Zone Active)-CMP
BTC is at the trendline support zone → early longs possible
Long 📌 Plan:2
Conservative traders: Enter long only if BTC breaks & holds above 113,500±.
Wait for a bullish 4H confirmation candle at the buying zone before entering long.
📌 Short Plan:
Bearish Case (4H Continuation)
If BTC breaks the trendline & last HL of 1H TF , then Short for 4H bearish pattern continuation.
This would invalidate the current buying zone and 1H Bullish Pattern.
📌
Trade with proper risk management.


BTC🔻 Entry: $110,980
🎯 Targets:
• TP1 → $110,200 ✅
• TP2 → $109,500 ✅
• TP3 → $107,900 🚀
⛔ Stop Loss: $111,500
⚡ Leverage: 50x – 75x (High Risk ⚠️)
📊 Analysis:
BTC is approaching strong resistance near $111K. A potential rejection zone could trigger a downside move. Perfect short opportunity!

BTC Game Plan – Long OpportunityBTC Game Plan – Long Opportunity
📊 Market Sentiment
Market sentiment remains firmly bullish as the FED is expected to deliver a 0.25% rate cut, with growing speculation of a potential 0.5% cut in September. Monetary policy adjustments are being driven not only by inflation but also by weakening labor market data. The latest August and September job reports came in soft, signaling that the economy is cooling rapidly. This backdrop strengthens expectations for one of the most significant bullish runs in the weeks ahead.
📈 Technical Analysis
BTC has confirmed bullish momentum after breaking the bearish trendline.
Price action currently looks like an accumulation phase, preparing to expand liquidity higher. I see this as a range-bound delivery where price takes both sides of liquidity pools located at the extremes, rather than running directly into new all-time highs.
📌 Game Plan
1)Watch for price to retrace into the 4H demand zone around $109,400.
2)Look for liquidity sweep at the 4H swing lows.
3)Possible deeper retracement into the 0.75 discount zone near $108,700.
🎯 Setup Trigger
I will look for a confirmed 1H break of structure before entering long.
📋 Trade Management
Stoploss: Below the 1H swing low responsible for the BOS
Targets:
• TP1: $103,450
• TP2: $117,400
💬 Like, follow, and comment if you find this setup valuable!
⚠️ Disclaimer: This content is for informational and educational purposes only and does not constitute financial, investment, or trading advice. Always do your own research before making any financial decisions.

Bitcoin’s 50 EMA Shield — Is the Next Leg Up Loading?CRYPTOCAP:BTC continues to respect the 50 EMA on the weekly chart — a dynamic support that has been the backbone of this bullish structure. Every correction so far has found demand at this level before price pushed higher again.
Currently, BTC is once again rebounding from the 50 EMA after a period of consolidation. At the same time, it’s pressing against a horizontal resistance zone that has capped upside moves.
If Bitcoin can break and hold above this horizontal resistance, that level could flip into support and trigger the next leg higher, potentially leading to new highs. As long as BTC stays above the 50 EMA, the mid-to-long-term outlook remains bullish.
DYOR, NFA ✌️
More updates soon.

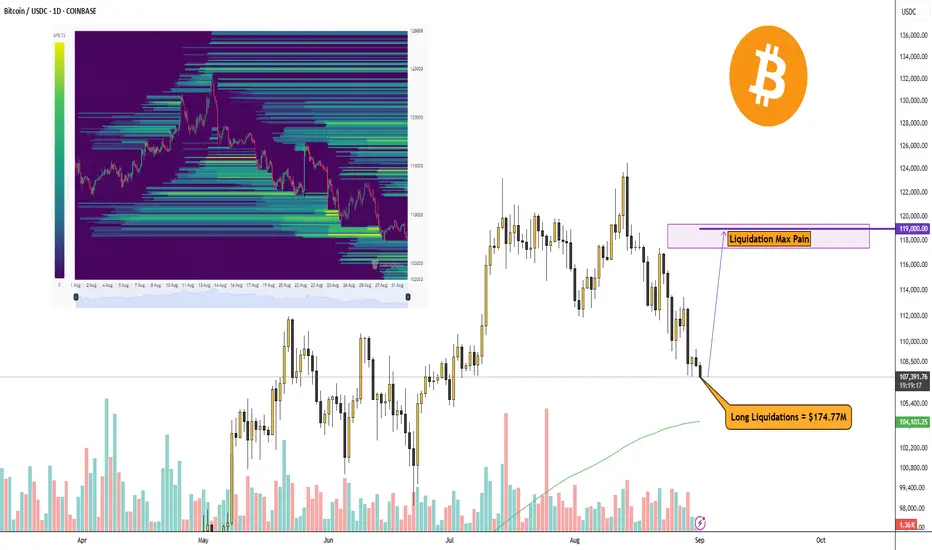
Bitcoin up or down?Bitcoin has corrected a bit more, and it looks like the main liquidations of long traders are done.
Right now, there’s a huge volume of Liquidation Max Pain at the $119,000 level, give or take. It’s the perfect time to buy Bitcoin.
A Single Trade Can, Destroy Your whole PortfolioHave you ever felt that one small trade could put your entire portfolio at risk instantly?
Even professional traders sometimes fall victim to a wrong decision, and crypto is ruthless.
This analysis shows how your mind and emotions can betray you in the market.
Hello✌️
Spend 2 minutes ⏰ reading this educational material.
🎯 Analytical Insight on Bitcoin:
BINANCE:BTCUSDT is trading inside a descending channel 📉 and is approaching a key daily trendline along with a strong resistance level. If it fails to break all three hurdles, the channel top, the trendline, and the resistance, I expect at least a 6% drop with a potential target near $104,200 ⚠️.
Now , let's dive into the educational section,
🧠 Trader Psychology
Most failures in crypto come from emotional decisions.
When fear and greed take over, even experienced traders make mistakes.
A moment of FOMO or greed is enough to put your entire investment in danger.
We need to understand how controlling emotions is vital and how to prepare our minds before market pressure hits.
📉 Lessons from Crashes
Big crashes happen due to a mix of human error and psychological pressure.
Even if the chart looks bullish, greed for fast profits can push you into trades at the worst moments.
A single red candle can wipe out your entire capital in minutes.
Recognizing the psychological cycles of the market can help prevent these disasters.
🔍 Candlestick Analysis
Candles reveal how the crowd feels.
A large bearish candle can trigger fear and FOMO, causing hasty selling.
Learning candle psychology helps avoid catastrophic trading mistakes.
💰 Risk Management
No trade is without risk.
Always start with proper stop-loss and small trade sizes.
Even a tiny mistake in a high-volume trade can destroy everything.
🔄 Market Psychological Cycle
The crypto market moves in a cycle of excitement, FOMO, fear, and surrender.
Understanding this cycle helps you buy and sell at better times and avoid emotional traps.
📊 TradingView Tools
Using TradingView tools practically is crucial to avoid catastrophic mistakes:
RSI Identifies overbought or oversold conditions to prevent emotional entries.
Bollinger Bands Shows price volatility ranges and guides logical decisions.
Volume Helps determine if a move is genuine or just short-term hype.
Support & Resistance Determines precise stop-loss levels and profit targets.
Alerts Price alerts notify you before sudden changes to avoid major mistakes.
Multiple Timeframes Analyzing different timeframes gives a broader market perspective.
Candlestick Patterns Understanding candle patterns reveals crowd behavior and market psychology.
📝 Practical Tips
Clear your mind of emotions before entering a trade, Never trade without mental clarity.
Adjust trade size according to your capital, A small mistake with high volume can destroy your entire portfolio.
Always check the long-term market trend, Focusing only on short-term charts leads to poor decisions.
⚠️ Final Warning
No one is immune in the market.
Even pros can make mistakes in a split second.
Using TradingView tools and learning market psychology can significantly reduce the risk of catastrophic losses.
✨ Need a little love!
We pour love into every post your support keeps us inspired! 💛 Don’t be shy, we’d love to hear from you on comments. Big thanks, Mad Whale 🐋
📜Please make sure to do your own research before investing, and review the disclaimer provided at the end of each post.

TradeCityPro | Bitcoin Daily Analysis #170👋 Welcome to TradeCity Pro!
Let’s dive into Bitcoin analysis. Yesterday, the U.S. unemployment rate was released. Let’s see how it impacted the market and what the conditions look like for the future.
⏳ 1-Hour Timeframe
Yesterday, after the U.S. unemployment rate report came out positive for the market, the price made an upward move and reached the 113233 resistance.
⚡️ But after hitting this level, it faced a heavy rejection and with a red candle, the price dropped back down to the 110561 support and is still ranging around this area.
✔️ After the daily candle closed, market volume dropped significantly and remains very low, which is why candle volatility has also decreased a lot.
📊 This low volume is natural because it comes after a sharp, high-volume move in the market, and also because it is the weekend—volume typically declines on Saturdays and Sundays.
⭐ It’s likely that today and tomorrow the volume will stay this low and price could continue ranging until then, with the next real move happening once the new weekly candle opens.
💥 Step by step, we are also approaching Jerome Powell’s speech and the U.S. interest rate decision on September 17, which will make the market even more indecisive as we get closer to that date.
❌ Disclaimer ❌
Trading futures is highly risky and dangerous. If you're not an expert, these triggers may not be suitable for you. You should first learn risk and capital management. You can also use the educational content from this channel.
Finally, these triggers reflect my personal opinions on price action, and the market may move completely against this analysis. So, do your own research before opening any position.

BTCUSDT (Daily)### 🔎 **Chart Context**
* Pair: **BTC/USDT**
* Exchange: **Binance**
* Timeframe: **1D (Daily)**
* Current price: \~**110,880**
* BTC has retraced from the **124,474 top** and is now stabilizing above the **111,920 support zone**.
* Projection points toward a **bullish continuation toward 138,000** after reclaiming mid-range resistance.
---
### 📊 **Key Observations**
1. **Market Structure**
* BTC printed a **higher high at 124,474** in August.
* Pullback into **111,920 support zone** has been defended.
* Structure remains **bullish** on daily timeframe as long as BTC holds above **100,000 – 111,000 range**.
2. **Support Zones**
* **111,920 – 110,530**: Immediate support, currently holding.
* **99,475 – 100,372**: Strong historical support cluster, high-volume node on VPVR.
* **88,765 – 90,500**: Deeper demand zone if broader correction occurs.
3. **Resistance Zones**
* **119,902 – 123,218**: First major resistance ahead.
* **124,474**: Swing high and liquidity cluster.
* **138,000 – 140,000**: Next big target & projected liquidity pool (aligned with chart’s TP).
4. **Volume Profile (VPVR)**
* Clear **volume gap above 120,000**, meaning once BTC reclaims **119,900**, price can accelerate toward **138,000**.
* Heaviest volume traded between **95,000 – 105,000**, forming a strong support base.
---
### 📈 **Bullish Scenario (Higher Probability)**
* Price sustains above **111,920 support**.
* Path:
* Retest 119,900 → Break 124,474 high → Rally into 138,000–140,000 zone.
* This aligns with projection, suggesting continuation after consolidation.
---
### 📉 **Bearish Scenario (Risk Case)**
* Breakdown below **111,920 – 110,530 support**.
* Next downside levels:
* **100,000 – 99,475** → Major support & volume shelf.
* **88,765 – 90,500** if selling accelerates.
* A daily close below **99,000** would shift structure to bearish mid-term.
---
### ⚡ **Trading Plan**
* **Long Setup (Preferred):**
* Entry: 111,920 – 110,530 support retest.
* TP1: 119,900
* TP2: 124,474
* TP3: 138,000–140,000
* Stop: Below 109,000
* **Short Setup (Countertrend):**
* Entry: Rejection from 119,900 – 124,474 zone.
* TP: 111,920 → 100,000
* Stop: Above 125,500
---
### ✅ **Conclusion**
BTC/USDT daily remains **bullish**, holding key support at **111,920**. The most probable scenario is **continuation toward 119,900 → 124,474 → 138,000**, with strong momentum if BTC reclaims **120K**. Only a breakdown below **100K** would invalidate the bullish trajectory.

$BTC - Weekend OutlookBINANCE:BTCUSDT | 2h
CRYPTOCAP:BTC is still holding its current range, trading inside this fair value below the POC.
Key levels:
Resistance: $113k
Support: $110k
If price holds $110k through the weekend, another push toward 112.8k–113.1k is likely. A rejection and stall at that zone would be a strong signal for breakdown.
