BTCUSD📊 BTC/USDT Analysis
✅ Update: TP2 successfully hit as per plan. (As in Previously shared plan)
⚠️ Catch: BTC made a new 1H HH around 113,434, but failed to break the 4H resistance at 113,506±.
🔎 Key Observations:
4H structure remains bearish (Lower Highs intact).
1H still holding bullish structure with HLs along the trendline.
Price is currently retesting our buying trendline zone, showing respect to HLs.
🎯 Scenarios:
Long 📌 Plan:1
Aggressive traders:
1️⃣ Bullish Case (Buying Zone Active)-CMP
BTC is at the trendline support zone → early longs possible
Long 📌 Plan:2
Conservative traders: Enter long only if BTC breaks & holds above 113,500±.
Wait for a bullish 4H confirmation candle at the buying zone before entering long.
📌 Short Plan:
Bearish Case (4H Continuation)
If BTC breaks the trendline & last HL of 1H TF , then Short for 4H bearish pattern continuation.
This would invalidate the current buying zone and 1H Bullish Pattern.
📌
Trade with proper risk management.
BTCUSDT


BTC🔻 Entry: $110,980
🎯 Targets:
• TP1 → $110,200 ✅
• TP2 → $109,500 ✅
• TP3 → $107,900 🚀
⛔ Stop Loss: $111,500
⚡ Leverage: 50x – 75x (High Risk ⚠️)
📊 Analysis:
BTC is approaching strong resistance near $111K. A potential rejection zone could trigger a downside move. Perfect short opportunity!

BTC Game Plan – Long OpportunityBTC Game Plan – Long Opportunity
📊 Market Sentiment
Market sentiment remains firmly bullish as the FED is expected to deliver a 0.25% rate cut, with growing speculation of a potential 0.5% cut in September. Monetary policy adjustments are being driven not only by inflation but also by weakening labor market data. The latest August and September job reports came in soft, signaling that the economy is cooling rapidly. This backdrop strengthens expectations for one of the most significant bullish runs in the weeks ahead.
📈 Technical Analysis
BTC has confirmed bullish momentum after breaking the bearish trendline.
Price action currently looks like an accumulation phase, preparing to expand liquidity higher. I see this as a range-bound delivery where price takes both sides of liquidity pools located at the extremes, rather than running directly into new all-time highs.
📌 Game Plan
1)Watch for price to retrace into the 4H demand zone around $109,400.
2)Look for liquidity sweep at the 4H swing lows.
3)Possible deeper retracement into the 0.75 discount zone near $108,700.
🎯 Setup Trigger
I will look for a confirmed 1H break of structure before entering long.
📋 Trade Management
Stoploss: Below the 1H swing low responsible for the BOS
Targets:
• TP1: $103,450
• TP2: $117,400
💬 Like, follow, and comment if you find this setup valuable!
⚠️ Disclaimer: This content is for informational and educational purposes only and does not constitute financial, investment, or trading advice. Always do your own research before making any financial decisions.

Bitcoin’s 50 EMA Shield — Is the Next Leg Up Loading?CRYPTOCAP:BTC continues to respect the 50 EMA on the weekly chart — a dynamic support that has been the backbone of this bullish structure. Every correction so far has found demand at this level before price pushed higher again.
Currently, BTC is once again rebounding from the 50 EMA after a period of consolidation. At the same time, it’s pressing against a horizontal resistance zone that has capped upside moves.
If Bitcoin can break and hold above this horizontal resistance, that level could flip into support and trigger the next leg higher, potentially leading to new highs. As long as BTC stays above the 50 EMA, the mid-to-long-term outlook remains bullish.
DYOR, NFA ✌️
More updates soon.

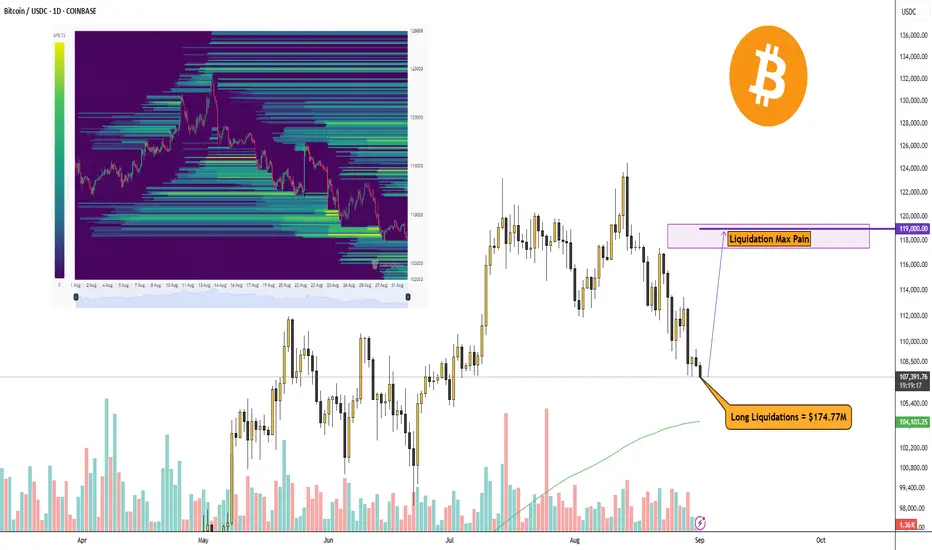
Bitcoin up or down?Bitcoin has corrected a bit more, and it looks like the main liquidations of long traders are done.
Right now, there’s a huge volume of Liquidation Max Pain at the $119,000 level, give or take. It’s the perfect time to buy Bitcoin.
A Single Trade Can, Destroy Your whole PortfolioHave you ever felt that one small trade could put your entire portfolio at risk instantly?
Even professional traders sometimes fall victim to a wrong decision, and crypto is ruthless.
This analysis shows how your mind and emotions can betray you in the market.
Hello✌️
Spend 2 minutes ⏰ reading this educational material.
🎯 Analytical Insight on Bitcoin:
BINANCE:BTCUSDT is trading inside a descending channel 📉 and is approaching a key daily trendline along with a strong resistance level. If it fails to break all three hurdles, the channel top, the trendline, and the resistance, I expect at least a 6% drop with a potential target near $104,200 ⚠️.
Now , let's dive into the educational section,
🧠 Trader Psychology
Most failures in crypto come from emotional decisions.
When fear and greed take over, even experienced traders make mistakes.
A moment of FOMO or greed is enough to put your entire investment in danger.
We need to understand how controlling emotions is vital and how to prepare our minds before market pressure hits.
📉 Lessons from Crashes
Big crashes happen due to a mix of human error and psychological pressure.
Even if the chart looks bullish, greed for fast profits can push you into trades at the worst moments.
A single red candle can wipe out your entire capital in minutes.
Recognizing the psychological cycles of the market can help prevent these disasters.
🔍 Candlestick Analysis
Candles reveal how the crowd feels.
A large bearish candle can trigger fear and FOMO, causing hasty selling.
Learning candle psychology helps avoid catastrophic trading mistakes.
💰 Risk Management
No trade is without risk.
Always start with proper stop-loss and small trade sizes.
Even a tiny mistake in a high-volume trade can destroy everything.
🔄 Market Psychological Cycle
The crypto market moves in a cycle of excitement, FOMO, fear, and surrender.
Understanding this cycle helps you buy and sell at better times and avoid emotional traps.
📊 TradingView Tools
Using TradingView tools practically is crucial to avoid catastrophic mistakes:
RSI Identifies overbought or oversold conditions to prevent emotional entries.
Bollinger Bands Shows price volatility ranges and guides logical decisions.
Volume Helps determine if a move is genuine or just short-term hype.
Support & Resistance Determines precise stop-loss levels and profit targets.
Alerts Price alerts notify you before sudden changes to avoid major mistakes.
Multiple Timeframes Analyzing different timeframes gives a broader market perspective.
Candlestick Patterns Understanding candle patterns reveals crowd behavior and market psychology.
📝 Practical Tips
Clear your mind of emotions before entering a trade, Never trade without mental clarity.
Adjust trade size according to your capital, A small mistake with high volume can destroy your entire portfolio.
Always check the long-term market trend, Focusing only on short-term charts leads to poor decisions.
⚠️ Final Warning
No one is immune in the market.
Even pros can make mistakes in a split second.
Using TradingView tools and learning market psychology can significantly reduce the risk of catastrophic losses.
✨ Need a little love!
We pour love into every post your support keeps us inspired! 💛 Don’t be shy, we’d love to hear from you on comments. Big thanks, Mad Whale 🐋
📜Please make sure to do your own research before investing, and review the disclaimer provided at the end of each post.

TradeCityPro | Bitcoin Daily Analysis #170👋 Welcome to TradeCity Pro!
Let’s dive into Bitcoin analysis. Yesterday, the U.S. unemployment rate was released. Let’s see how it impacted the market and what the conditions look like for the future.
⏳ 1-Hour Timeframe
Yesterday, after the U.S. unemployment rate report came out positive for the market, the price made an upward move and reached the 113233 resistance.
⚡️ But after hitting this level, it faced a heavy rejection and with a red candle, the price dropped back down to the 110561 support and is still ranging around this area.
✔️ After the daily candle closed, market volume dropped significantly and remains very low, which is why candle volatility has also decreased a lot.
📊 This low volume is natural because it comes after a sharp, high-volume move in the market, and also because it is the weekend—volume typically declines on Saturdays and Sundays.
⭐ It’s likely that today and tomorrow the volume will stay this low and price could continue ranging until then, with the next real move happening once the new weekly candle opens.
💥 Step by step, we are also approaching Jerome Powell’s speech and the U.S. interest rate decision on September 17, which will make the market even more indecisive as we get closer to that date.
❌ Disclaimer ❌
Trading futures is highly risky and dangerous. If you're not an expert, these triggers may not be suitable for you. You should first learn risk and capital management. You can also use the educational content from this channel.
Finally, these triggers reflect my personal opinions on price action, and the market may move completely against this analysis. So, do your own research before opening any position.

BTCUSDT (Daily)### 🔎 **Chart Context**
* Pair: **BTC/USDT**
* Exchange: **Binance**
* Timeframe: **1D (Daily)**
* Current price: \~**110,880**
* BTC has retraced from the **124,474 top** and is now stabilizing above the **111,920 support zone**.
* Projection points toward a **bullish continuation toward 138,000** after reclaiming mid-range resistance.
---
### 📊 **Key Observations**
1. **Market Structure**
* BTC printed a **higher high at 124,474** in August.
* Pullback into **111,920 support zone** has been defended.
* Structure remains **bullish** on daily timeframe as long as BTC holds above **100,000 – 111,000 range**.
2. **Support Zones**
* **111,920 – 110,530**: Immediate support, currently holding.
* **99,475 – 100,372**: Strong historical support cluster, high-volume node on VPVR.
* **88,765 – 90,500**: Deeper demand zone if broader correction occurs.
3. **Resistance Zones**
* **119,902 – 123,218**: First major resistance ahead.
* **124,474**: Swing high and liquidity cluster.
* **138,000 – 140,000**: Next big target & projected liquidity pool (aligned with chart’s TP).
4. **Volume Profile (VPVR)**
* Clear **volume gap above 120,000**, meaning once BTC reclaims **119,900**, price can accelerate toward **138,000**.
* Heaviest volume traded between **95,000 – 105,000**, forming a strong support base.
---
### 📈 **Bullish Scenario (Higher Probability)**
* Price sustains above **111,920 support**.
* Path:
* Retest 119,900 → Break 124,474 high → Rally into 138,000–140,000 zone.
* This aligns with projection, suggesting continuation after consolidation.
---
### 📉 **Bearish Scenario (Risk Case)**
* Breakdown below **111,920 – 110,530 support**.
* Next downside levels:
* **100,000 – 99,475** → Major support & volume shelf.
* **88,765 – 90,500** if selling accelerates.
* A daily close below **99,000** would shift structure to bearish mid-term.
---
### ⚡ **Trading Plan**
* **Long Setup (Preferred):**
* Entry: 111,920 – 110,530 support retest.
* TP1: 119,900
* TP2: 124,474
* TP3: 138,000–140,000
* Stop: Below 109,000
* **Short Setup (Countertrend):**
* Entry: Rejection from 119,900 – 124,474 zone.
* TP: 111,920 → 100,000
* Stop: Above 125,500
---
### ✅ **Conclusion**
BTC/USDT daily remains **bullish**, holding key support at **111,920**. The most probable scenario is **continuation toward 119,900 → 124,474 → 138,000**, with strong momentum if BTC reclaims **120K**. Only a breakdown below **100K** would invalidate the bullish trajectory.

$BTC - Weekend OutlookBINANCE:BTCUSDT | 2h
CRYPTOCAP:BTC is still holding its current range, trading inside this fair value below the POC.
Key levels:
Resistance: $113k
Support: $110k
If price holds $110k through the weekend, another push toward 112.8k–113.1k is likely. A rejection and stall at that zone would be a strong signal for breakdown.

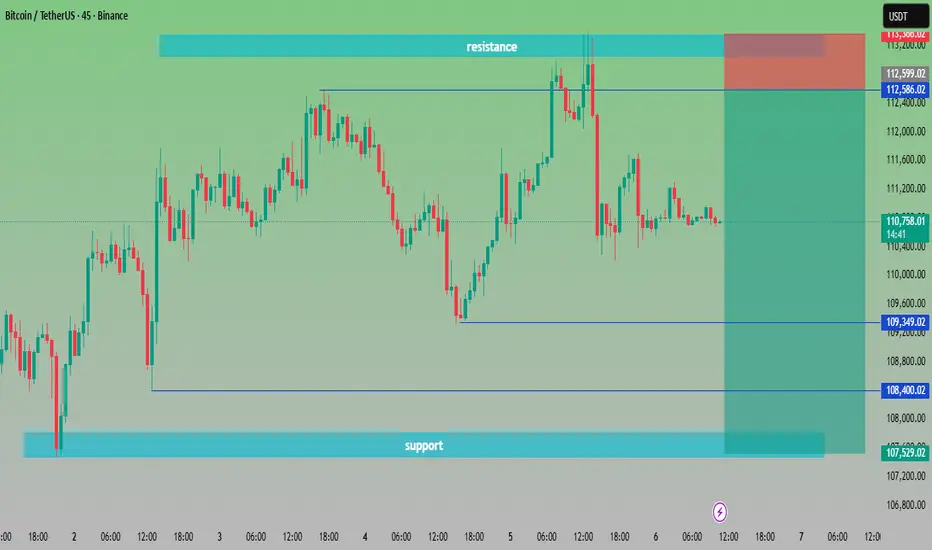
“BTC/USDT at Crossroads Key Levels to Watch🔎 Chart Analysis – BTC/USDT (45m)
Resistance Zone: Around 112,586 – 113,200 USDT. Price has tested this area multiple times but failed to break out, confirming strong selling pressure.
Support Zone: Around 107,529 – 108,400 USDT. Buyers have consistently defended this zone, making it a key demand area.
Current Price: 110,720 USDT, sitting in the middle of support and resistance.
📌 Scenarios:
Bullish Case 🟢🚀 – If BTC breaks above 112,586 USDT, momentum could push toward 113,500+ USDT.
Bearish Case 🔴📉 – If BTC fails to hold 109,349 USDT, price may retest the deeper support around 107,500 USDT.
⚖️ Trading Plan Idea:
Long Entry: Above 112,600 breakout ✅
Short Entry: Below 109,300 breakdown ❌
Target Zones:
Upside 🎯 → 113,500+
Downside 🎯 → 107,500
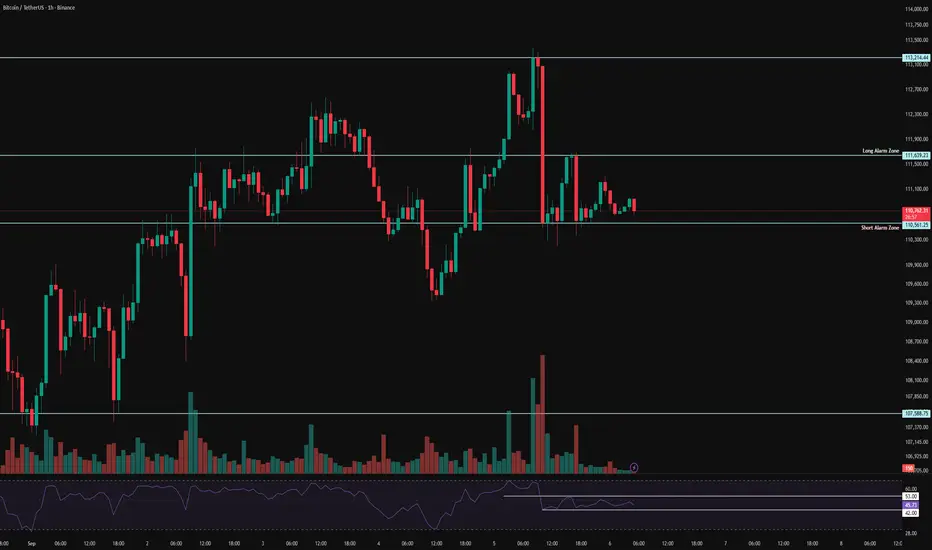
BTC 1H Analysis - Key Triggers Ahead | Day 34💀 Hey, how's it going ? Come over here — Satoshi got something for you!
⏰ We’re analyzing BTC on the 1-hour timeframe timeframe.
👀 On the 1H timeframe for Bitcoin, we can see that after yesterday’s NFP news, Bitcoin moved toward its resistance levels but then faced a very strong rejection. Personally, I expected some big green candles after that news. Right now, Bitcoin is consolidating, and the top and bottom of this range should be considered as breakout zones.
⚙️ The key RSI levels for Bitcoin are around 42 and 53. Once RSI breaks out of this range, Bitcoin can start its new move following the impacts of yesterday.
🕯 The size and volume of the red candles after the news increased sharply, and with one strong selling-pressure candle, the price dropped from the top of the range to the bottom.
💵📊 On the 1H timeframe for USDT.D, we can see that after yesterday’s news it had a very strong reaction from its support area and, with one massive hourly whale candle, pushed up toward its resistance at 4.49%. From there, it got rejected with several red candles and formed a higher low compared to its previous bottom. Keep in mind that if 4.49% is broken, Bitcoin could go into a deeper correction.
🔔 The alert zones for Bitcoin are the top and bottom of this range, which can give us entry signals. Our long alert zone is at 11,600$, and if this level breaks, Bitcoin could move higher. On the other hand, 11,056$ is our short alert zone, and with a breakdown of this level and selling pressure, Bitcoin could push toward lower levels.
❤️ Disclaimer : This analysis is purely based on my personal opinion and I only trade if the stated triggers are activated .
“Bitcoin Price Action: Liquidity Grab Fuels Next Bullish Impulse“Bitcoin Price Action: Liquidity Grab Fuels Next Bullish Impulse 📈”
Hello Traders & Investors,
Let’s take a closer look at BTCUSD from both a structural and liquidity perspective.
🔹 Market Structure
The chart shows that after a strong bullish leg into mid-August, BTCUSD faced heavy rejection from the 120,000 – 123,000 resistance zone, which remains the most important supply area on the chart. This rejection triggered a clear Break of Structure (BOS), leading to a correction and liquidity grab.
Recently, price created a liquidity sweep in the 108,000 – 110,000 region, trapping late sellers and collecting orders from beneath previous lows. Following that, BTCUSD reclaimed the 111,000 – 112,000 zone, confirming it as new support.
🔹 Liquidity & Smart Money Behavior
The downside sweep indicates accumulation, where smart money entered long positions.
Liquidity resting above current levels (towards 116,000 → 120,000) is now the most likely target for price.
The previous liquidity channel to the downside has been fully absorbed, shifting bias toward bullish continuation.
🔹 Key Levels to Watch
Support: 111,000 – 112,000 (liquidity sweep + reclaimed support).
Resistance: 120,000 – 123,000 (major supply and reaction zone).
🔹 Projection
As long as BTCUSD holds above 111,000, my bias remains bullish. The next objective lies at the 120,000 zone, which aligns with untested supply and prior rejection levels. However, traders should be prepared for a reaction or short-term retracement once this area is tested.
✅ Conclusion:
BTCUSD has shown strength after sweeping liquidity from the downside. The structure now supports a bullish push toward 120,000, provided 111,000 support continues to hold. This remains a critical level for validation of further upside.


Bitcoin Rally Entering Final Stages!Bitcoin Bull Cycle Analysis:
Historically, Bitcoin has moved in clearly defined market cycles, each lasting roughly 1,064–1,065 days (about 3 years) from bottom to peak, followed by a sharp correction.
2013–2017 Cycle
🔶Bitcoin bottomed in early 2015 and then entered a strong bull run.
🔶Over the next 1,064 days, Bitcoin surged by more than 12,000%, ultimately peaking in late 2017.
🔶After the peak, Bitcoin experienced an 84% decline over the following year, entering a prolonged bear market.
2017–2021 Cycle
🔶From the December 2018 bottom, Bitcoin again began a long bull phase.
🔶In the next 1,064 days, Bitcoin gained over 2,000%, reaching a new all-time high in late 2021.
🔶Similar to the previous cycle, the market corrected sharply, with Bitcoin losing around 76% of its value within a year.
2021–2025 Cycle (Current)
🔶The most recent bottom was recorded in late 2022. Since then, Bitcoin has been in a sustained uptrend.
🔶As of today, the cycle has lasted 1,000+ days, during which Bitcoin has appreciated by roughly 675%.
🔶If the historical pattern continues, this bull run may have about two months left before reaching a cycle peak.
🔶Afterward, the market could undergo a significant correction, potentially in the range of 60–70%, though smaller than previous drops.
Conclusion : Bitcoin’s market history shows a repeating cycle of multi-year bull runs followed by sharp corrections. While past performance does not guarantee future results, the consistency in cycle length and the pattern of diminishing corrections suggest that Bitcoin may soon approach its next major peak. If the trend holds, a significant pullback of 60–70% could follow, offering both risks for late entrants and opportunities for long-term investors. This highlights the importance of caution, disciplined risk management, and strategic planning as we near the potential end of the 2021–2025 bull cycle.

ETH: Clear Move DownOn September 1, the Ethereum market turned downward on the 1-hour timeframe around the $4,444 zone. The move was sharp: price broke through several key levels and reached $4,261, giving a maximum difference of about $183 per coin. By the time the trade was closed, the third target had been reached, and the result was fully realized.
The essence lies not only in profit, but in how the trade was managed. The algorithm step by step highlighted profit-taking zones, enabled a shift to breakeven, and protected capital from emotional mistakes. This transformed trading such a volatile asset into a structured process where every step was clear in advance.
The market will always throw challenges. But when management is built on an algorithmic approach, trading stops being a guessing game and becomes a systematic strategy."

Bitcoin Crash Incoming?Bitcoin Cycle Analysis – Are We Nearing the 2025 Peak?
The above chart highlights Bitcoin’s historical market cycles, which have shown a remarkable pattern of consistency over the past decade. Each bull cycle has lasted roughly 1,064 days from the cycle bottom to the cycle peak, followed by a sharp correction phase.
Historical Cycles
- 2013 Peak → After the 2011–2012 bottom, Bitcoin rallied for ~1,064 days before peaking in late 2013. This was followed by a deep bear market.
- 2017 Peak → From the 2015 bottom, Bitcoin surged over 12,000% in ~1,064 days, peaking in December 2017 before dropping 84%.
- 2021 Peak → From the December 2018 bottom, Bitcoin rallied for 1,064 days again, gaining over 2,000% and peaking in late 2021. The following year saw a 76% correction.
Current Cycle (2021–2025)
- The most recent bottom was established in late 2022, marking the start of the current cycle.
- We are now over 1,000 days into this bull run, and Bitcoin has gained approximately 675% so far.
- If the historical cycle length repeats, the 2025 peak could occur around late October 2025.
Price Projection Based on Curved Support & Resistance
- Bitcoin’s price action has respected a curved support–resistance channel across the past three cycles.
- If the same pattern continues, the current cycle could see Bitcoin touch the curved resistance around the $130K–$140K level in October 2025.
- Historically, October has been a bullish month for Bitcoin, with strong momentum in previous cycles. Notably, in October 2021, Bitcoin printed a powerful bullish candle that led to the cycle peak.
- If history repeats, we could see a similar October rally in 2025, potentially marking the cycle top.
After the peak, a correction in the range of 60–70% is expected, consistent with the pattern of diminishing drawdowns (84% → 76% → projected 60–70%). This would place the potential next cycle bottom in the $50K–$60K range.
Conclusion
Bitcoin is nearing the end of its 2021–2025 bull cycle, with a potential peak around $130K–$140K in October 2025. Historically, October has been a bullish month, and past cycles suggest a 60–70% correction could follow, likely bringing prices back to the $50K–$60K range. With diminishing corrections each cycle, the market shows signs of maturity, but caution and risk management remain essential as we approach the cycle top.
Cheers
Hexa
CRYPTOCAP:BTC BINANCE:BTCUSDT BITSTAMP:BTCUSD

BTC ANALYSIS📊 #BTC Analysis
✅There is a formation of Descending Channel Pattern in daily time frame in #BTC .
Also there is a perfect breakout and retest. There is an instant major resistance and major support zone and if #BTC breaks the resistance zone then we would see a bullish move
👀Current Price: $1,10,800
🎯 Target Price : $1,21,700
⚡️What to do ?
👀Keep an eye on #BTC price action and volume. We can trade according to the chart and make some profits⚡️⚡️
#BTC #Cryptocurrency #Breakout #TechnicalAnalysis #DYOR

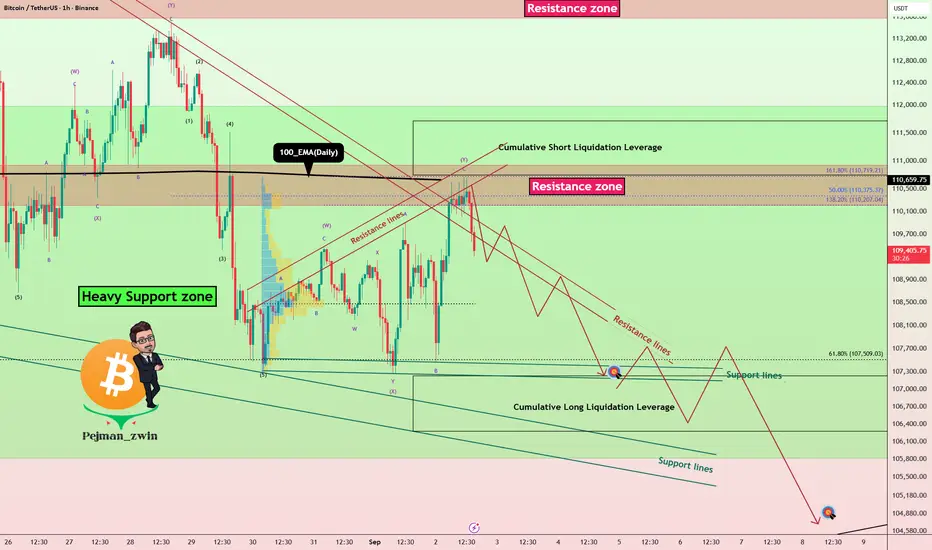
Bitcoin’s Heavy Support Zone Under Attack–Will It Finally Break?Bitcoin ( BINANCE:BTCUSDT ) currently appears to have completed its pullback to the 100_EMA(Daily) , and Bitcoin has failed to break the Resistance lines with high momentum. The Resistance zone($110,920-$110,200) , Resistance lines , and Cumulative Short Liquidation Leverage($111,711-$110,745) could prevent Bitcoin from rising.
In terms of Elliott Wave theory , Bitcoin appears to have completed the wave Y of the Double Three Correction(WXY) .
I expect Bitcoin to decline at least to the Support lines and Cumulative Long Liquidation Leverage($107,230-$106,277) . And there is a possibility that Bitcoin will eventually break the Heavy Support zone($111,980-$105,820) in this attack .
Do you think Bitcoin can finally break the Heavy Support zone($111,980-$105,820)?
CME Gap: $117,235-$113,800
Stop Loss(SL): $111,880(Worst)
Please respect each other's ideas and express them politely if you agree or disagree.
Bitcoin Analyze (BTCUSDT), 1-hour time frame.
Be sure to follow the updated ideas.
Do not forget to put a Stop loss for your positions (For every position you want to open).
Please follow your strategy and updates; this is just my Idea, and I will gladly see your ideas in this post.
Please do not forget the ✅' like '✅ button 🙏😊 & Share it with your friends; thanks, and Trade safe.
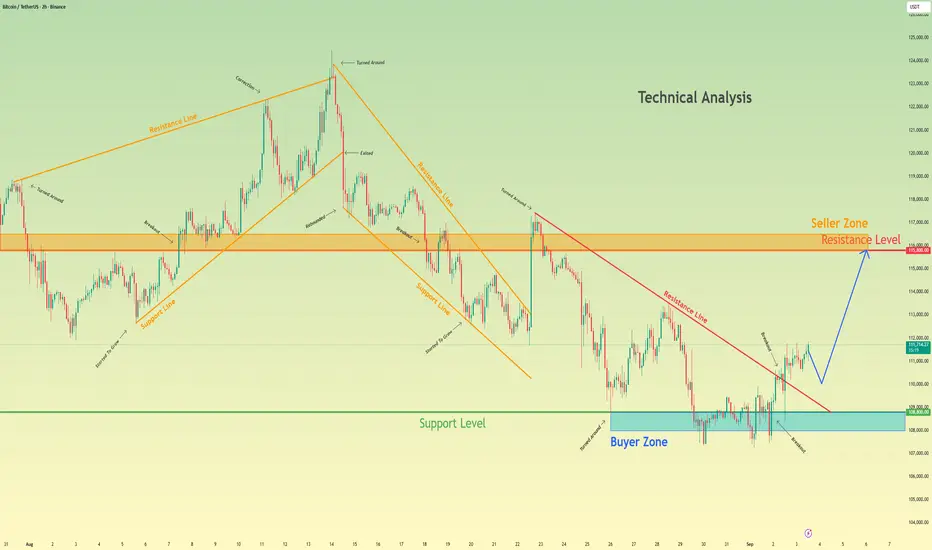
Bitcoin continue to move up to resistance levelHello traders, I want share with you my opinion about Bitcoin. The prolonged corrective phase for Bitcoin appears to be concluding, as the price action signals a significant shift in momentum. After a complex journey through various corrective patterns, the price established a strong support base in the 108800 buyer zone and has now executed a decisive breakout from the final descending resistance line. Currently, following this breakout, the price of BTC is in a strong upward impulse, confirming the new bullish momentum and moving decisively away from the prior consolidation zone. The primary working hypothesis is a long scenario that anticipates a brief corrective movement before the next major leg higher. The expectation is that the price will soon make a small dip to retest the recently broken resistance line, confirming it as new dynamic support. A successful and confirmed bounce from this retest would validate the strength of the breakout and signal that buyers remain in firm control, likely triggering the continuation of the rebound to the upside. Therefore, the TP for this breakout and continuation play is logically placed at the 115800 level, which aligns with the major horizontal resistance level and seller zone. Please share this idea with your friends and click Boost 🚀
BtcUsdtBitcoin is in a downtrend and now after this bearish mode we need another retracement till to sell point (112.000-113.000) and to go down, might see this drop during nfp or after that, lets see...

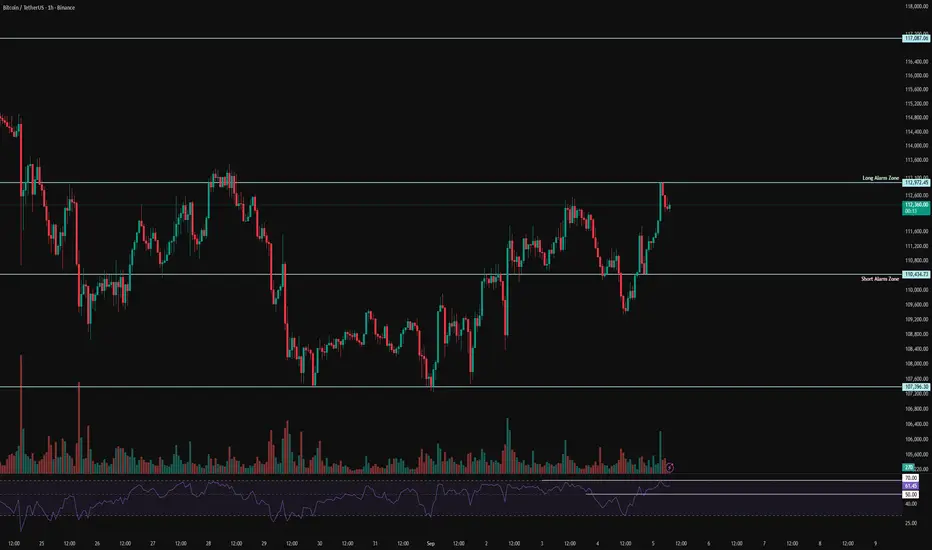
BTC 1H Analysis - Key Triggers Ahead | Day 33💀 Hey , how's it going ? Come over here — Satoshi got something for you !
⏰ We’re analyzing BTC on the 1-hour timeframe timeframe .
👀 On the 1H timeframe of Bitcoin, we can see that BTC moved upward after breaking through its taker-seller zone, with the breakout fueled by high volume and a whale candle. A strong resistance has now formed at $113,000, while a solid support floor is holding at $110,400. With today’s news, one of these levels is very likely to break. Keep in mind, today’s news is extremely important—if it turns out positive for crypto, the market could push higher and start a strong bullish leg.
⚙️ The RSI key zones are at 50 and 70. If volatility increases and momentum crosses above these levels, Bitcoin could kick off a strong move.
🕯 The size and volume of green candles have increased, building a very solid support around $110,400. Price is currently sitting in a resistance area, and with the NFP release we could see strong candles forming with high volume.
📊 On the 1H timeframe of Tether dominance (USDT.D), we see that after its recent bullish leg, it formed a trendline which has now been broken, followed by a pullback. Currently, USDT dominance is sitting at a very important support floor. If this floor breaks, a significant amount of Tether could flow into Bitcoin and altcoins.
🔔 The alarm zones for Bitcoin are set at $113,000 and $110,400—these are the levels to watch and place alerts on. Since we have the NFP news release today, a potential whale move is likely. If you’re planning to trade the news, define a small risk, use trigger orders, and make sure to apply strict risk management!
❤️ Disclaimer : This analysis is purely based on my personal opinion and I only trade if the stated triggers are activated .
BTC/USDT Crypto Heist - Bullish Breakout Blueprint!🔥 Thief Trading Style: BTC/USDT Bullish Heist Plan 🔥
Greetings, Money Makers & Market Robbers! 🤑
Ready to execute a daring heist in the Bitcoin vs. Tether (BTC/USDT) crypto market? 📈 Our Thief Trading Style combines technical precision and fundamental insights to target a bullish breakout. Follow this charted strategy to ride the wave and exit before the risky Red Zone. Let’s grab those profits together! 💪🎯
---
📊 Trade Setup: The Heist Plan
- Market: BTC/USDT (Crypto) 🌐
- Bias: Bullish Breakout 🌟
- Timeframe: 1D (Swing Trade) ⏰
Entry 📈:
- Breakout Entry: Wait for a clean breakout above the Moving Average (MA) at 108000. Place Buy Stop orders just above 108000 to seize the momentum. 🚀
- Pullback Entry: For lower-risk entries, set Buy Limit orders at the recent 15M/30M swing low (e.g., 105000-106000) to catch pullbacks. 📍
- Trader Tip: Set a TradingView alert for the 108000 breakout to stay ahead of the move! 🔔
Stop Loss 🛑:
- Breakout Traders: After the breakout confirms, place your Stop Loss below the recent 1D swing low at 96000 to guard against reversals. ⚠️
- Pullback Traders: Tailor your Stop Loss to your risk appetite (e.g., 1-2% of account). Adjust based on lot size and multiple orders. 📏
- Risk Alert: This heist is high-stakes! Stick to disciplined position sizing to protect your capital.🔥
Target 🎯:
- Aim for 122000, near the risky Red Zone (an overbought area prone to consolidation or reversal). 🏴☠️
- Exit Strategy: Consider taking profits early if bearish signals (e.g., high volume, reversal candles) emerge near 122000. 💸
Scalpers 👀:
- Stick to Long-side scalps with tight trailing stops. Join swing traders for the full heist or scalp quick moves if your capital allows. 💰
---
📡 Why This Heist Has Potential
BTC/USDT is in a neutral trend with strong bullish prospects, driven by:
- Technicals: A breakout above the 108000 MA, backed by higher lows on the 1D chart, signals robust momentum. 📊
- Fundamentals: Institutional buying and positive crypto sentiment (check COT reports) fuel upside potential. 📰
- Seasonal Trends: Bitcoin often rallies in Q2, aligning with our setup. 📅
- Intermarket Factors: USD weakness and altcoin strength could lift BTC higher. 🌎
---
⚠️ Risk Management: Secure Your Gains
- News Caution: Skip new trades during major news events (e.g., CPI, FOMC) to avoid volatility spikes. 🗞️
- Trailing Stops: Use trailing Stop Loss to lock in profits as price nears 122000. 🔒
- Position Sizing: Limit risk to 1-2% of your account per trade for a safe heist. 🚨
---
💥 Power Up the Heist! 💥
Join our Thief Trading Style crew by liking, commenting, and following for more high-energy trade plans! 🚀 Your support strengthens our market raids, helping us profit with precision. Let’s conquer BTC/USDT together! 🤝🏆🎉
Stay Sharp: Another heist plan is on the horizon. Keep your charts locked and loaded, traders! 🐱👤😎
#BTCUSDT #Bitcoin #Crypto #Bullish #SwingTrading #Breakout
