“BTCUSD Road to 120K – But Watch the Trap Ahead!”“BTCUSD 🚀 Road to 120K – But Watch the Trap Ahead!”
Bitcoin has shown strong momentum after a liquidity sweep around 108,000, signaling that big players collected orders before pushing price higher. This is a common smart money concept (SMC) move where liquidity is grabbed before the next leg.
🔑 Key Points to Note:
Previous Support Flip: Market reclaimed the broken support, turning it into a base for continuation.
Upside Target: The next major resistance zone is 120,000 – 123,000, where sellers are likely to step in.
Market Behavior: Price often sweeps liquidity before testing strong resistance, so patience is key.
Potential Pullback: Once resistance is tapped, a correction may follow as profit-taking starts.
📌 Educational Takeaway: Always watch how price reacts at liquidity zones and key resistance points. These levels often decide whether the trend will continue or reverse.
📈 For now, short-term bias = bullish toward 120,000, but be cautious for a possible rejection at that zone.
BTCUSDT

TradeCityPro | Bitcoin Daily Analysis #168👋 Welcome to TradeCity Pro!
Let’s move on to the Bitcoin analysis. Yesterday Bitcoin made an upward move and has now reached an important zone. Let’s see how the market wants to react to this resistance.
⏳ 1-Hour Timeframe
Yesterday Bitcoin briefly faked a breakout of its trendline but then broke it again and also activated its trigger.
🔍 Currently, the price has reached the resistance zone and is trying to penetrate it. The volume has increased throughout this upward move, which shows the strength of the buyers.
📊 If you opened a position with the triggers we had, now is not a bad time to take some profit and secure your position. But definitely leave a portion of it open so that in case the zone breaks, you won’t be left without a position.
🔔 Even with the breakout of this zone, a new long position can be opened. This zone has a lot of sell orders, and if the price manages to push through them, it can begin a sharp upward move.
💥 The RSI oscillator is stabilizing above the 64.09 level, which is a very good sign for buyers and increases the probability of breaking the zone.
✔️ However, if this RSI level fakes out, the chance of rejection from the zone rises, and in that case, the price correction can continue down to the 110721 and 109577 levels.
❌ Disclaimer ❌
Trading futures is highly risky and dangerous. If you're not an expert, these triggers may not be suitable for you. You should first learn risk and capital management. You can also use the educational content from this channel.
Finally, these triggers reflect my personal opinions on price action, and the market may move completely against this analysis. So, do your own research before opening any position.

BTC 1H Analysis - Key Triggers Ahead | Day 31💀 Hey , how's it going ? Come over here — Satoshi got something for you !
⏰ We’re analyzing BTC on the 1-hour timeframe timeframe .
👀 On the 1-hour timeframe of Bitcoin, we can see that after activating the alarm zones we had mentioned in previous analyses, Bitcoin moved upward and is now in a range and compression in its multi-timeframe structure, which with the New York session open could break out of this compression.
⚙️ The key RSI zones are 64 and 50. Once the oscillation limit crosses these zones, Bitcoin could break out of this compression. Preferably, follow long trades when the oscillation limit is crossed.
🕯 The size of green candles on the 1-hour timeframe is almost getting bigger with increasing volume. We are in a relatively important zone where, with the increase of candle size and volume, Bitcoin could move upward.
📊 On the 1-hour timeframe of USDT.D , we can see that after losing the 4.44% zone and the buyers’ money running out, it has faced a temporary trend weakness. With the New York session open, it could continue its decline. Notice that Tether dominance is also in a compression state both in terms of volatility and the RSI oscillator, in a decision-making mode. Confirmation of breaking the 4.44% zone could mean the loss of the 38 support level.
🔔 The trading alarm zones for Bitcoin are at $111,664 for long and $110,666 for short. Preferably, I’m not considering short trades these days, but I do think about opening a long position on a pullback or breakout of $111,664, and if the price action behavior suits such a trade, I will take action.
❤️ Disclaimer : This analysis is purely based on my personal opinion and I only trade if the stated triggers are activated .


#BTC/USDT Bullish Divergence on 1H, Low Risk Trade#BTC
The price is moving within a descending channel on the 1-hour frame, adhering well to it, and is poised to break it strongly upwards and retest it.
We have a bearish trend on the RSI indicator that is about to be broken and retested, supporting the upside.
There is a major support area in green at 108062, which represents a strong basis for the upside.
For inquiries, please leave a comment.
We are in a consolidation trend above the 100 Moving Average.
Entry price: 108450
First target: 108959
Second target: 109541
Third target: 110325
Don't forget a simple matter: capital management.
When you reach the first target, save some money and then change your stop-loss order to an entry order.
For inquiries, please leave a comment.
Thank you.

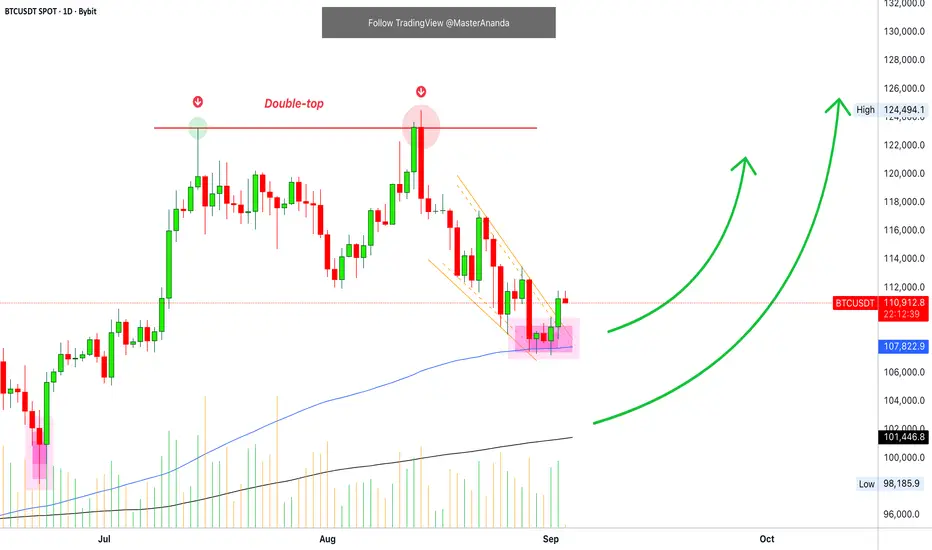
Bitcoin Daily MACD & RSI, Most Likely Scenario & How To TradeTo many people Bitcoin is mixed right now or even bearish. The $125,000 price tag is the cycle top and we are due a massive bull market.
To me, Bitcoin is bullish and more growth is definitely possible. If this is true, we should find some hints on the chart. If I am wrong, most of the signals should point lower. It would be impossible to fine dozens of bullish signals on this chart.
Let's read the chart and see what happens.
Bitcoin's daily RSI doesn't look great but we have an interesting signal, let me show it to you. And the indicator right now leans more bullish rather than bearish. We are looking at the daily timeframe.
BTCUSDT (D) RSI
There was a low 22-June followed by a bullish move. The next major low happened very recently, late August.
Notice how the late August low managed to reached below the 22-June low, a lower low. A weak one so it can also be considered a double-bottom.
BTCUSDT is quite different. 22-June we had a low $98,186. In Late August, the lowest Bitcoin did was $107,250; a higher low.
This is a classic hidden bullish divergence. This signal is not very strong but it is a start. A divergence can show up for weeks or even months before it reflects on the price.
The fact that Bitcoin continues to trade above $110,000 more than 52 days after peaking is also positive. But these are not definitive signals, it is more of a mix.
The MACD is in a different situation, trading within the bearish zone with a bullish bias. The bullish bias comes from the fact that the MACD is rising after hitting the lowest point since March—but it can still move lower before recovering.
BTCUSDT (D) MACD
In March Bitcoin was bearish and crashing as the 2025 correction low happened on the 7th of April. So it is the first time the MACD moves below zero after the April recovery.
See the MACD chart. First there is a drop and once a low is hit we get a small bounce, the bounce is followed by a new drop and then the indicator starts to rise.
While the MACD bottomed in March, Bitcoin bottomed in April, this is the classic lag, a lagging indicator.
The MACD can bottom anytime and as it hits bottom, we know what follows is a wave of growth even if it takes a while to show up on Bitcoin's price.
Bearish Signals
The double-top is a bearish signal but this one has been consumed with the recent down-move. Bitcoin can indeed move lower but this isn't a necessity, not a market compulsion. If Bitcoin continues lower, we know this is only short-term based on the other signals we are seeing.
The RSI is still below 50 even if rising. The MACD is in the bearish zone even if it is starting to turn. We need strong signals and strong indicators to confirm a major advance.
Conclusion
Bitcoin is likely to continue growing short-term, mid-term and long-term. On the very short-term, say one to two weeks, anything is possible. On this very short time horizon Bitcoin can easily crash according to the chart.
Most Likely Scenarios
More sideways, more neutral, more bearish action followed by growth.
Bitcoin is likely to continue in this kind of mixed period for sometime. If we consider the bigger picture, we are still locked within the $100,000 and $125,000 price range.
For LONG or SHORT, wait for the trend.
For spot accumulation, focus on the altcoins.
For Bitcoin, the best is to wait. The time to buy was when prices were below $100,000 or $90,000. There are better choices right now.
The next time to buy is when the signals become really strong, or when prices are trading at support. It all depends on your trading style, risk tolerance and your goals of course.
Do not be distracted by market noise. When we focus on the short-term, we tend to miss the bigger picture. The truth is that the most money is made when the market is in a trend.
Since we are in a bull market, we wait for support and go LONG. When the bull market is over, each time there is a bounce or a price advance it becomes an opportunity to go SHORT.
We trade in the same direction of the market.
Thanks a lot for your continued support.
Namaste.
BTCUSD 15M Setup – Short-Term Bearish StructureBitcoin is showing signs of exhaustion after testing resistance near 111.4K. The reaction at this level will decide the next major move.
🔹 Bearish Scenario (Main Bias)
Price tapped into a supply zone / resistance cluster and failed to break higher.
Market structure suggests a potential series of lower highs → lower lows forming.
Key downside targets to watch:
110.68K → 110.20K
109.90K → 109.30K
Deeper liquidity levels around 108.70K → 107.70K
🔹 Bullish Contingency (Alternative)
If BTC breaks and sustains above 111.43K, shorts are invalidated.
A clean break and retest could open the way toward 111.9K+.
⚡ Trading Plan
Stay patient: look for a rejection and confirmation at resistance before shorting.
Manage risk tightly — this zone could still produce a fakeout for liquidity grabs.
Shorts are favored unless bulls reclaim 111.43K convincingly.

Bitcoin · The Correction Is OverI will show you only two signals supporting the end of the current retrace/correction, it was a long one when you consider that the market is bullish.
I think you will agree with me but we will only know in the comments section.
Join me. Sit back, relax and enjoy the show.
Good evening my fellow Cryptocurrency trader, I hope you are having a wonderful day.
The last retrace between May and June lasted a total of six candles; counting the peak high candle as part of the retrace.
The current retrace has eight candles so far; 33% more than the previous retrace.
Consider a strong correction by looking at January 2025, it goes for months and three red sessions would produce a very strong price decline.
Consider also March 2024. A strong correction lasted five months.
Now, compare these two to the ones I just mentioned above. Here the difference between a correction and a retrace is very strong.
The second telling signal is the fact that Bitcoin continues trading above $100,000. We have 1.5 months of bearish action and yet no major support zone has been broken when we consider the long-term.
The next major support is found at $102,000. This level has not even been tested and likely won't be tested if Bitcoin continues with the same type of action we are seeing today.
Trading volume is very low. Before a major drop, somewhere at some point a strong selling volume bar shows up. This isn't present on this chart.
The biggest volume bar after the previous correction's low was a bullish day. This reveals the fact that the bulls have the upper hand.
Now, don't get me started on the altcoins...
The best is yet to come.
Namaste.

96K --- 152K --- 76K
In a bull market Fibonacci extensions usually target the 2.618 level which is around 152,000$.
The target of the 4th internal wave of the 5th wave, which is the last upward wave, is 96,000$.
When the 5th and last upward wave ends, I expect this rising parallel channel to break down and head towards the lower Fibonacci channels.
I think Bitcoin will enter a long-term uptrend again, especially after 70,000$ levels.
* The purpose of my graphic drawings is purely educational.
* What i write here is not an investment advice. Please do your own research before investing in any asset.
* Never take my personal opinions as investment advice, you may lose your money.

Is usoil still bullish?
Hi my dears
How are you?
Usoil seems to have the potential to move higher. I think it has the potential to reach $65.80 in the coming weeks if and only if the conditions in the picture are met.
What do you think?
Check out my analysis.

Btc looks bearish Bitcoin bears were successful in forming a new lower high during this small time frame down trend. If we do not close above 110k bitcoin will remain bearish.
Next support :- 105k and 100k

BTC Macro Top or Supercycle Ahead?Bitcoin’s long-term price action, alongside the monthly RSI, shows a repeating pattern at major cycle tops. Historically, whenever the RSI reached the descending resistance trendline (Above 85 level) , Bitcoin entered a cycle peak followed by a correction.
Currently, the RSI is once again approaching this key level, raising the question of whether history will repeat or if BTC can finally break through this long-term resistance.
Historical Pattern:
🔷 2013: RSI touched the upper trendline → BTC entered a cycle peak, followed by a deep correction.
🔷 2017: Once again, RSI hit the resistance → marked the bull market top.
🔷 2021: RSI faced rejection at the same line → led to a prolonged bear market.
Now, in 2025–2026, RSI is climbing back toward this resistance level, and the big question remains: Will Bitcoin break the cycle, or repeat history?
Key Points:
🔶 CRYPTOCAP:BTC has respected this RSI downtrend at previous market cycle tops (2013, 2017, 2021).
🔶 Price is trading near all-time highs while RSI nears historical resistance.
🔶 A breakout above this RSI trendline could signal a new phase of strength.
🔶 A rejection would suggest another cyclical cooling phase.
Conclusion
Bitcoin is at a macro decision point. For over a decade, this RSI trendline has defined cycle tops. A confirmed breakout would mark a historic shift in BTC’s market structure, while another rejection could mean history repeats.
Cheers
Hexa
BITSTAMP:BTCUSD BINANCE:BTCUSDT BINANCE:BTCUSDC

Bitcoin (BTC/USDT) Trade Setup🚀 BINANCE:BTCUSDT Trade Setup 🚀
📉 After a sustained downtrend inside a parallel channel, BTC has finally broken out with bullish momentum. Currently, price is hovering around the 111K zone.
🔑 Key Levels:
Support: Channel retest zone (110K – 109.5K)
Resistance: 113K – 114K
Next Major Target: 116K – 118K 🎯
⚡ Trading Plan:
If BTC successfully retests the channel breakout and flips the resistance into support ✅, we could see a massive upside move (potential Elliott Wave structure forming 🔄).
🔥 Confirmation of strength will come once BTC breaks & sustains above 113K with volume.
This could trigger a huge pump towards Wave 3 & Wave 5 targets 🚀💎
🛡️ Risk Management: Place SL below 109K support to protect against false breakouts.
📈 Summary:
BTC breakout + possible retest = high probability bullish setup 📉➡️📈.
Keep an eye on volume and channel validation before entering.

POL/USDT Trade Idea💎 BINANCE:POLUSDT Trade Idea 💎
📊 Pattern spotted: Double Bottom ✅
This setup indicates strong support around 0.2800 and signals a possible bullish reversal.
⚡ Entry (Advanced): 0.2860 – 0.2870
🎯 Target (TP): 0.2960
🛡️ Stop Loss (SL): 0.2800
✨ Risk/Reward: Low Risk – High Profit 🚀
This is an advanced entry with tight SL and strong upside potential.
📈 If the neckline breaks and sustains above, we can expect a bullish move towards the target.
🔑 Summary: Double Bottom gives confidence of reversal 📉➡️📈. Perfect setup for traders who like low loss & high reward opportunities.

#BTC/USDT Bullish Divergence on 1H, Low Risk Trade#BTC
The price is moving within a descending channel on the 1-hour frame, adhering well to it, and is poised to break it strongly upwards and retest it.
We have a bearish trend on the RSI indicator that is about to be broken and retested, supporting the upside.
There is a major support area in green at 108062, which represents a strong basis for the upside.
For inquiries, please leave a comment.
We are in a consolidation trend above the 100 Moving Average.
Entry price: 108450
First target: 108959
Second target: 109541
Third target: 110325
Don't forget a simple matter: capital management.
When you reach the first target, save some money and then change your stop-loss order to an entry order.
For inquiries, please leave a comment.
Thank you.

BTC 1H Analysis - Key Triggers Ahead | Day 30💀 Hey , how's it going ? Come over here — Satoshi got something for you !
⏰ We’re analyzing BTC on the 1-hour timeframe timeframe .
👀 On the 1-hour timeframe of Bitcoin, we can see that after activating our alarm zone, Bitcoin moved toward the top of the channel and then got rejected from this area. There is a resistance in the 1-hour timeframe at the price of $110,450, and by breaking this level Bitcoin can move upward.
⚙️ We have 2 key RSI zones at 38 and 64, and if the fluctuation limit passes these numbers, Bitcoin can experience either a corrective move or the continuation of the bullish leg.
🕯 The size of the green candles has grown and their volume has increased. This happened with the end of August and the beginning of September. With increased buying volume and positive news results in favor of crypto, Bitcoin can make another move upward. News has a very direct impact on our inflows and outflows.
📊 On the 1-hour timeframe of USDT.D , we can see that it is moving inside a box with a top at 4.56% and a bottom at 4.47%. By breaking out from either side of the box, it can bring strong trading volume. Notice that Tether dominance is currently pulling back to the midline of the box. By breaking the midline and stabilizing above this area, Bitcoin may face more selling pressure. By getting rejected from this area and losing the bottom, our long position trigger for Bitcoin can be activated.
🔔 The alarm zones specified for Bitcoin are at $110,450 and $107,800. By observing behavior in these areas we can trade. Personally, with the breakout of $110,450 along with a 15-minute indecision candle, I will try to take a position. Note that Bitcoin can make a pullback to its midline box and then bounce upward. If the midline is lost, this scenario will be invalid.
❤️ Disclaimer : This analysis is purely based on my personal opinion and I only trade if the stated triggers are activated .

TradeCityPro | Bitcoin Daily Analysis #167👋 Welcome to TradeCity Pro!
Let’s go for Bitcoin analysis, Bitcoin has finally broken out of the box it was in. Let’s see what positions it can give us today.
⏳ 1-Hour Timeframe
Yesterday Bitcoin broke the 109577 level and the trendline that it had in the higher timeframes, and now it has reached the resistance of 110721.
⭐ We have not yet received confirmation of the trendline breakout because no volume has entered the market, and the price has not made higher highs and higher lows, so it can still be said that the trendline is not yet broken.
📊 If volume starts to increase and the 110721 ceiling is broken, we get confirmation of the breakout of this trendline. If RSI also breaks the 64.09 level, we can take momentum confirmation from it.
💥 With the breakout of 110721, a long position can be opened on Bitcoin. If Bitcoin dominance continues its upward movement, this position can be very attractive, but if dominance starts to drop, altcoins will be a much better option.
🔽 For a short position, a fakeout of this upward movement and price stabilizing below the 109577 level would be a good trigger for a fakeout, and in the lower timeframes, we can open a short position with price stabilizing below 109577.
❌ Disclaimer ❌
Trading futures is highly risky and dangerous. If you're not an expert, these triggers may not be suitable for you. You should first learn risk and capital management. You can also use the educational content from this channel.
Finally, these triggers reflect my personal opinions on price action, and the market may move completely against this analysis. So, do your own research before opening any position.

Bitcoin 2017 vs. 2025Bitcoin top not is in.
CRYPTOCAP:BTC as seen in 2017, in the stage before its parabolic rise.

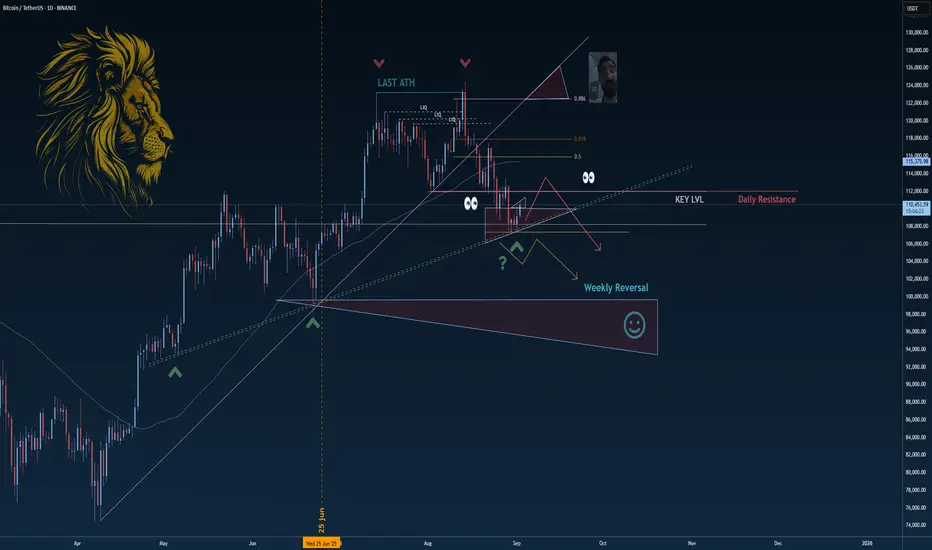
Bitcoin Price Action Explained: Multi-Timeframe Strategy (No BS)Welcome back, it’s Skeptic from Skeptic Lab.
This is Episode 15, and today I’m breaking down Bitcoin across multiple timeframes using pure price action — no noise, no hype. We’ll cover:
Weekly cycle & trend (HWC confirmation)
Daily structure: support, resistance & potential correction
Spot triggers from trendline & breakout setups
4H & 1H futures triggers with confirmation methods
Risk management puzzle (position size, SL, targets)
Bitcoin dominance vs altcoins (ETH, etc.)
My goal is simple: show you clear and actionable triggers with the right risk management so you can trade with confidence — not emotions.
This content is for educational purposes only and not financial advice.
👉 If you haven’t yet, check out my Ethereum analysis where our last trigger gave us +80% with no leverage.
Stay skeptical. Trade smart.
Peace out ✌️

BTC IdeaBTC has broken out of the falling channel after retesting the $108.5K demand zone and is now showing signs of strength above $110K.
If buyers shows strength, BTC can push higher towards $112,000 - $115,000. But if momentum weakens, it may fall back to test the demand zone again.

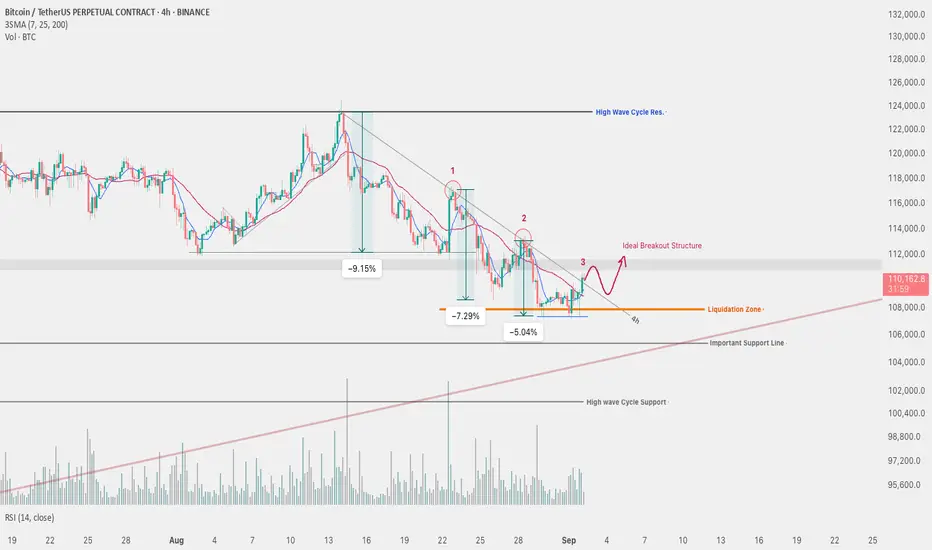
Sep 2, 2025 - Daily BTCUSDT Chart Analysis-03Following yesterday’s analysis, Bitcoin has now tested the mid-term descending trendline for the third time. It’s hard to say whether the last 4H candle has actually closed above this trendline. However, I don’t consider this as a confirmed breakout yet — for me, a breakout should be confirmed by market structure, not just by a single candle close.
So today, I’ll be watching Bitcoin’s reaction to this trendline closely.
If price gets rejected, I expect it to drop toward the **liquidity zone** I’ve marked, collect liquidity there, and then potentially continue its downward move.
📌 Summary
* I will not take any long positions until I see a confirmed breakout in structure.
* If Bitcoin gets rejected from the trendline, I’ll look into short setups on altcoins، depending on Bitcoin dominance.