Bitcoin Buy setupHi everyone.
I think these two areas have a good potential to take at least 1:1RR profit.
I've set orders in these areas.
Lets see what happens.
Dear traders, please support my ideas with your likes and comments to motivate me to publish more signals and analysis for you.
Best Regards
Navid Nazarian
BTCUSDT

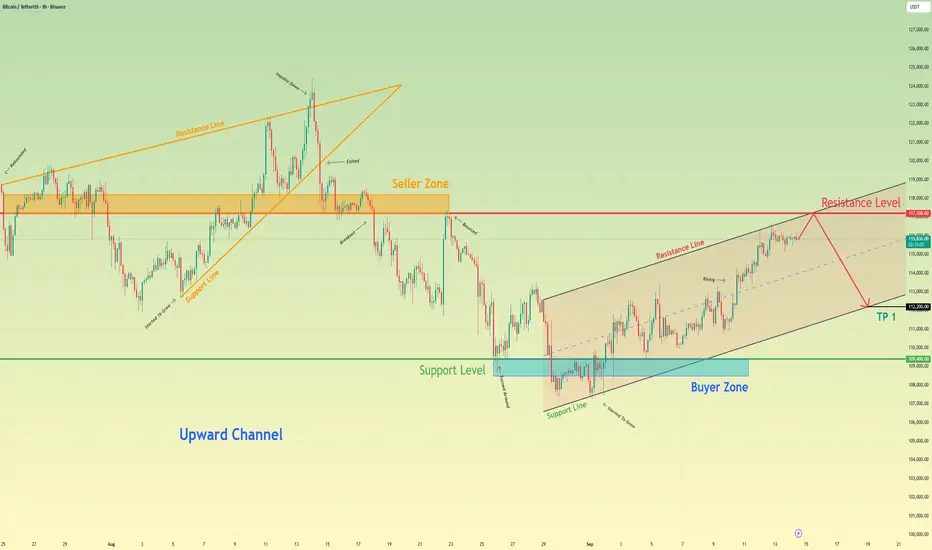
Bitcoin will start to correction after touching resistance levelHello traders, I want share with you my opinion about Bitcoin. The established market structure for Bitcoin remains bullish, with the price action being methodically guided higher within a well-defined upward channel. This pattern has been in effect since the resolution of a prior upward wedge, creating a clear sequence of higher highs and higher lows between its support and resistance lines. The price of BTC has just completed another full rotation from the channel's support and has now arrived at a critical inflection point. Currently, the asset is directly testing the upper boundary of the channel, a level which forms a powerful confluence of resistance with the horizontal 118200 - 117200 seller zone. The primary working hypothesis is a short, corrective scenario, based on the high probability that the channel's resistance will be respected. A confirmed rejection from this area would signal that the current upward impulse is exhausted and a downward rotation towards the channel's support is underway. Therefore, the TP for this rotational play is logically placed at 112200 points. This target aligns perfectly with the ascending support line of the channel, representing the most probable objective for a corrective move of this nature. Please share this idea with your friends and click Boost 🚀
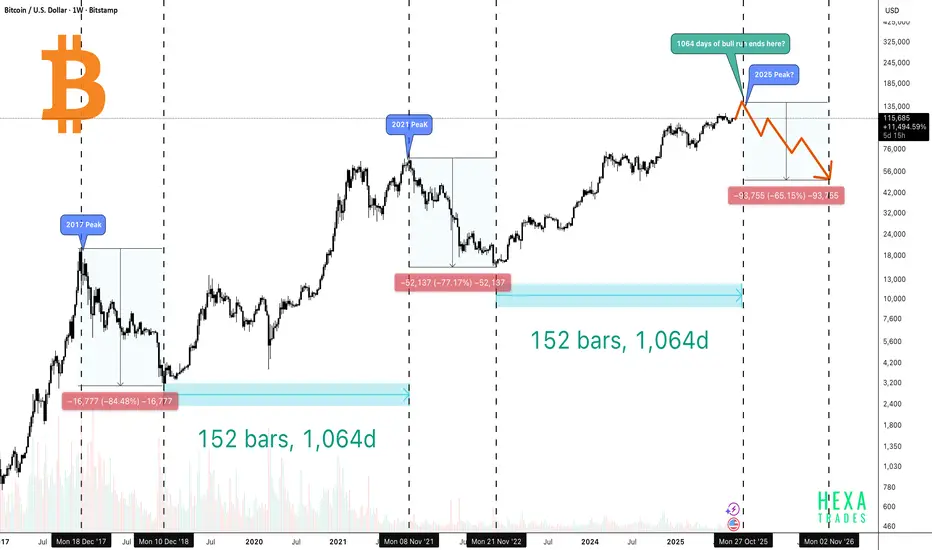
Bitcoin Peak Coming in 45 Days?The above chart compares Bitcoin’s previous market cycles (2017 and 2021) with its current trajectory in 2025, aiming to identify whether history might be repeating. It highlights how long Bitcoin’s bull runs last, how steep the crashes are afterward, and when the next peak and correction could happen.
🔶 2017 Peak
- Bitcoin topped out in December 2017.
- After the peak, BTC crashed by -84%, dropping from around $20K to nearly $3K.
- The bear market lasted about 1 year of decline, followed by roughly 1,065 days of bull run from the bottom before a new cycle peak.
🔶 2021 Peak
- Bitcoin peaked again in November 2021.
- Price fell by -77%, retracing from nearly $69K to about $15K.
- Similarly, the downturn lasted around 1 year of drop, and the recovery phase extended for about 1,065 days of bull run from the bottom.
🔶 2025 Peak?
- If the pattern repeats, the next top could align around late October 2025 and reach the $140K–$150K range.(1,064–1,065 days from the December 2022 bottom).
- In every cycle, Bitcoin’s crash percentage has decreased, suggesting the asset is maturing. If this pattern repeats, we could see a 60–70% drop, pushing the price back toward the $40K–$60K range.
Conclusion
Bitcoin’s historical cycles suggest a repeating rhythm of 1 year of decline followed by ~3 years of recovery and growth. Both the 2017 and 2021 cycles lasted about 1,065 days from bottom to top, with each new bull run setting higher all-time highs and each crash becoming less severe.
If this pattern continues, Bitcoin could potentially reach the $140K–$150K range by late October 2025, before facing another correction in the 60–70% range, possibly pulling the price back to the $40K–$60K zone.
While the market shows signs of maturity with institutional adoption and reduced crash percentages, history reminds us that sharp corrections often follow euphoric peaks. For long-term investors, the lesson remains clear: cycles repeat, but opportunities also return.
Today's BTCUSD Market AnalysisBTCUSD has shown little overall change compared to yesterday, with the broader market structure remaining intact. The support level remains firm, while esistance level continues to be concentrated in the 117,000–118,000
Buy 114500-115000
TP 115500-116500-117500
Daily-updated accurate signals are at your disposal. If you run into any problems while trading, these signals serve as a reliable reference—don’t hesitate to use them! I truly hope they bring you significant assistance


#BTC: AI Review of the Trading Week Start. 2025/09/15Aloha, blockchain masters and trend tamers! NeuralTraderingPro is back to charge you up with insights for the new trading week. 🚀 Monday, September 15th, kicked off with a sharp move, and it's exactly what I warned you about on Sunday. Let's break down who drew first blood this week and what to expect from a market that's holding its breath for the main event: the Fed meeting.
📜 FORECAST REVIEW: THE BEARS STRIKE FIRST
My forecast from yesterday played out with surgical precision. I wrote that before heading higher, the market might trigger a "false move down to sweep liquidity." That's exactly what happened last night! The breakout from the tight consolidation was to the downside, in favor of the bears. The price broke the $115,000 level (target 🐻) and momentarily pushed towards $114,200 (target 🐻🐻). The correction scenario, to which I gave a 45% probability, was the one to play out first. Congratulations to those who heeded the warning and were prepared for this turn of events! Now, the main question is: was this just a stop hunt before a new rally, or are the bears serious about seizing the initiative?
📊 CURRENT SITUATION: CHART AND INDICATOR ANALYSIS
Current Price: 114,772.5 USDT
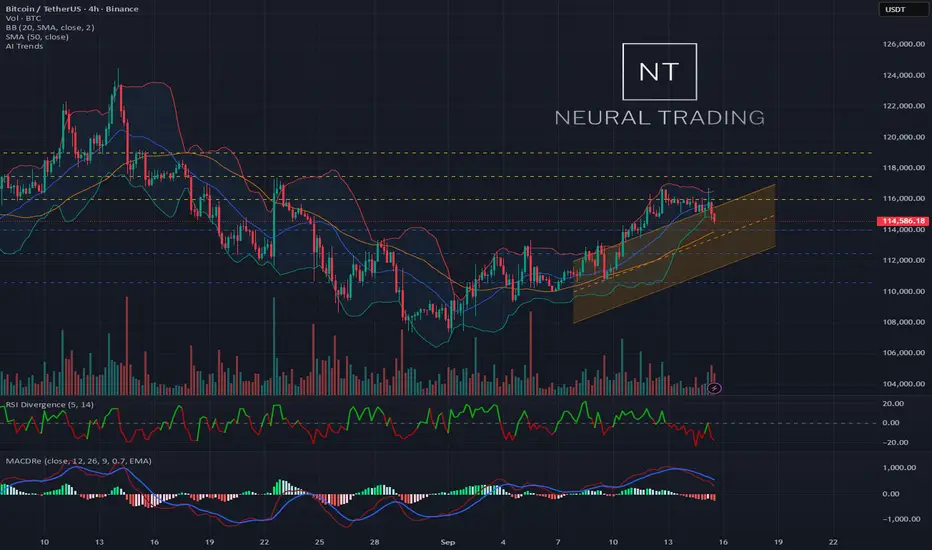
📈 Daily Chart (1D): Globally, the bullish trend is still intact. The price has corrected from the upper Bollinger Band and is now testing the support zone around the SMA 20 (blue line). The RSI has cooled off, dropping to 55, which alleviates local overbought conditions and creates room for a new move. The MACD histogram has started to decline, confirming the correction phase. The picture is "bullish, but in need of confirmation."
📉 4-Hour Chart (4H): Here, the bearish breakdown looks more apparent. The price has fallen below the SMA 20 and SMA 50, which may now act as dynamic resistance. The RSI is below the neutral 50 mark, indicating that sellers are currently in control. The MACD has crossed below the zero line—a classic bearish signal on this timeframe. The bull flag we discussed on Sunday was invalidated and broke to the downside.
⏱️ 30-Minute Chart (30m): On the lower timeframe, we see the full drama of the overnight drop. The price plummeted from ~115,800 𝑡𝑜 115,800 to 114,500 in just a couple of hours. The RSI dived into the oversold zone (below 30), from which it is now attempting to bounce. The Bollinger Bands expanded sharply and are now starting to contract, signaling that the downward momentum is fading and a short-term consolidation or bounce is possible.
📋 ORDER BOOK ANALYSIS: A WALL AT 114,750
The battle for initiative is unfolding at a key level.
🟢 Support Walls: The full force of the bulls is concentrated just below the current price. Note the colossal buy wall at 114,750 USDT—almost 12 BTC worth ~$1.36 million! This is rock-solid support that halted the overnight drop. There are a few more orders below, but this level is the main stronghold for buyers.
🔴 Resistance Walls: Sellers are responding with dense but less massive pressure. The largest sell order is right at the current price (5.2 BTC), and beyond that, liquidity is spread more thinly up to 114,825 USDT.
Conclusion: Buyers have built a formidable line of defense. Sellers will need to muster a lot of force to break through the wall at $114,750. As long as this wall holds, a bounce or sideways movement is highly likely.
📰 MARKET SENTIMENT AND KEY THEMES
The news background is filled with anticipation and caution. All eyes are fixed on one event.
🇺🇸 The Fed Meeting — The Event of the Week: This is the main theme. The market is frozen, awaiting the interest rate decision. Traders are citing key support and resistance levels that will remain relevant right up until the announcement. A hawkish tone from the Fed or a refusal to cut rates could trigger a new wave of selling. Conversely, dovish comments will give the bulls a green light.
🗓️ Bitcoin's Cyclicality: Some analysts suggest that September 17th could mark the beginning of a new local growth cycle for Bitcoin. This theory adds to the intrigue and could support buyers mid-week.
🐂 Long-Term Optimism: Despite the current correction, global forecasts remain positive. Analysts note the similarity of the current consolidation to patterns that have previously preceded powerful rallies and are predicting a potential surge to $125,000.
🇩🇪 European Outlook: German analysts from Kagels-Trading see today's trading range between $111,300 and $114,100, which supports the likelihood of a further test of lower boundaries after the recent drop.
🔮 FORECAST AND KEY TARGETS FOR THE WEEK (Sept 15-22)
The market is at an inflection point. On one hand, we have a bearish breakdown on the 4H chart. On the other, there's massive support in the order book and oversold conditions on the 30m chart. Most likely, leading up to the Fed announcement, we will see attempts at a bounce and a fight for the 114,750 - 116,000 range. The Fed's decision will be the trigger for the week's primary move.
Scenario Probability: Short 📉 (55%) / Long 📈 (45%)
🎯 Key Targets for the Coming Week:
Bullish Targets (if support holds and Fed news is positive):
🐂 116,000 USDT - A return to Sunday's consolidation zone, the first target for bulls.
🐂🐂 117,500 USDT - An important psychological level and the next stop.
🐂🐂🐂 119,000 USDT - Key resistance, a break of which would open the way to $120,000.
Bearish Targets (if support breaks and Fed news is negative):
🐻 114,000 USDT - A key round number just below the current support wall.
🐻🐻 112,500 USDT - A support zone that aligns with a previous analysis.
🐻🐻🐻 110,600 USDT - A strong support level and the potential low for the week.
💡 TRADING IDEAS
1. Long Positions — Betting on a Bounce
Long Idea 1 (Aggressive): Buy at current levels with a tight stop just below the support wall at 114,750. Target a quick bounce to 115,500 - 116,000. Stop-loss: 114,450 USDT.
Long Idea 2 (Conservative): Buy ONLY after a confirmed reclaim and hold above 116,200 USDT. This would signal that the drop was a false move. Targets: 117,500, 119,000 USDT. Stop-loss: 115,500 USDT.
2. Short Positions — Playing the Local Trend
Short Idea 1 (On a Retest): Sell on a bounce to the 115,500-115,800 zone, where the 4H SMAs are now located. Target: a retest of the wall at 114,750. Stop-loss: 116,250 USDT.
Short Idea 2 (On a Breakdown): Open a short position after a clean break and confirmed close below the support wall at 114,750 USDT. This would be a strong signal for continued decline. Targets: 112,500, 110,600 USDT. Stop-loss: 115,100 USDT.
🛡️ CONCLUSION AND RECOMMENDATIONS
The start of the week has set a nervous tone. The key recommendation is to avoid making hasty decisions before the Fed meeting. The market will have thin liquidity and be susceptible to manipulation. The safest tactic is to trade off strong levels: buy from the massive support at $114,750 or sell if it breaks. Always use stop-losses 🛡️, especially during periods of high uncertainty. Patience is your greatest asset right now.
May the profits be with you! 💰 Don't forget to like this analysis 👍 and subscribe to stay one step ahead of the market all week long!
TradeCityPro | Bitcoin Daily Analysis #177👋 Welcome to TradeCity Pro!
Let's dive into Bitcoin analysis, today’s analysis will be on the 1-hour timeframe since Bitcoin is in a corrective phase, and we’ll look at what triggers we can have for trading today.
⏳ 1-Hour Timeframe
After reaching the 116,619 level, the market entered a ranging phase and spent Saturday and Sunday consolidating below this level.
📊 Earlier today, before the London session, Bitcoin was rejected from 116,619, starting a bearish move with strong momentum and high volume, pushing price down to the 0.382 Fibonacci level for a correction.
⭐ If price finds support here, we can say the uptrend is still strong since it bounced from the first available support zone and started moving upward. In this case, a breakout above 116,619 would be a good long position entry.
🔍 But if the correction continues, the next support levels to watch are 0.5, 0.618, and 0.786 Fibonacci retracement levels.
✔️ The area between the 0.5 and 0.618 Fibonacci retracements forms a critical PRZ, and if price moves lower, this is one of the areas with a high probability of seeing a reaction.
❌ Disclaimer ❌
Trading futures is highly risky and dangerous. If you're not an expert, these triggers may not be suitable for you. You should first learn risk and capital management. You can also use the educational content from this channel.
Finally, these triggers reflect my personal opinions on price action, and the market may move completely against this analysis. So, do your own research before opening any position.

Bitcoin Roadmap | Short termBitcoin ( BINANCE:BTCUSDT ) has been experiencing a lot of volatility over the past 10 days, and the reasons for these movements could be the announcement of US indices + geopolitical issues Those who were in favor of Bitcoin caused Bitcoin to pump .
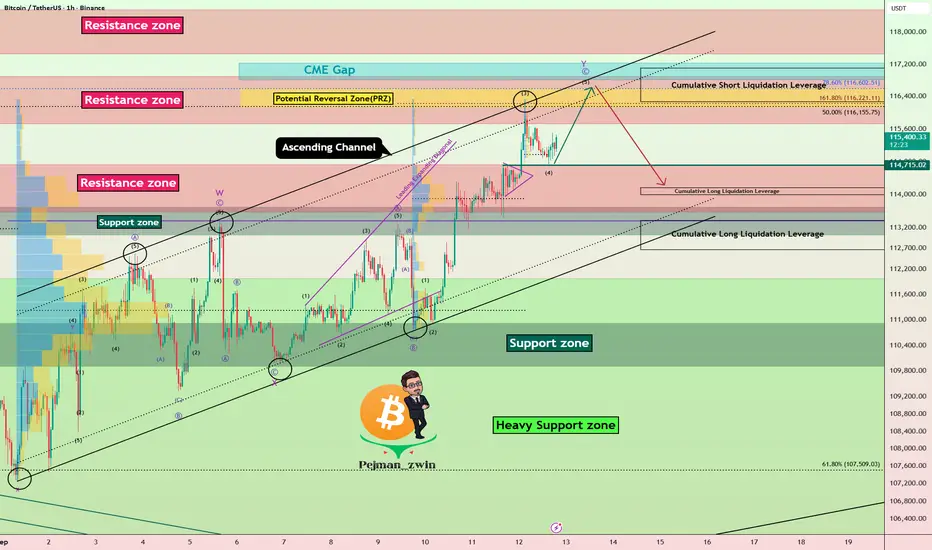
Bitcoin's movements over the past 10 days have managed to form an Ascending Channel .
In terms of Elliott Wave theory , Bitcoin appears to be completing microwave 5 of microwave C of the main wave Y .
I expect Bitcoin to try to complete main wave Y , and if we find signs of a reversal in the Resistance zone($116,900-$115,730) and Potential Reversal Zone(PRZ) , we can expect a further decline . Also, it is expected that the CME Gap($117,235-$116,820) will eventually be completed in the main wave Y .
Cumulative Long Liquidation Leverage: $114,165-$113,989
Cumulative Long Liquidation Leverage: $113,370-$112,664
Cumulative Short Liquidation Leverage: $117,102-$116,266
Please respect each other's ideas and express them politely if you agree or disagree.
Bitcoin Analysis (BTCUSDT), 1-hour time frame.
Be sure to follow the updated ideas.
Do not forget to put a Stop loss for your positions (For every position you want to open).
Please follow your strategy and updates; this is just my Idea, and I will gladly see your ideas in this post.
Please do not forget the ✅' like '✅ button 🙏😊 & Share it with your friends; thanks, and Trade safe.
Bitcoin - Will Support Hold?📢 NFX Market Update – COINBASE:BTCUSD
BITSTAMP:BTCUSD bullish rally recently hit resistance at $116,500, and price is now testing the $114,800 support zone. This level is acting as a strong psychological support, following the earlier break through the block order.
The key question: Will this support hold, or will price dip further toward the ascending channel support and the 200-day SMA?
My outlook: I believe support will hold. Price may briefly test lower levels - likely just a few wicks - before resuming higher.
🎥 More details in the video.

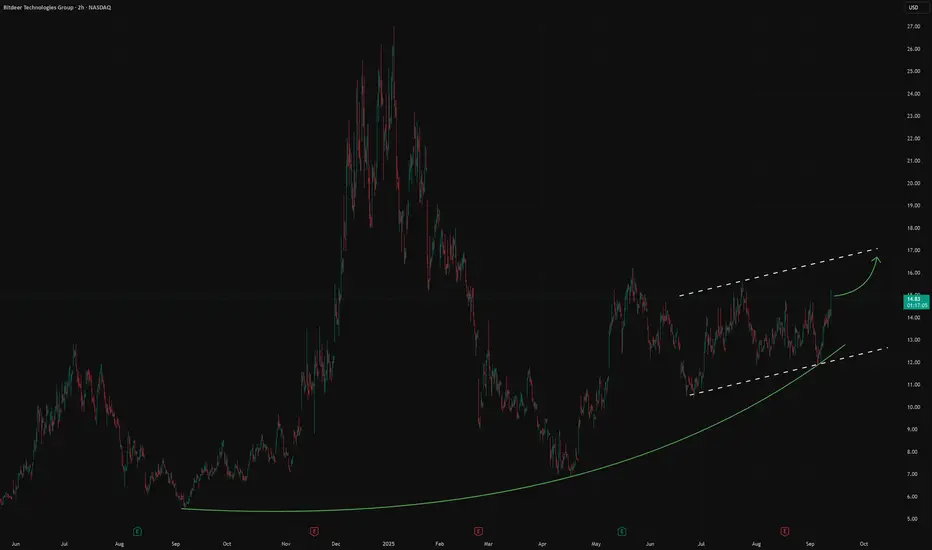
BTDR US ( Bitdeer Technologies Group) Long#Invest #US #BTDR #BTC #USDT
Bitdeer Technologies Group
Demonstrates Growth Through a Combination of Operational Improvements, Industry Trends, and Strategic Initiatives
Now, in order:
Bitdeer reported a significant 56.8% year-over-year revenue increase in Q2 2025 to $155.6 million. This growth was driven by a 42% increase in mining revenue and mining hardware sales
The company increased its monthly bitcoin mining volume by 45.6% in April 2025 compared to March
The rise in the price of bitcoin has directly impacted the profitability of Bitdeer's mining operations
Tether, the issuer of USDT , increased its stake in Bitdeer to 21.4% in March 2025, and then to over 24% in April
The company is actively expanding its energy and data center capacity. 361 MW of capacity has been commissioned since the beginning of 2025, with the total available electrical capacity reaching 1.3 GW. This is expected to increase to 1.6 GW by the end of the year
Bitdeer has confirmed that it is on track to reach its own hashrate of 40 EH/s by the end of October 2025, and plans to exceed this figure by the end of the year
The company is focusing on the SEALMINER A4 project, which aims to achieve unprecedented chip efficiency of around 5 J/Th
Bitdeer plans to set up a production line in the US
Bitdeer held 1,502 bitcoins (worth around $170 million at the time) at the end of Q2 2025, up significantly from 113 BTC the year before
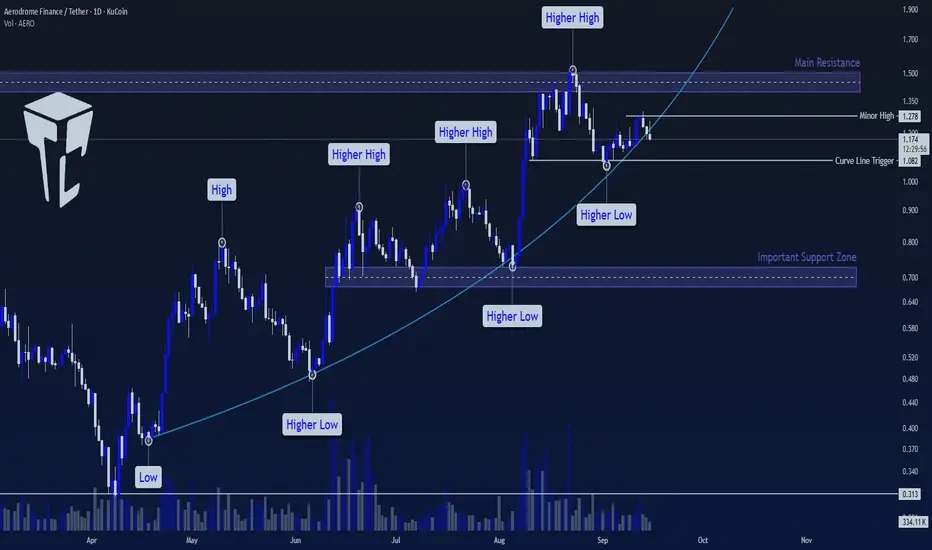
TradeCity Pro | AERO Testing Key Support on Curved Uptrend👋 Welcome to TradeCity Pro!
In this analysis, I want to review the AERO coin for you. It is one of the largest crypto DEX platforms that mainly operates in China Base and currently ranks 77th on CoinMarketCap with a market cap of $1.05 billion.
📅 Daily Timeframe
In the daily timeframe, we see an uptrend that has been moving sharply upward along a curved trendline.
⚡️ The main resistance for AERO is the 1.5 zone, which I have marked on the chart.
✔️ Price has touched this area once and has now returned to its trendline, forming a minor top at 1.278. If it gets rejected from this level and triggers 1.082, this level will turn into a major top.
🔍 Currently, the 1.082 level is a very good trigger for a short position. Breaking this level confirms the trendline break and could start a large corrective wave toward the next support zone.
✨ However, if the price forms a range box between 1.082 and 1.278, we can open an early long position after the breakout of 1.278. The main trigger for a long position or even a spot buy will be the breakout of the 1.5 zone.
📊 A positive sign for the uptrend is that volume has increased well during bullish waves and decreased during corrections. This indicates strong buyer momentum and is a bullish signal for the trend.
📝 Final Thoughts
Stay calm, trade wisely, and let's capture the market's best opportunities!
This analysis reflects our opinions and is not financial advice.
Share your thoughts in the comments, and don’t forget to share this analysis with your friends! ❤️
BTCUSD Market AnalysisObserving price movements, BTCUSD experienced a brief pullback lately after a wave of upward momentum, but the broader bullish structure stays intact. During this pullback, the underlying support proved effective, and the price subsequently rebounded. When it comes to upper resistance, the focus remains on the 117,000 to 118,000 interval.
Buy 114500-115000
TP 115500-116500-117500
Daily-updated accurate signals are at your disposal. If you run into any problems while trading, these signals serve as a reliable reference—don’t hesitate to use them! I truly hope they bring you significant assistance

Daily Market Analysis of BTCUSDFrom the observation of price movements, recently, after a wave of rise, BTCUSD has experienced short-term pullback, but the overall bullish structure remains intact. During the pullback, the support below was effective, and then the price rose again.
For upper resistance, the focus remains on the 117,000–118,000 USD range.
Buy 114500-115000
TP 115500-116500-117500
Daily-updated accurate signals are at your disposal. If you run into any problems while trading, these signals serve as a reliable reference—don’t hesitate to use them! I truly hope they bring you significant assistance

Bitcoin - Will Bitcoin break out of range?!Bitcoin is above EMA50 and EMA200 on the four-hour timeframe and is in its ascending channel. If the downward trend continues towards the specified demand range, we can buy Bitcoin with appropriate risk-reward.
Bitcoin’s rise to around 121,000 and its arrival at the specified supply range will provide us with its next selling position. It should be noted that there is a possibility of heavy fluctuations and shadows due to the movement of whales in the market and capital management in the cryptocurrency market will be more important. If the downward trend continues, we can buy within the demand range.
Bitcoin continues to fluctuate within the $110,000 to $117,000 range, as reduced capital inflows into ETFs combined with intensified profit-taking exert mounting pressure on its upward momentum. In this environment, the derivatives market—driven by the strong presence of futures and options contracts—plays a central role in balancing and shaping market direction. Profit-taking by 3–6 month holders, alongside losses realized by recent buyers at price peaks, has fueled selling pressure across the market.
On-chain liquidity still maintains a constructive structure, but signs of gradual weakening are evident. Meanwhile, net ETF inflows and outflows have declined to around 500 BTC per day, significantly undermining demand from traditional finance (TradFi), which had previously been a key driver of rallies in March and December 2024.
Following the mid-August all-time high, market momentum steadily weakened, dragging Bitcoin below the cost basis of recent buyers at the top and pushing the asset back into a range-bound structure. The critical question now is whether this reflects a healthy consolidation phase or the beginning of a deeper corrective cycle.
While dip-buyers provided some support, the primary selling pressure originated from experienced short-term holders. Data shows that 3–6 month holders have been realizing approximately $189 million in daily profits (based on the 14-day moving average), accounting for nearly 79% of total short-term holder realized gains. These figures indicate that many investors who entered the market during the February-to-May correction used the recent rally as an opportunity to lock in profits—creating considerable resistance against upward continuation.
In addition to profit-taking from seasoned short-term holders, recent peak buyers also capitulated by realizing losses during the pullback, further amplifying selling pressure. Alongside on-chain dynamics, assessing external demand through ETFs remains crucial, as these instruments have been pivotal in driving the current market cycle.
Since early August, net inflows into U.S. spot ETFs have sharply declined, currently averaging around 500 BTC per day (14-day moving average). This is far below the levels of capital inflows that had previously supported the bullish phase of the cycle, reflecting weakening momentum from TradFi investors. Given the central role of ETFs in fueling Bitcoin’s recent uptrend, the slowdown in flows makes the market’s current structure noticeably more fragile.
Meanwhile, blockchain-based prediction platform Polymarket has announced a new collaboration with Chainlink. The partnership aims to launch 15-minute crypto prediction markets featuring rapid settlement and industry-leading security standards.
The integration of Chainlink’s oracle technology with Polymarket’s trading infrastructure is expected to enhance user access to accurate and reliable data, delivering a new experience in short-term prediction markets. This collaboration could mark a turning point in the development of innovative trading instruments and price forecasting tools.

BITCOIN Looks Bullihs (4H)Based on the price structure, which has formed a bullish trend through small corrections, and also the lack of rejection from the resistances that have just been tested, along with a bullish CH and the formation of a supportive trendline, it is expected that Bitcoin will move close to its ATH or register a new ATH, and then enter a correction phase.
Considering the Tether dominance chart we published a few minutes ago, we expect Bitcoin to remain bullish until it reaches the specified red zone.
For risk management, please don't forget stop loss and capital management
When we reach the first target, save some profit and then change the stop to entry
Comment if you have any questions
Thank You

BTCUSD 4h- Bearish SetupBITSTAMP:BTCUSD is showing early signs of exhaustion after its recent push into the $116K zone. Multiple bearish confluences are aligning:
Price has rejected near the upper resistance band, signaling potential short-term weakness.
The last few candles show strong wicks to the upside, indicating selling pressure.
Current structure sits below the short-term resistance block, with buyers struggling to maintain momentum.
🔑 Fibonacci Retracement Targets (from recent swing move):
38.2% → $115,503
61.8% → $114,390
100% → $112,589
If downside momentum builds, these levels may act as supports and potential take-profit zones for shorts. Confirmation of rejection from the resistance zone could open the path lower toward the 61.8% and 100% retracement levels.
⚠️ Invalidation: A strong close above $117,305 would negate this bearish setup and reopen bullish continuation potential.

BTCUSDBTCUSD needs a correction or impulse here to the downside playing between 116-114K.
Disclosure: We are part of Trade Nation's Influencer program and receive a monthly fee for using their TradingView charts in our analysis.

TradeCityPro | Bitcoin Daily Analysis #176👋 Welcome to TradeCity Pro!
Let’s go for a different kind of Bitcoin analysis today. I’ve used a new color theme on the chart—let me know in the comments whether you like this theme or prefer the previous one.
⌛️ 4-Hour Timeframe
In the 4-hour timeframe, Bitcoin had formed a descending channel, moving lower with a bearish structure of lower highs and lower lows toward the 107,000 support zone.
✔️ After reacting to this support, price climbed toward the channel’s top. Following one false breakout, it managed to break the channel on the next attempt and moved toward the channel trigger at 113,222.
💥 This move came with rising volume, which boosted bullish momentum and increased the likelihood of breaking 113,222.
✨ With the breakout of 113,222, Bitcoin’s main upward wave began, and price is now heading toward the next resistance at 116,960, which it is already approaching.
🧩 Over the last few candles, volume has dropped significantly, mainly because it’s the weekend. If volume starts to pick up with the new week, the probability of breaking 116,960 will increase.
🔑 A breakout above 116,960 could serve as the next long trigger, while Bitcoin’s key major resistance remains at 121,188.
❌ Disclaimer ❌
Trading futures is highly risky and dangerous. If you're not an expert, these triggers may not be suitable for you. You should first learn risk and capital management. You can also use the educational content from this channel.
Finally, these triggers reflect my personal opinions on price action, and the market may move completely against this analysis. So, do your own research before opening any position.

BTCUSD Weekly Analysis– Are Bulls Ready for the Next Leg Up?Bitcoin (BTCUSD) closed this week at $115,822, gaining 4,659 points from the previous week.
📊 Weekly High: $116,805 | Weekly Low: $110,624
🔑 Key Levels to Watch Next Week
✅ Bullish Scenario:
If BTCUSD sustains above $116,000, we could see an exciting move towards the strong resistance zone of $119,140 – $119,800. A breakout above this level could open doors to fresh all-time highs in the coming sessions.
❌ Bearish Scenario:
A 1-hour close below $115,480 could trigger selling pressure, taking Bitcoin down to test key support at $113,760 (just ~1.5% lower from current levels).
🎯 Trading Plan / Strategy
Aggressive Bulls: Look for sustained price action above $116K before entering fresh longs.
Smart Bears: Watch for signs of rejection near $119K zones for a possible short opportunity.
Swing Traders: Use the $115,480 level as a pivot — whichever side it breaks, follow the momentum.
🧠 My Take
Bitcoin is looking strong after this week’s breakout, but the next move depends on whether bulls can hold $116K. A failure here might just give dip buyers another golden entry near $113,760 support.
💬 Let’s Talk!
What’s your view – are we heading to $120K next or are we due for a healthy pullback?
👇 Drop your thoughts, charts, and strategies in the comments — I’ll review and share my take on interesting ideas!

#BTC/USDT options market is bullish.#BTC
The price is moving within a descending channel on the 1-hour frame and is expected to break and continue upward.
We have a trend to stabilize above the 100 moving average once again.
We have a downtrend on the RSI indicator that supports the upward break.
We have a support area at the lower boundary of the channel at 114650, acting as strong support from which the price can rebound.
We have a major support area in green that pushed the price upward at 114400.
Entry price: 115152.
First target: 115476.
Second target: 115990.
Third target: 116633.
To manage risk, don't forget stop loss and capital management.
When you reach the first target, save some profits and then change your stop order to an entry order.
For inquiries, please comment.
Thank you.

$WLFI Breakout Watch.$WLFI/USDT has just broken out of its downtrend and successfully retested the support zone.
If it holds this level, the next move could push it toward $0.2880, about 31% higher from here.
DYOR, NFA

BTC H1-Chart Analysis📢 NFX Market Update – BITSTAMP:BTCUSD
A bullish divergence has formed on the H1 timeframe around $115,400, suggesting the likelihood of a short-term retracement in the next few hours.
More importantly, this setup points to the possibility that the breakout below the ascending triangle was a bear trap.
A decisive break and candle close above the 50% Fibonacci retracement (~$116,300) would confirm bullish trend continuation.

Bitcoin Ready To Moon Or Crash Crowd Mindset DecidesIs now the time to buy, or should we run away?
Why do most traders make the wrong move at the most critical moment?
Bitcoin today is not just an asset, it’s a live psychology test of the entire crowd.
Hello✌️
Spend 2 minutes ⏰ reading this educational material.
🎯 Analytical Insight on Bitcoin:
Bitcoin has convincingly broken above its three-week resistance with strong bullish momentum 📈. Trading volume is exceptionally high, suggesting a continuation toward new highs. The first target indicates a potential 7% gain, while the next major level could reach $124,000 🚀.
Now , let's dive into the educational section,
🧠 Greed The Hidden Enemy of Traders
Greed often begins with a simple thought: “Let’s hold a little longer, maybe it goes higher.” That single idea has wiped out millions of dollars in this market. In bull runs, crypto is designed to trigger this feeling. Green candles in a row, optimistic news, and analysts calling for unrealistic targets all convince traders to keep holding.
😨 Fear The Trigger of Wrong Sells
If greed traps you at the top, fear traps you at the bottom. The moment screens turn red, fear dominates. Panic spreads through news headlines, social posts, and rumors. Your mind wants to escape pain, so you smash the sell button.
🐳 Whales and Their Psychological Games
Whales are the best psychologists in the market. They know how the crowd thinks, fears, and reacts. By injecting sudden buy or sell pressure, they create fake moves that trigger thousands of liquidations.
For example, in futures markets whales often manipulate price just enough to hit stop-loss clusters. Retail traders believe “the market is against me,” but in reality they are against themselves. The whales don’t move price randomly they move it exactly where the crowd’s emotions are most vulnerable.
🔍 Why Technical Analysis Alone Is Not Enough
Indicators are great, but they can’t explain why you panic at support or get greedy at resistance. A trendline won’t tell you why you exit right before a reversal. Technical analysis is only the map; trading requires controlling emotions while driving on that map.
That’s why two traders can look at the same chart and get completely different results: one profits because he manages his psychology, the other loses because he doesn’t.
🚀 Ready for Explosion or Collapse?
Right now Bitcoin stands at a turning point. Macro news, trading volumes, and the Fear and Greed Index all show a sensitive zone. A single spark could push BTC into new highs or deep corrections.
But the real driver won’t be candles or lines it will be the crowd’s reaction to them. If traders once again follow fear and greed blindly, the cycle repeats. If they finally learn to step aside from the crowd, they have a real chance to win.
📊 TradingView Tools and Market Psychology
When it comes to Bitcoin, nothing is more important than understanding crowd sentiment. The Fear and Greed Index is one of the best tools you can integrate into TradingView charts for a bigger picture. When this index shows extreme fear, it means the majority is selling and that’s exactly where big players step in. On the other hand, extreme greed often signals serious danger.
Another useful TradingView feature is the Volume Profile indicator. It shows where most trades occurred and in which zones traders are mentally trapped. When you combine this with the Fear and Greed Index, you get a clear vision of when the crowd is about to face either a massive breakout or a brutal sell-off.
You can also apply Sentiment Indicators and Social Volume Tools directly on TradingView charts to see how emotions reflect in real-time. For example, when social discussion around Bitcoin spikes while price stays flat, the market is quietly preparing for a major move. This makes your analysis more than just price action; it becomes a psychological guide for every trader reading it.
🎯 Conclusion
Bitcoin’s market is not just numbers and charts it’s a battlefield of emotions. With the right tools on TradingView, you can see crowd psychology more clearly and prepare ahead of the masses. The secret to survival is simple: manage your emotions before the market manages them for you.
💡 Five Golden Advices for Survival in This Market
Always define your exit plan before entering a trade, never after.
If everyone is buying with excitement, pause the market usually rewards those who wait.
In moments of extreme fear, don’t rush to sell; check volume and sentiment indicators on TradingView first.
Never risk all your capital on one position; proper risk management is your lifeline.
Treat your emotions as an indicator; if you feel extreme fear or excitement, that’s your signal to wait, not to act.
✨ Need a little love!
We pour love into every post your support keeps us inspired! 💛 Don’t be shy, we’d love to hear from you on comments. Big thanks, Mad Whale 🐋
📜Please make sure to do your own research before investing, and review the disclaimer provided at the end of each post.
