BTC 1H Analysis - Key Triggers Ahead | Day 39😃 Hey , how's it going ? Come over here — Satoshi got something for you!
⏰ We’re analyzing BTC on the 1-Hour timeframe.
👀 On the 1H timeframe for Bitcoin, we can see that BTC has been ranging since yesterday’s news. A breakout and confirmation above the range high or below the range low will give us a trading setup. The key levels are $114,407 on the upside and $113,528 on the downside.
Today’s hot topic is the US CPI inflation data, which is a high-impact event at the very top tier of importance.
⚙️ On the RSI, Bitcoin is moving between the 50–70 zone. A breakout beyond these values, in alignment with a price breakout, could generate strong trade entries.
🕯 Candle structure shows that green candles are getting larger with more volume, while red candles are more frequent but smaller each time—so much that the market is starting to ignore them. The range high is very critical; it could break with a whale candle or even an indecision candle right before the move. Order type matters here—whether you use a trigger order or market entry on candle open will impact the trade.
📊 On the 1H Tether dominance, we’re also seeing a range—opposite in behavior to Bitcoin—with a range high at 4.37% and low at 4.32%. With BTC’s underlying trend on the 1H still bearish, there’s a decent probability of a downside break in USDT dominance while BTC breaks the upside of its range.
📊 On the 1H BTC.D , after a strong leg down, BTC.D has dropped below the 0.618 retracement level of its previous range and failed to hold support. We might see a small bounce/retest of that area, but unless today’s CPI causes major volatility, the broader expectation remains further downside in dominance.
🔔 The CPI report could bring serious volatility today. Yesterday’s news triggered nearly $750M worth of Bitcoin buys, sparking a strong rally with only minimal compression-style pullbacks. If today’s inflation data triggers a breakout above $114,407, and we see dominance dropping at the same time, large-cap projects are likely to pump even harder than Bitcoin itself.
❤️ Disclaimer : This analysis is purely based on my personal opinion and I only trade if the stated triggers are activated .
BTCUSDT

BTCUSDT - Short-Term Pullback Opportunity?Hello everyone, today let's analyze BTCUSDT in the current market context. The 3-hour chart shows that BTCUSDT has been on a strong uptrend, but it has now encountered strong resistance at the 114,800 USD level. If this level is not broken, a short-term pullback is highly likely.
Currently, a pullback seems necessary after a significant rally. The nearest support level is 112,200 USD, and if this is broken, the price could decline further. This correction could be temporary before the uptrend resumes, but if the support is not maintained, BTCUSDT could face a deeper drop.
Trading Strategy:
Sell if the price continues to face resistance at 114,800 USD.
Watch key support levels, especially 112,200 USD, for a potential entry point.
In conclusion, BTCUSDT may experience a pullback in the short term. If the key support is broken, the downtrend could continue. Stay alert for clear signals before entering the trade!

BTCUSD 4-Hour Chart Analysis
In terms of resistance, the 116,000 level is a key hurdle to watch. If the price can successfully break through 116,000 with strong momentum, it would open the door to further upside potential. Before that, the 115,000 level could act as a near-term resistance to test the bulls' strength.
For traders, the strategy could be to monitor the price action around the 112,500 support. If the support holds and there are signs of a bullish reversal , it may be an opportunity to consider long positions with a target towards 115,000 and then 116,000. Conversely, a breakdown below 112,500 would shift the bias to the downside, with the next support level to watch at 110,640
Overall, the near-term trend hinges on the price's interaction with the 112,500 support and the subsequent attempt to challenge the 115,000 - 116,000 resistance zone.
Buy 112500 - 113500
TP 114500 - 115500 - 116000
Daily-updated accurate signals are at your disposal. If you run into any problems while trading, these signals serve as a reliable reference—don’t hesitate to use them! I truly hope they bring you significant assistance

$BTC bounce at $112 or drop down to $101.3??CRYPTOCAP:BTC is forming a massive “M” pattern with a potential target around $101.3.
There are multiple support levels on the way down, so a bounce could happen at any of them. Ideally, this scenario gets invalidated with a strong rebound from $112K. Otherwise, the correction may drag on for weeks until a solid bottom is found.
The RSI is oversold on the 2H, but on the 1W timeframe, CRYPTOCAP:BTC looks like it’s just entering a longer-term correction.
⚠️ If the weekly bearish trend confirms, we could be facing several months of downside.
Will this trigger the start of alt season, or will altcoins get crushed even harder? Nobody can say for sure—so stay cautious and don’t get trapped by FOMO.
Here is the 1W chart, which is scary to be honest.
$BTC : bearish MACD crosover on 1WThe chart speaks for itself: we have a bearish crossover on the weekly MACD — historically a strong signal for a 3 to 6-month correction.
I know this goes against the current bullish sentiment, but every time this setup has appeared, the market corrected for several months. This time, however, the RSI isn’t extremely overbought, which could mean a shorter correction (1–2 months).
👉 Will this time be different?
If history repeats, the correction target sits around $96K–$98K at the 50-week SMA, a level that has always provided strong support in the past.
But if that support breaks… welcome to a new bear market.

BTC-USD Trade Insight 📢 NFX Trade Alert – Swing Setup
💹 Instrument: BITSTAMP:BTCUSD Bitcoin (BTCUSD.r)
🛒 Trade Type: Swing – Buy at Market
📍 Entry: $113,750
⛔ Stop Loss: $112,500
✅ Target Profit: $123,000
Analysis:
BTC has reclaimed bullish momentum, forming a bullish flag right above the key ascending triangle breakout level. Price structure remains strong, with buyers stepping in around the $114k zone. These dynamics reinforce our trade bias, keeping the upside toward $123k firmly in play.

BTC/USD – Liquidity Grab Before Downside MoveBTC/USD – Liquidity Grab Before Downside Move
Price is currently setting up for a retracement to the upside, likely sweeping excess liquidity before forming equilibrium. This move will provide the market with balance before continuing lower.
📍 Point of Entry
I’m watching the highlighted zone for a reaction after liquidity is taken. This level offers a potential short setup with strong risk-to-reward.
📉 Bearish Scenario
After the liquidity grab, price is expected to rotate lower and revisit the support zone, aligning with the 4H Fair Value Gap (FVG). This will be the key area to monitor for continuation or a potential bounce.
🔑 Market Outlook
Retracement upward → Liquidity grab.
Downward continuation → Support & 4H FVG retest.
Break below support → Opens further bearish targets.

BTC forms an ascending triangle, 113000 is just the beginningBITSTAMP:BTCUSD BTC saw a slight rise during the day. From the hourly and 4H charts, the MACD technical indicator formed a golden cross and broke through the upper short-term pressure of 113000. The short-term trend formed an ascending triangle. Bold and aggressive investors can rely on 113500-112000 to go long, with the target looking at 115500-116500.
Bitcoin Warming Up- Like always, everything in the graphic to simplifies the information, stay simple is better.
- Bitcoin is known for its extreme price volatility, which can lead to major fluctuations, such as a significant crash in value followed by a rapid doubling of its price in a very short period, for that simple reason i avoid to predict low timeframe moves.
- Now check the hidden bullish divergence, check the level of BBW, the volality could be low, but TheKing could be ready to make parabolic move soon or later.
- I do my best to try to post at the good time for medium long term investment.
- Don't forget that 125,000$ is far to be enough.
Happy Tr4Ding !

TradeCityPro | Bitcoin Daily Analysis #174👋 Welcome to TradeCity Pro!
Let’s dive into Bitcoin analysis. Today the U.S. inflation data was released, so let’s see how it impacted the market.
⌛️ 4-Hour Timeframe
Earlier today, the PPI index came in favorably for the market, and Bitcoin responded with an upward move following the news.
🔔 Yesterday, however, we saw some unusual global events. Israel carried out a military strike in Qatar, and at the same time, Nepal’s government collapsed following a popular revolution.
✨ These developments were negative for risk assets like Bitcoin, and as a result, the price was rejected from its resistance zone.
✔️ That said, news like this usually impacts markets only temporarily. Today, Bitcoin once again found support at the trendline and pushed higher with strong volume back into the key zone.
📊 Volume has risen significantly, and with today’s bullish PPI release, the current candle is closing above the resistance area.
💥 At the same time, the RSI is breaking through the 64.92 level, which greatly increases the likelihood of Bitcoin starting its next bullish leg. So if you’re already holding a long position, it’s worth keeping it open—there are no clear signs of weakness in the trend yet, and the market still has room to move upward.
🧩 If you don’t have a position open, you can look for entries on lower timeframes once resistance breaks. However, keep in mind that I personally already opened my positions with earlier triggers, and any new triggers appearing today come with higher risk.
❌ Disclaimer ❌
Trading futures is highly risky and dangerous. If you're not an expert, these triggers may not be suitable for you. You should first learn risk and capital management. You can also use the educational content from this channel.
Finally, these triggers reflect my personal opinions on price action, and the market may move completely against this analysis. So, do your own research before opening any position.

BTC – Bullish Head & Shoulders Pattern!Bitcoin is currently showing signs of a bullish inverse head & shoulders pattern on the 4H chart. This setup is typically a reversal signal, suggesting potential upside if the neckline resistance is broken.
Key Highlights:
- Left Shoulder, Head, Right Shoulder formation is clearly visible.
- Neckline Resistance: Around $113,500 – a breakout above this level could confirm the pattern.
- Potential Upside: If confirmed, BTC could see a strong move toward higher resistance zones.
- Volume Watch: A breakout backed by strong volume would add conviction.
Cheers
Hexa
CRYPTOCAP:BTC BITSTAMP:BTCUSD BINANCE:BTCUSDT

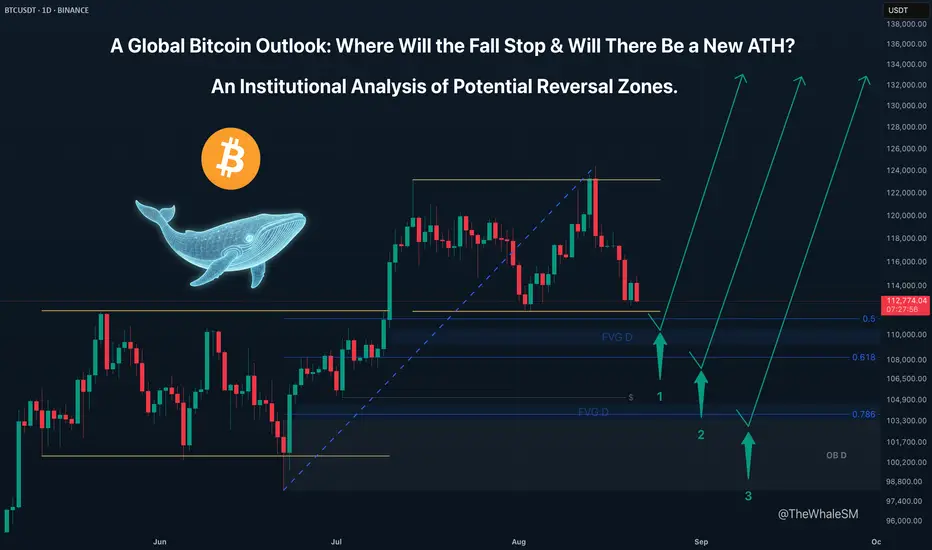
Bitcoin's Tumble: How Deep Does the Rabbit Hole Go?This isn't just a correction; it's a journey down the rabbit hole. The recent "fake" ATH was a calculated move by the whales to engineer a deep pullback. This analysis maps out the key levels in this rabbit hole where Alice—and Bitcoin—might finally find the bottom and begin the climb to a new Wonderland.
After updating its ATH on August 14th, Bitcoin did not continue its global uptrend. It was merely a liquidity sweep of the previous ATH, which confirmed the formation of a large range on the weekly and daily structures. In essence, this new ATH was a deviation above the range, after which the asset began a sharp markdown, collecting all the internal liquidity.
Most likely, the recent ATH was not the final one in this global bull cycle for Bitcoin because a proper, definitive high that would look like the start of a bear cycle was not established. Instead, it was achieved through a manipulation aimed at engineering a correction for the instrument down to key institutional levels.
Three Potential Long Scenarios
General Entry Conditions for All Scenarios:
Since these are levels from a global structure, a valid entry requires a clear reversal reaction and price finding acceptance above the respective Fib level . Confirmation of this may require waiting for 1-2 daily candles to close if the 1-4H candles do not immediately confirm the reversal.
SCENARIO 1 (Primary): The 50% Weekly Fib Level
This is the first corrective level from which a reversal is possible. A key confluence here is that reaching this level would be accompanied by a sweep of the external liquidity from the lower boundary of the range, as well as the mitigation of the upper boundary of the previous range, which could provide the necessary fuel for the next major impulse up. An added plus would be the price reaching the daily FVG that lies just below this level.
SCENARIO 2 (Deeper Correction): The 61.8% Weekly Fib Level
A break of the 50% level would mean that there wasn't enough liquidity and a deeper correction is needed. The next logical target would be the 61.8% level.
SCENARIO 3 (Final Defense): The 78.6% Weekly Fib Level
This is the last line of defense for the bullish structure. A reaction here would offer the most discounted entry to join the potential continuation of the bull run.
If the final retracement level is broken, the price will most likely attack the June 22nd low at 98200 . If the price finds acceptance below this level with daily/weekly candles, it would signal the end of the global bull cycle and the beginning of a bear market, but this is a distant and less probable perspective for now. I find it more probable that one of the three long scenarios will play out, and the price of Bitcoin will set a new, legitimate ATH.
Since the price is still inside the new large range—albeit near its lower boundary—reaching the first 50% global correction level may take some time and will likely happen next week. Whether this level can withstand the assault will determine if Bitcoin's fall continues, and just how deep Alice's rabbit hole truly is.
~~~~~~~~~~~~~~~~~~~~~~~~~~~~~~~~~~~~~~~~~~~~~~~~~~~~~~~~~~~~~~~~~
The principles and conditions for forming the manipulation zones I show in this trade idea are detailed in my educational publication, which was chosen by TradingView for the "Editor's Picks" category and received a huge amount of positive feedback from this insightful trading community. To better understand the logic I've used here and the general principles of price movement in most markets from the perspective of institutional capital, I highly recommend checking out this guide if you haven't already. 👇
P.S. This is not a prediction of the exact price direction. It is a description of high-probability setups that become valid only if specific conditions are met when the price reaches the marked POI. If the conditions are not met, the setups are invalid. No setup has a 100% success rate, so if you decide to use this trade idea, always apply a stop-loss and proper risk management. Trade smart.
~~~~~~~~~~~~~~~~~~~~~~~~~~~~~~~~~~~~~~~~~~~~~~~~~~~~~~~~~~~~~~~~~
If you found this analysis helpful, support it with a Boost! 🚀
Have a question or your own view on this idea? Share it in the comments. 💬
► Follow me on TradingView for timely updates on THIS idea (entry, targets & live trade management) and not to miss my next detailed breakdown.
~~~~~~~~~~~~~~~~~~~~~~~~~~~~~~~~~~~~~~~~~~~~~~~~~~~~~~~~~~~~~~~~~
BITCOIN TRADE ALERT📢 NFX Trade Alert – Swing Setup
💹 Instrument: BITSTAMP:BTCUSD Bitcoin (BTCUSD.r)
🛒 Trade Type: Swing – Buy at Market
📍 Entry: $113,750
⛔ Stop Loss: $112,500
✅ Target Profit: $123,000
Analysis:
BTC has reclaimed bullish momentum after holding above key short-term support. Current price structure suggests strength, with buyers stepping in around the $113k zone. A break and hold above $114k increases the probability of continuation toward the $123k resistance level.
Risk is defined with a tight stop at $112,500 to protect capital if momentum fails. This setup offers a favorable risk-to-reward ratio for swing traders.
Share your thoughts in comment below

BTC's situation+next targets and expected movementsThe price seems to have completed the corrective wave, and from now on, it's time for a price increase, which will continue up to around $150k .
_ _ _ _ __ _ _ _ _ _ _ _ _ _ _ _ _ _ _ _ _ _ _ _ _ _ _ _ _ _ _ _
✅Thank you, and for more ideas, hit ❤️Like❤️ and 🌟Follow🌟!
⚠️Things can change...
The markets are always changing and even with all these signals, the market changes tend to be strong and fast!!

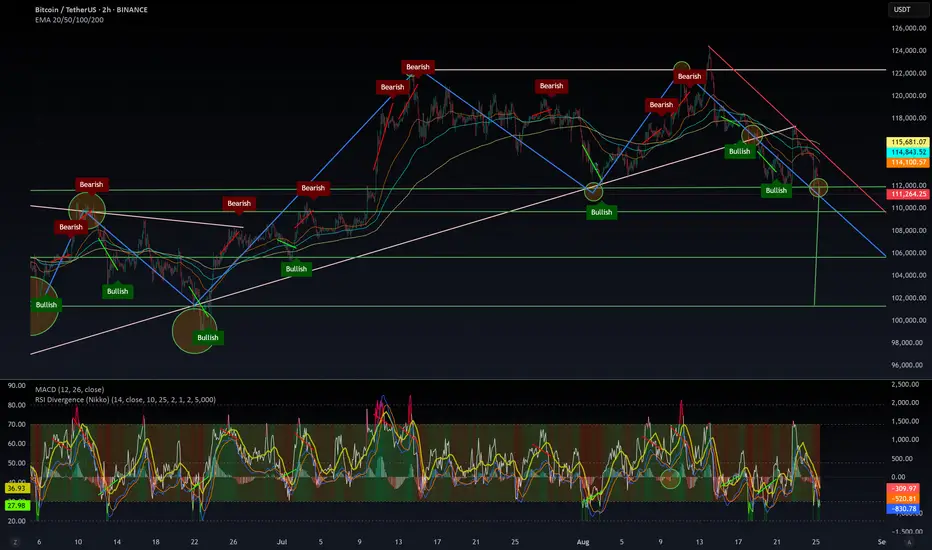
BTC – Base Before Break?After the ATH at 125k on 25 Aug, BTC pulled back to 107k and has been consolidating. The latest structure looks more like a base for reversal than a continuation pattern: price is back into the 113.3k zone, which coincides with resistance, and we’ve printed a sequence of higher lows—a classic pressure build under supply.
What I’m watching
• Bullish trigger: A clean break/close above 113.3k opens the path toward 120k (both a technical target and a psychological level).
• Continuation potential: If 120k is reclaimed with momentum, a 123–125k retest comes into play.
• Support: 110k is the line in the sand; below it, risk shifts to 100k zone (the correction low).
Trading plan
• Breakout: Look for acceptance above 113.5k and a successful retest to validate upside toward 120k.
• Buy-the-dip zone: If we pull back, watch 111–112k for signs of bid absorption and continuation.
Bias: I’m bullish while 110k holds. A failure below 110k would likely send us back to 107k and even 100k.

BTC 4H Analysis - Key Triggers Ahead | Day 38😃 Hey , how's it going ? Come over here — Satoshi got something for you!
⏰ We’re analyzing BTC on the 1-Hour timeframe.
👀 On the 4-hour timeframe of Bitcoin we can see that Bitcoin was under a descending trendline, and each time it touched this trendline it faced selling pressure. Bitcoin broke this trendline at the end of August, and since the beginning of September until now it has been ranging below the $113,000 resistance, where it has touched this level 3 times and then got rejected downward. Usually, these kinds of zones don’t break easily, and if they do, it is together with major global economic news.
⚙️ The key RSI zone of Bitcoin in the 4-hour timeframe is at 65. A swing scenario is considered for Bitcoin after the news, and if this news comes in favor of the risky market (crypto), it can move above the 65 range and even enter overbought territory.
🕯 The size, volume, and number of green candles have almost increased, while red candles are still accompanied by selling pressure. There is a taker-seller zone above, at the $113,000 resistance, that has kept the price down. With the release of news, a good wave of capital can enter or exit the market.
📊 On the 4-hour timeframe of USDT.D we can see that Tether dominance is in a very important support zone, and losing this support can bring good volume into the market. I think this support break can also happen with today’s PPI news. Tether dominance, like Bitcoin, was above a continuation ascending trendline, but now it has broken the trendline and is ranging below it. This shows us the importance of the news!
📊 On the 4-hour timeframe of BTC.D we can see that Bitcoin dominance is in a support zone, and with a 4-hour candle that looks like multiple profit-taking it got supported and moved upward. Although the move is small, we should pay attention. The resistance zone of Bitcoin dominance is at 58.36%, and the support zone is at 58.06%. Losing these zones can give altcoins very strong moves.
🔔 Bitcoin is now under an important resistance at $113,000. If this zone is broken, it can move upward again. A very strong support zone is also built by maker buyers at $107,627, which is quite far from the current price. For a long position, wait until the taker-seller zone is taken out with a whale candle and then enter on the pullback. Also pay attention that altcoins can give us the most profit during this period when both Bitcoin dominance and Tether dominance are dropping.
❤️ Disclaimer : This analysis is purely based on my personal opinion and I only trade if the stated triggers are activated .

TIA ANALYSIS🚀#TIA Analysis : What Next ??💲💲
✅As we can see that there was a formation of Descending Triangle Pattern in #TIA and given a breakout. We are expecting around more than 30% bullish move in coming weeks 📈📈
🔰Current Price: $1.815
🎯 Target Price: $2.081
⚡️What to do ?
👀Keep an eye on #TIA price action. We can trade according to the chart and make some profits. Stay tuned for further analysis and stay updated with market sentiments and news.⚡️⚡️
#TIA #Cryptocurrency #TechnicalAnalysis #DYOR

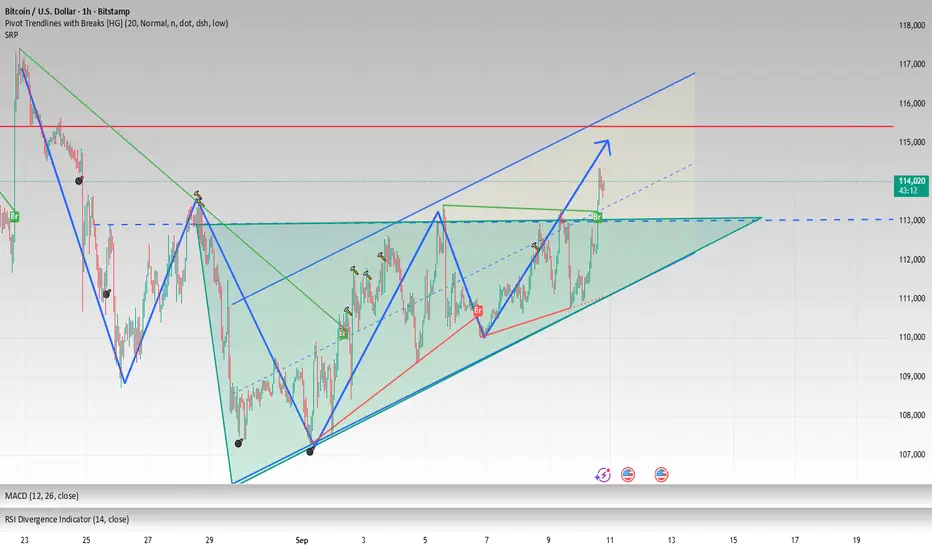
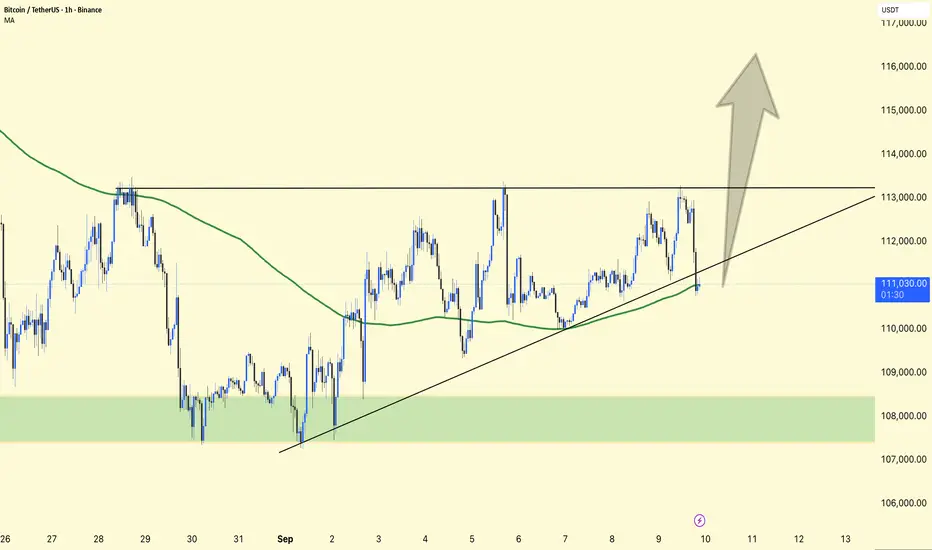
BTCUSDT 1H Chart Analysis !!BTCUSDT 1H Chart Analysis
Current Price
BTC is trading near $111,000, sitting right on top of the trendline support.
The 111K MA (Moving Average) is also aligned here, adding extra strength to this support zone.
Resistance Zone
The most important level above is $113,000.
This has acted as a ceiling multiple times; a clean breakout with volume could send BTC quickly higher.
Bullish Scenario 🚀
If BTC breaks $113K with strength, the next upside targets are:
$115,000 (psychological resistance)
$117,000 (measured move from the ascending structure).
Strong breakout here may trigger short squeezes, fueling momentum.
Bearish Scenario ⚠️
If BTC fails to hold the trendline + MA support, price could drop back into the $109K–108K demand zone (highlighted green box).
Below $108K, downside risk increases sharply.
Market Context
Structure is higher-lows, showing buyers still defending dips.
But BTC is stuck in a range between support ($111K) and resistance ($113K).
BTC is at a decision point.
✅ Break above $113K = bullish continuation toward $115–117K.
❌ Rejection and break below support = pullback into $109–108K demand zone.
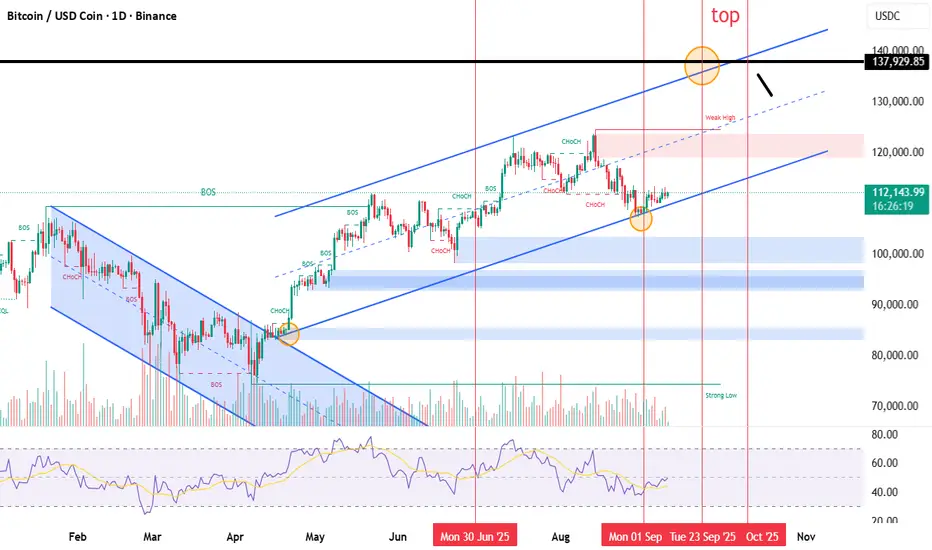
Bitcoin breaking down to 95k !?The recent move makes me think Bitcoin could revisit the 95k area and sweep the June lows. Another scenario is we stay stuck between 105k and 115k for a while before the next big move, which then would be more likely to be up to new ATH. Until we reclaim 115k with volume, I expect down.
A big red flag for me is the lack of volume on the way up since April. Markets don’t move higher forever without new buyers stepping in, and right now it feels like momentum is running out.
95k isn’t just a random number either. It lines up with a key demand zone, and where the last big bounce started, and if price gets there with volume, that could be the reset we need. A clean sweep of the June lows would also wash out weak longs and set up a stronger base for the next move higher.
At the same time, the macro climate is still a wild card. Wars, inflation, interest rates, central banks, Trump... these are all heavy influences that can shift momentum in either direction without warning. Bitcoin might be doing its own thing, but it doesn’t live in a vacuum.
Until something changes, I’m leaning short on the way down, targeting 95k as the spot to watch for signs of real buying pressure.
What do you think?

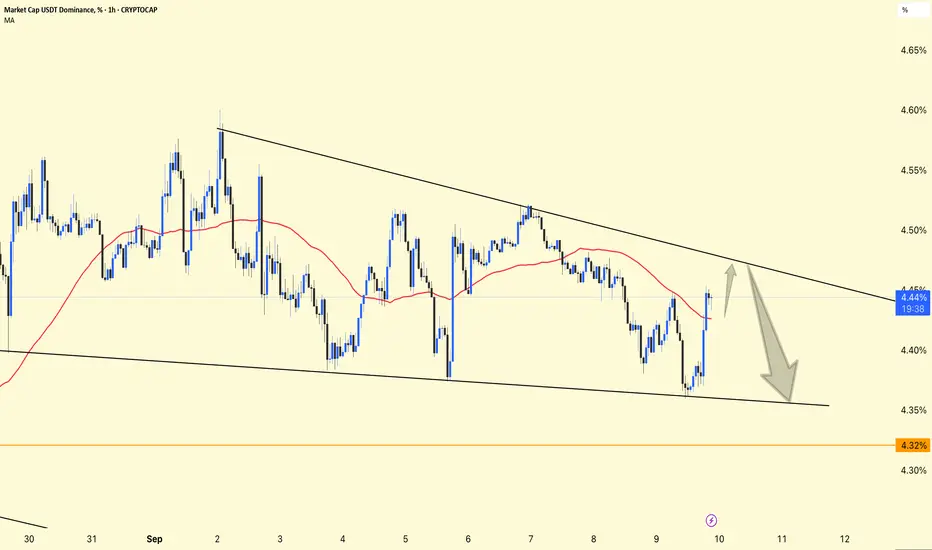
USDT.D 1H Analysis !!USDT.D 1H Analysis
Price is consolidating inside a descending triangle (lower highs + flat bottom).
Currently sitting around 4.44%.
50MA (red) is acting as dynamic resistance, keeping pressure on dominance.
Support Zone
Key support lies near 4.35% (triangle bottom).
A breakdown below this zone could send dominance lower toward 4.32% (orange line).
Resistance
The upper trendline around 4.48%–4.50% is the first big resistance.
Break above → short-term relief rally in dominance.
📈 Outlook
Bullish case: If USDT.D breaks above 4.48%, dominance may rise toward 4.55%–4.60%, usually bearish for crypto prices.
Bearish case: If it rejects and breaks below 4.35%, we can see a move toward 4.32%, which would support bullish momentum in BTC/altcoins.
👉 In simple terms:
Watch 4.48% (resistance) and 4.35% (support).
A breakout = bearish for crypto.
A breakdown = bullish for crypto.
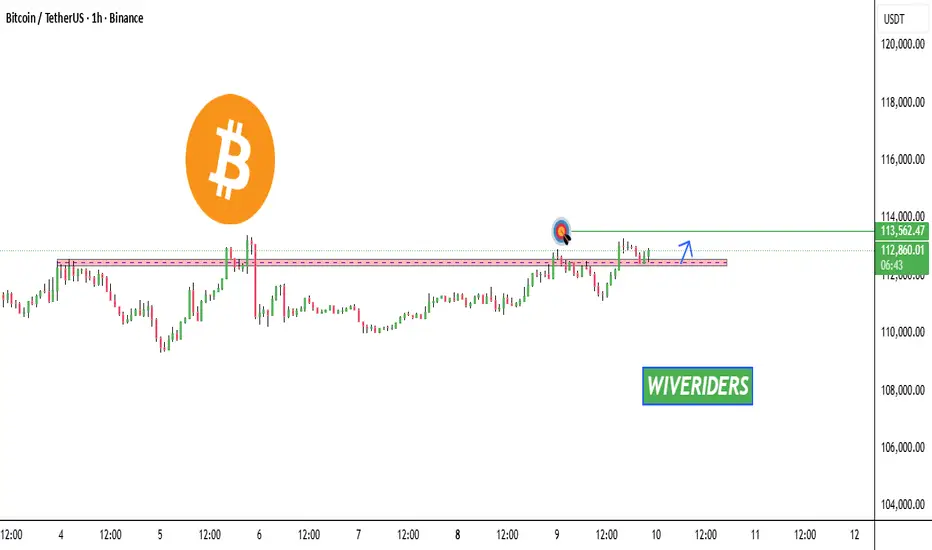
BTC Trading UpdateCRYPTOCAP:BTC Trading Update
CRYPTOCAP:BTC looks to be making a pullback at a past resistance zone. If momentum continues, the first target 🎯 sits around 113,560 USD.
⚠️ Waiting for confirmation before entering is important to avoid false breakouts.
Happy trading ✨
TradeCityPro | Bitcoin Daily Analysis #173👋 Welcome to TradeCity Pro!
Let’s dive into Bitcoin analysis. Today and tomorrow are very important days, and it’s crucial to have the right outlook on Bitcoin. We’ve got some interesting triggers for opening positions that could potentially hit our trading targets for the next few weeks.
⌛️ 4-Hour Timeframe
Bitcoin has been moving upward along a trendline and is now sitting inside a resistance zone. How price reacts to this level is key—it could determine Bitcoin’s next major move.
🔍 If the resistance breaks, an upward rally could begin, as volume has been increasing strongly and the RSI is sitting just below 64.92. That’s an important resistance level, and breaking it could bring fresh momentum into the market.
💥 Rising momentum and strong buying volume are always good signs of a powerful uptrend, and as long as these two factors align with price action, the trend should continue.
⚡️ So, if you already have open positions, you might want to take profits if the price rejects from support and RSI plus volume show divergence with the price move.
✨ If you’re looking to open a new position, the breakout of 113,237 is currently the best trigger for a long entry, provided no divergence appears.
🔽 On the other hand, if price rejects this zone and breaks below the trendline, a short setup could form. However, keep in mind that in the current market, where higher cycles remain bullish, all short positions are risky. Personally, I don’t take shorts in this environment and prefer to stay aligned with the broader uptrend.
📰 Finally, tomorrow we have the U.S. inflation report—one of the most important releases of the month, and it will have a big impact on the market. Be extra careful with your positions, because sharp volatility is highly likely once the data comes out.
❌ Disclaimer ❌
Trading futures is highly risky and dangerous. If you're not an expert, these triggers may not be suitable for you. You should first learn risk and capital management. You can also use the educational content from this channel.
Finally, these triggers reflect my personal opinions on price action, and the market may move completely against this analysis. So, do your own research before opening any position.
