#BTC/USDT Bullish Divergence on 1H, Low Risk Trade#BTC
The price is moving within a descending channel on the 1-hour frame, adhering well to it, and is poised to break it strongly upwards and retest it.
We have a bearish trend on the RSI indicator that is about to be broken and retested, supporting the upside.
There is a major support area in green at 108062, which represents a strong basis for the upside.
For inquiries, please leave a comment.
We are in a consolidation trend above the 100 Moving Average.
Entry price: 108450
First target: 108959
Second target: 109541
Third target: 110325
Don't forget a simple matter: capital management.
When you reach the first target, save some money and then change your stop-loss order to an entry order.
For inquiries, please leave a comment.
Thank you.
BTCUSDT

BTC 1H Analysis - Key Triggers Ahead | Day 30💀 Hey , how's it going ? Come over here — Satoshi got something for you !
⏰ We’re analyzing BTC on the 1-hour timeframe timeframe .
👀 On the 1-hour timeframe of Bitcoin, we can see that after activating our alarm zone, Bitcoin moved toward the top of the channel and then got rejected from this area. There is a resistance in the 1-hour timeframe at the price of $110,450, and by breaking this level Bitcoin can move upward.
⚙️ We have 2 key RSI zones at 38 and 64, and if the fluctuation limit passes these numbers, Bitcoin can experience either a corrective move or the continuation of the bullish leg.
🕯 The size of the green candles has grown and their volume has increased. This happened with the end of August and the beginning of September. With increased buying volume and positive news results in favor of crypto, Bitcoin can make another move upward. News has a very direct impact on our inflows and outflows.
📊 On the 1-hour timeframe of USDT.D , we can see that it is moving inside a box with a top at 4.56% and a bottom at 4.47%. By breaking out from either side of the box, it can bring strong trading volume. Notice that Tether dominance is currently pulling back to the midline of the box. By breaking the midline and stabilizing above this area, Bitcoin may face more selling pressure. By getting rejected from this area and losing the bottom, our long position trigger for Bitcoin can be activated.
🔔 The alarm zones specified for Bitcoin are at $110,450 and $107,800. By observing behavior in these areas we can trade. Personally, with the breakout of $110,450 along with a 15-minute indecision candle, I will try to take a position. Note that Bitcoin can make a pullback to its midline box and then bounce upward. If the midline is lost, this scenario will be invalid.
❤️ Disclaimer : This analysis is purely based on my personal opinion and I only trade if the stated triggers are activated .

TradeCityPro | Bitcoin Daily Analysis #167👋 Welcome to TradeCity Pro!
Let’s go for Bitcoin analysis, Bitcoin has finally broken out of the box it was in. Let’s see what positions it can give us today.
⏳ 1-Hour Timeframe
Yesterday Bitcoin broke the 109577 level and the trendline that it had in the higher timeframes, and now it has reached the resistance of 110721.
⭐ We have not yet received confirmation of the trendline breakout because no volume has entered the market, and the price has not made higher highs and higher lows, so it can still be said that the trendline is not yet broken.
📊 If volume starts to increase and the 110721 ceiling is broken, we get confirmation of the breakout of this trendline. If RSI also breaks the 64.09 level, we can take momentum confirmation from it.
💥 With the breakout of 110721, a long position can be opened on Bitcoin. If Bitcoin dominance continues its upward movement, this position can be very attractive, but if dominance starts to drop, altcoins will be a much better option.
🔽 For a short position, a fakeout of this upward movement and price stabilizing below the 109577 level would be a good trigger for a fakeout, and in the lower timeframes, we can open a short position with price stabilizing below 109577.
❌ Disclaimer ❌
Trading futures is highly risky and dangerous. If you're not an expert, these triggers may not be suitable for you. You should first learn risk and capital management. You can also use the educational content from this channel.
Finally, these triggers reflect my personal opinions on price action, and the market may move completely against this analysis. So, do your own research before opening any position.

Bitcoin 2017 vs. 2025Bitcoin top not is in.
CRYPTOCAP:BTC as seen in 2017, in the stage before its parabolic rise.

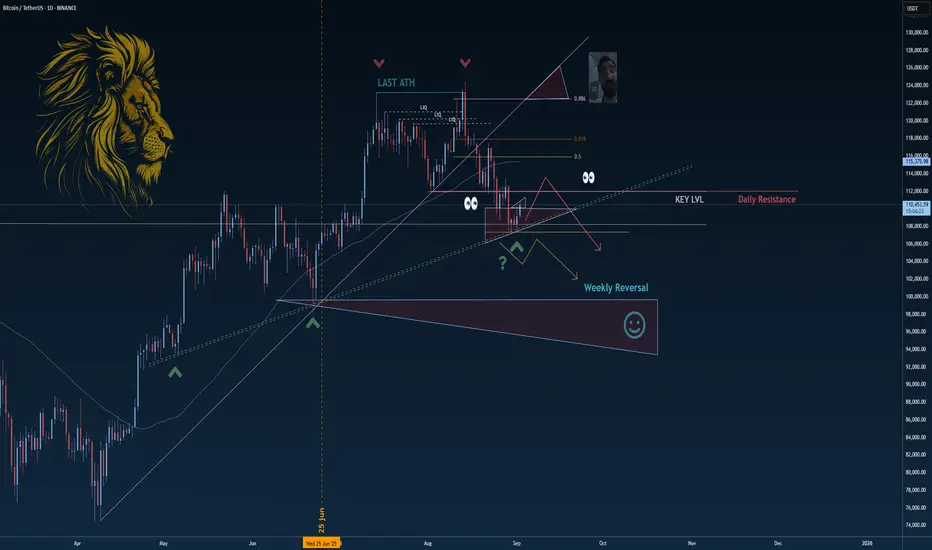
Bitcoin Price Action Explained: Multi-Timeframe Strategy (No BS)Welcome back, it’s Skeptic from Skeptic Lab.
This is Episode 15, and today I’m breaking down Bitcoin across multiple timeframes using pure price action — no noise, no hype. We’ll cover:
Weekly cycle & trend (HWC confirmation)
Daily structure: support, resistance & potential correction
Spot triggers from trendline & breakout setups
4H & 1H futures triggers with confirmation methods
Risk management puzzle (position size, SL, targets)
Bitcoin dominance vs altcoins (ETH, etc.)
My goal is simple: show you clear and actionable triggers with the right risk management so you can trade with confidence — not emotions.
This content is for educational purposes only and not financial advice.
👉 If you haven’t yet, check out my Ethereum analysis where our last trigger gave us +80% with no leverage.
Stay skeptical. Trade smart.
Peace out ✌️

BTC IdeaBTC has broken out of the falling channel after retesting the $108.5K demand zone and is now showing signs of strength above $110K.
If buyers shows strength, BTC can push higher towards $112,000 - $115,000. But if momentum weakens, it may fall back to test the demand zone again.

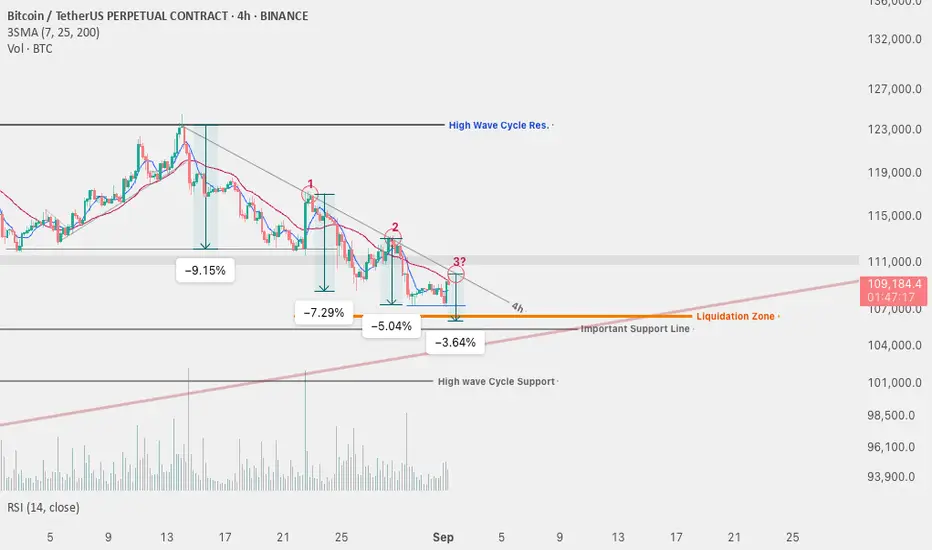
Sep 2, 2025 - Daily BTCUSDT Chart Analysis-03Following yesterday’s analysis, Bitcoin has now tested the mid-term descending trendline for the third time. It’s hard to say whether the last 4H candle has actually closed above this trendline. However, I don’t consider this as a confirmed breakout yet — for me, a breakout should be confirmed by market structure, not just by a single candle close.
So today, I’ll be watching Bitcoin’s reaction to this trendline closely.
If price gets rejected, I expect it to drop toward the **liquidity zone** I’ve marked, collect liquidity there, and then potentially continue its downward move.
📌 Summary
* I will not take any long positions until I see a confirmed breakout in structure.
* If Bitcoin gets rejected from the trendline, I’ll look into short setups on altcoins، depending on Bitcoin dominance.
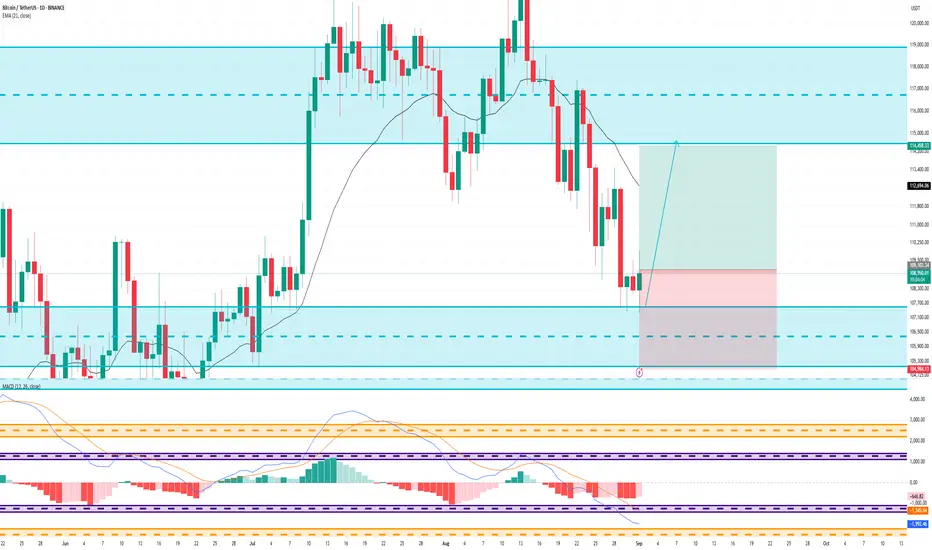
Bitcoin Above $110,000, Major Bullish Development · Bulls WinsBitcoin is now trading back above $110,000, one of the most important levels in this cycle and also on the short-term.
I don't think you are surprised to see this as we've been LONG but still, this is a major development. Support is found based on a long-term moving average with perfect precision. Bitcoin closed below 110 only four days. Four days below this level and is now recovering.
EMA144 has a reading of $107,000. BTCUSDT bottomed today at $107,000.
On a previous drop June 2022, Bitcoin found support at EMA89. This time this level broke and the action is happening below, just barely. This is another classic. The action moves below previous support just to recover after a few days. This is a strong bullish signal, it shows that the last drop was a bear trap but confirmation only comes when the day ends.
Bitcoin will continue to grow, the chart is saying so.
I think it will take months to reach a new major high and this cycles top and final all-time high. It will take time but it will be all worth it. We are changing the world.
Crypto will continue to evolve;
Our capital will continue to mature and grow.
Everything looks great and we expect period of sustained growth. Don't be distracted by market noise. Focus on the long-term and hold.
There is no way to beat the exchanges, the whales and the bots, they have all of your info and you have none of theirs. The way to beat all these entities is to buy holding long-term. Since there is a no way to remove a strong hand, you will be able to reap the reward. See how Ether trades at a new all-time high only four months after hitting a multiple years long bottom; the rest of the market will do the same.
First the biggest projects, then the medium sized ones and finally, the rest of the market. It never fails; it always works...
» Bitcoin's next target is $137,000 followed by $155,000.
» Ethereum is moving to $6,000 - $8,000.
» XRP will continue to hit new all-time highs.
» Cardano will hit several new milestones and Solana will do the same.
The market is set to continue with its 2025 bull market. We are missing the bull run phase.
Thank you for reading.
Namaste.

BTC/USD Technical AnalysisHello guys!
The price has broken through the last resistance level and is currently forming a Head and Shoulders (H&S) pattern. At this stage, it's unclear whether we’re seeing a reversal H&S or a continuation H&S. Here’s how to play it:
1️⃣ If the neckline breaks upwards, consider going long with a target toward the pink resistance zone. This area is key for shorts, so be prepared to flip your position here!
2️⃣ If the neckline holds as resistance, look for short opportunities targeting:
$106,460
$105,250
💡 My strategy:
Open half your short position now. If price moves toward the pink zone, add more shorts there for a stronger position.
⚠️ Caution: Always keep an eye on the neckline, it will determine whether we go bullish or bearish from here!

Bitcoin last leg down before going back up ?BITSTAMP:BTCUSD faces strong resistance near 110,100 – 110,650. Failure to break above increases the probability of continuation to the downside, with the Fibonacci levels acting as the next bearish targets.
📉 Bearish Confluences
Price is currently testing the mid-zone of the Bollinger/Keltner channel and struggling to break above the red resistance zone.
Previous upward attempts have been rejected around the 38.2% Fib retracement (110,100), showing weakness.
Structure still shows a lower-high pattern, keeping the short-term bias bearish.
🎯 Fibonacci Bearish Targets
If the rejection holds, downside Fibonacci extension levels provide potential targets:
38.2% retracement → 108,298
61.8% retracement → 107,742
100% retracement → 106,840

Bitcoin Manipulation or Opportunity? Watch This Zone!⚡ Bitcoin Manipulation or Opportunity? Watch This Zone!
The chart highlights significant liquidity zones, BOS (Break of Structure), and liquidity sweeps, pointing to how price action is driven by institutional order flow.
🔎 Key Observations:
Break of Structure (BOS): Multiple BOS points confirm shifts in market direction as price transitioned from bearish → bullish → bearish again.
Liquidity Grab: Notice how price swept liquidity around previous support before reversing—classic manipulation to trigger stop losses before a move higher.
Downtrend Liquidity Channel: Price followed a controlled bearish liquidity channel after rejecting the resistance zone at 120,000 – 123,000, showing distribution.
Liquidity Sweep (Latest Move): The recent sweep near 108,000 suggests that sellers were trapped, providing liquidity for potential buy-side movement.
Projection: Based on the liquidity sweep, a rebound toward 116,000 – 118,000 is anticipated ⭐. However, interim resistance at 112,000 must be broken and retested to confirm bullish continuation.
⚠️ Risk Note: If price fails to hold above the liquidity sweep zone, a deeper correction could occur.
📌 Conclusion:
BTCUSD is showing signs of a bullish reversal after liquidity manipulation. Traders should watch for confirmation above 112,000 to target the 116,000 – 118,000 range, aligning with smart money concepts.

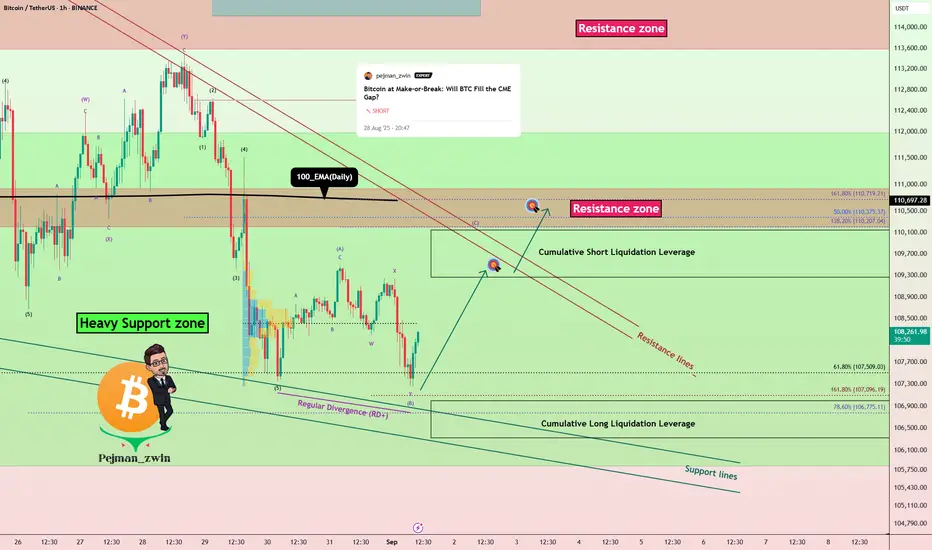
Bitcoin at Heavy Support – Will Bulls Defend or Break Below?Bitcoin ( BINANCE:BTCUSDT ) fell as I expected in my previous idea .
The question is, can Bitcoin break the Heavy Support zone($111,980-$105,820) ?
Bitcoin is currently trading in the lower areas of the Heavy Support zone($111,980-$105,820) and near the Support lines and Cumulative Long Liquidation Leverage($107,000-$106,330) .
In terms of Elliott Wave theory , it seems that Bitcoin has completed 5 downwaves at the support lines, and we should expect upward corrective waves . The corrective waves could follow the Expanding Flat(ABC/3-3-5) .
Also, we can see the Regular Divergence(RD+) between Consecutive Valleys.
I expect that if Bitcoin is going to break the Heavy Support zone($111,980-$105,820) , it will attack the Resistance zone($110,920-$110,200) and the Resistance lines first. Do you agree with me!?
Cumulative Short Liquidation Leverage: $110,147-$109,266
CME Gap: $117,235-$113,800
Stop Loss(SL): $105,600(Worst)
Please respect each other's ideas and express them politely if you agree or disagree.
Bitcoin Analyze (BTCUSDT), 1-hour time frame.
Be sure to follow the updated ideas.
Do not forget to put a Stop loss for your positions (For every position you want to open).
Please follow your strategy and updates; this is just my Idea, and I will gladly see your ideas in this post.
Please do not forget the ✅' like '✅ button 🙏😊 & Share it with your friends; thanks, and Trade safe.
Massive Altcoin Move Coming – Eyes on USDT.DUSDT.D has broken above the resistance line and is now facing resistance at the key S/R zone along with the super trend level.
If USDT.D breaks above this zone, we could see a deeper correction in altcoins. On the flip side, if it gets rejected and starts moving lower, it could trigger a healthy upside move in alts.
The best move right now is to wait for clear market direction instead of chasing random trades. Once the breakout or rejection confirms, I’ll share a detailed trade setup for the next move, whether up or down.

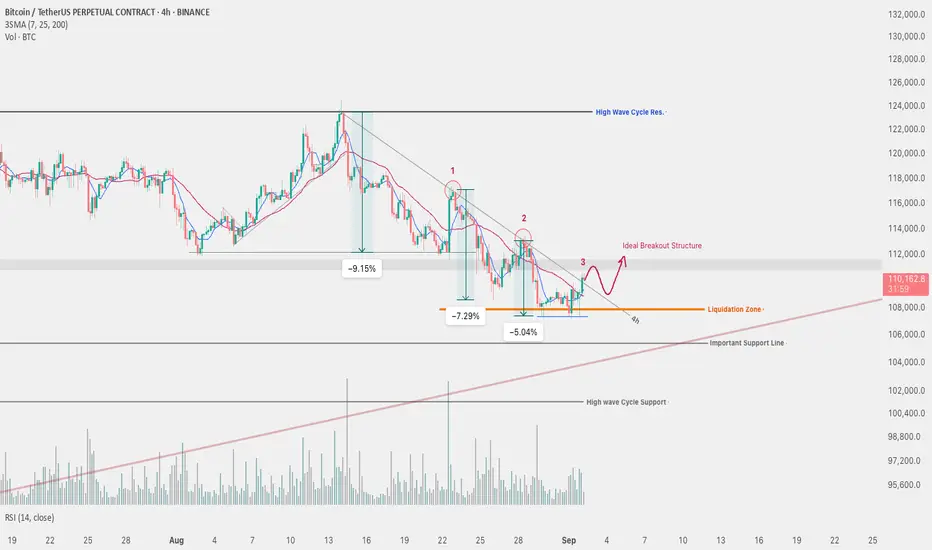
BTC 4H Analysis – Key Triggers Ahead | Day 29💀 Hey , how's it going ? Come over here — Satoshi got something for you !
⏰ We’re analyzing BTC on the 4-hour timeframe timeframe .
👀 On the 4-hour timeframe of Bitcoin, we can see that Bitcoin is inside a descending continuation channel. With the open of the new weekly candle, it reacted to the midline of this channel and had a pullback, faking the \$109,424 level and moving downward. The price of Bitcoin is now near its resistance at \$109,400.
⚙️ Two key RSI levels are considered for Bitcoin’s volatility: 50 and 33.20. Once the oscillator crosses these levels, Bitcoin can start a new move.
🕯 The size and volume of Bitcoin’s red candles are considerably larger than the green ones, and we still don’t have confirmation that the correction has ended. With increased buying volume and a trend change, Bitcoin can print strong green candles upward.
📊 On the 4-hour timeframe of Tether dominance, we can see that Tether dominance is ranging within an ascending channel. Breaking out of this channel could bring a strong move to the market. These levels won’t unlock easily for us to step into a bull run. Complementary news is needed for whales to sell their Tether and start buying Bitcoin and strong altcoins. The results of the coming month’s news could set the trend in whichever direction it may be.
🔔 The alert zones we have considered for Bitcoin are the \$107,400 level and the \$109,400 level. With increased volume and volatility, Bitcoin can touch one of these two price levels, and if confirmation of a breakout is given, it can start its trend. There are different scenarios in this regard, but the outcome of U.S. economic news can play a key role in confirming trades.
❤️ Disclaimer : This analysis is purely based on my personal opinion and I only trade if the stated triggers are activated .

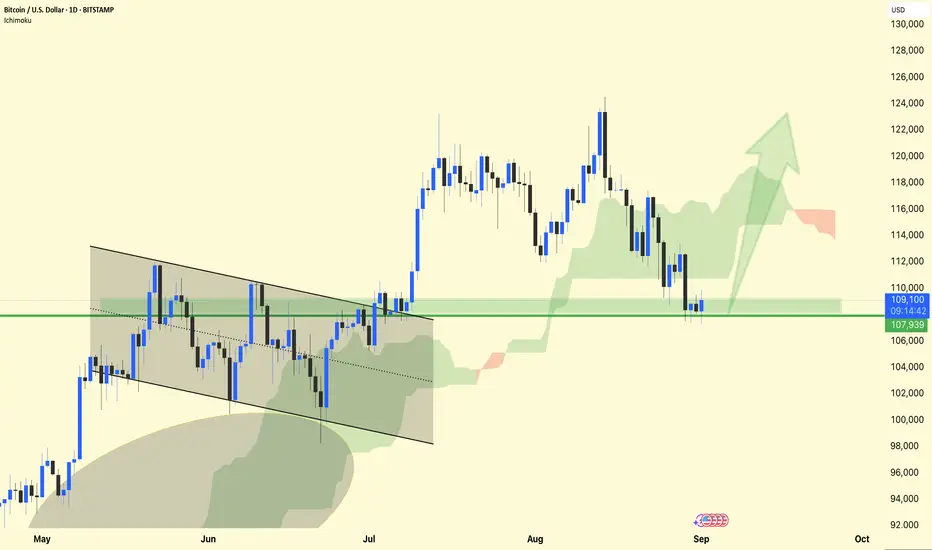
BTC/USDT – 1D Chart Analysis !! BTC/USDT – 1D Chart Analysis
BTC is holding above the $108K support zone (green box). This area has acted as a demand zone, preventing deeper downside.
Structure: After the breakdown from the wedge pattern earlier, the price is consolidating near support with lower wicks showing buyer defense.
Ichimoku Cloud: Price is still inside the cloud zone, suggesting a neutral-to-bullish outlook. A strong daily close above $110K–112K could flip momentum upward.
Next Targets:
Bullish breakout → Move toward $116K – $120K zone (green arrow projection).
If support fails → Risk of retest around $104K – $102K.
⚡ Sentiment: Market is at a make-or-break level — holding $108K could spark a strong rebound; losing it could trigger further correction.
DYOR | NFA
TradeCityPro | Bitcoin Daily Analysis #166👋 Welcome to TradeCity Pro!
Today a new weekly candle has opened, so let’s analyze Bitcoin and review the trading conditions for the new week.
⏳ 1-Hour Timeframe
Bitcoin has formed a ranging box in the 1-hour timeframe, and with the start of the new week and month, the candle volumes have increased significantly.
✔️ The trendline we drew yesterday on the 4-hour timeframe can also have an impact here in the 1-hour chart, and if the price reaches it, a reaction is very likely.
✨ If the price reacts to the trendline and gets rejected, the downward move can continue. The trigger we currently have for a short position is the break of 107467.
⚡️ But if the trendline is broken, we can open a long position with the activation of the trendline trigger, which is the break of 109577. In this case, Bitcoin could start a bullish move that may continue towards resistance areas.
🧩 Yesterday was the last day of the month, and today is the first day of the new month. Many companies and funds are forced to open or close their positions due to accounting strategies. This has caused some unusual volatility.
🔍 Keep this in mind: I recommend not opening any major positions today. If you do, manage them with proper risk control until the market returns to normal conditions.
❌ Disclaimer ❌
Trading futures is highly risky and dangerous. If you're not an expert, these triggers may not be suitable for you. You should first learn risk and capital management. You can also use the educational content from this channel.
Finally, these triggers reflect my personal opinions on price action, and the market may move completely against this analysis. So, do your own research before opening any position.

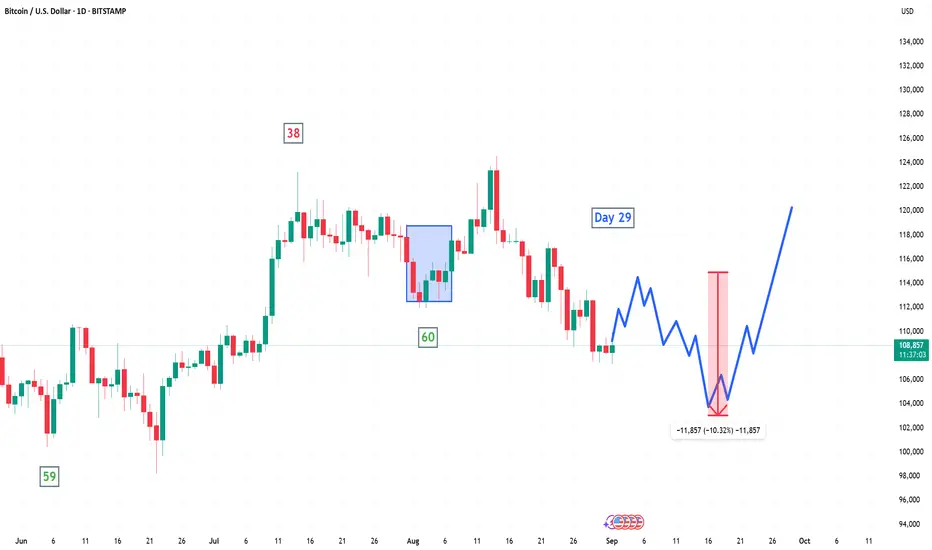
Bitcoin is going below $105kBitcoin is heading into the upcoming 60-day cycle low and is set to test the $105K area.
We might see a short-term pop toward $114K, but that level will act as strong resistance.
LETS GIVE BTC A LITTLE BREAK SHALL WE, LET IT BOUCE A BIT, YEAH Expect a bit of bounce from this point !! Retailers have sold all their coins and now MM is gona buy back from these poor souls. BUT the end is inevitable for the ALGOS have spoken (Sorry about the messy chart guys, didn't get the time to clean it up!)

Sep 1, 2025 - BTCUSDT Short ScenarioIn the recent downtrend, each retest of the descending trendline has shown a slight weakening in bearish momentum. Currently, the price is approaching a key daily support at 105,500 .
Since Bitcoin has already broken previous support levels and dropped to this point, a test of this final support zone seems likely. Therefore, once the price reaches the trendline, I will monitor its reaction on lower timeframes. If bearish continuation is confirmed, I will be expecting roughly a 3% downside move.
For opening a position after Bitcoin reaches this area, I will also check Bitcoin dominance to decide whether to short Bitcoin directly or look for setups in altcoins.
If BTC dominance rises, I will focus on short opportunities in altcoins.
The next important reactions will be around 106,500 and 105,500 . As mentioned earlier, we are already seeing early signs of weakness in the current downtrend:
1. Each touch of the descending trendline shows reduced bearish momentum.
2. The bearish waves are getting smaller in size with each touch of the trendline.
Thus, in these final support areas where buyers may step in, the probability of a trend reversal is now higher than at any previous point in this downtrend.
Analytics: market outlook and forecasts
📈WHAT HAPPENED?
Last week was marked by an update of the local minimum again. However, the breakdown turned out to be uncertain and weak, accompanied by delta absorption.
We've rebuilt the global buying zone on the daily chart: now it's in the range of $108,000-$102,500. Until the price is fixed below these levels, the global trend can be considered upwards.
In the short term, bitcoin is still in a downward trend. It's extremely risky to open long positions before the breakdown of the inclined line. The seller's activity remains limited, but the buyer doesn't take the initiative either.
💼 WHAT WILL HAPPEN: OR NOT?
The main scenario for the current week is the expansion of the range to collect liquidity in both directions.
The minimum is most likely not formed yet. For a more confident decline, the market needs more activity. This requires two conditions: an increase in open interest from the buyer and liquidity in the form of stop orders.
For now, it's better to refrain from trading the first cryptocurrency or, in anticipation of the resumption of the global long trend, consider grid spot strategies.
Buy Zones:
• $108,000–$102,500 (accumulated volumes)
Sell Zones:
• $112,400–$113,300 (local volume zone)
• $114,400–$115,500 (volume zone)
• ~$116,500 (volume anomaly)
• $117,200–$119,000 (accumulated volumes)
• $121,200–$122,200 (buy absorption)
📰 IMPORTANT DATES
The following macroeconomic events are expected this week:
• Tuesday, September 2, 09:00 (UTC) — publication of the consumer price index in the Eurozone for August;
• Tuesday, September 2, 13:45 (UTC) — publication of the index of business activity in the manufacturing sector (PMI) USA for August;
• Wednesday, September 3, 14:00 (UTC) — publication of the number of open vacancies in the labor market (JOLTS) USA for July;
• Thursday, September 4, 12:15 (UTC) — publication of changes in the number of people employed in the US non-agricultural sector in August;
• Thursday, September 4, 12:30 (UTC) — publication of the number of initial applications for unemployment benefits in the United States for August;
• Thursday, September 4, 13:45 (UTC) — publication of the business activity index (PMI) in the US services sector for August;
• Thursday, September 4, 14:00 (UTC) — publication of the Purchasing Managers' Index for the non-manufacturing sector (ISM) USA for August;
• Friday, September 5, 12:30 (UTC) — publication of the average hourly wage, changes in the number of people employed in the non-agricultural sector and the unemployment rate in the United States for August.
*This post is not a financial recommendation. Make decisions based on your own experience.
#analytics

BTC/USDTHistorically, September tends to be a “red” month for Bitcoin. We’ve already seen liquidity taken from the July high, and the August low has also been swept.
For further upside, a clean sweep of the July low would be ideal. Long setups only after clear confirmation.
