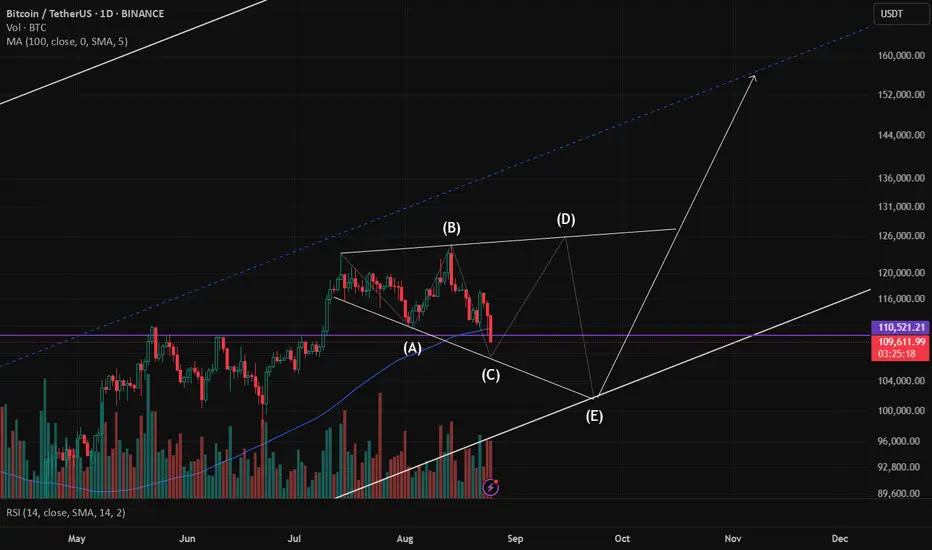
BTCUSDT: Trade this fractals 106K!!!Hello, as you can see on the Bitcoin chart, the price has broken two important trend lines and has also made pullbacks. What we can expect for the price movement is that the price will first reach the level of 106,000 and then we will see growth for Bitcoin according to the drawn lines, meaning it will first reach the level of 111,000 and after a correction, it will grow to 117,000.
BTCUSDT

Short for BTCUSDThis my setup on BTCUSD, based on support and resistant, Supply and demand. Trade with your on risk.

$BTC - Long Trade IdeaCRYPTOCAP:BTC | 1h
Can enter at cmp or on base retest, targeting those singleprints or imbalances above.
stoploss: 107k
TPs:
113.5k-114.3k
115.2k-116.2k
116.7k-117.5

BTCUSDT Hello Traders! 👋
What are your thoughts on BITCOIN ?
Bitcoin failed to sustain above its recent highs and has since entered a corrective phase, breaking below its ascending trendline.
Price is now trading below the broken trendline and beneath a key resistance zone.
A pullback toward the broken trendline appears to be in progress. If price fails to reclaim the resistance, we expect a continuation of the decline toward the highlighted support levels.
Invalidation:
A daily close above the resistance zone would invalidate the bearish scenario and shift focus back to the upside.
Don’t forget to like and share your thoughts in the comments! ❤️

BTC/USDT: Breakout, Heading for a Bullish WaveBTC/USDT staged a strong breakout following dovish signals from the Fed at Jackson Hole, which drove capital back into risk assets, with Bitcoin among the biggest beneficiaries. At the same time, Tether’s move to increase transparency by appointing a former White House crypto adviser has further strengthened market confidence, supporting the medium-term bullish outlook.
On the chart, price is seeing a mild correction around 111,000–112,000 but remains within the long-term ascending channel. The 107,800 zone acts as key support; if it holds, BTC could rebound toward the next resistance area near 123,600. Conversely, a break below 107,800 would put the bullish structure at risk.
With favorable news and a strong technical setup, BTC/USDT continues to lean toward an upside scenario, making buy-the-dip strategies attractive.

BITCOINBTC is showing signs of weakness after breaking structure on the daily timeframe. I’m watching for price to retrace into the 4H FVG before continuing lower
This is just my personal view — not financial advice. What do you think? will BTC respect the FVG and drop, or push higher? 🚀📉

BTC Daily Symmetrical TriangleBINANCE:BTCUSD Bitcoin seems to be inside a symmetrical triangle pattern.
Powell's Speech Sparks Turmoil: BTC Surges and Pulls BackPowell's speech triggered a sharp surge in both BTC and gold 🚀. Amid such significant volatility, many traders will likely see their accounts wiped out 💥. BTC has pulled back today and may continue to drop to around 112,000 before rebounding ↘️↗️
⚡️⚡️⚡️ BTCUSD ⚡️⚡️⚡️
🚀 Sell@ 117000 - 11600
🚀 TP 115000 - 114000 - 113000
Daily updates bring you precise trading signals 📊 When you hit a snag in trading, these signals stand as your trustworthy compass 🧭 Don’t hesitate to take a look—sincerely hoping they’ll be a huge help to you 🌟 👇

BTCCRYPTOCAP:BTC is stuck in a range between 110K – 118K. Until a clean breakout happens, range trading or liquidity sweeps around these levels make sense.

Altcoin Pioneers Group TRADING | Bitcoin Daily Analysis Day1BINANCE:BTCUSDT
Altcoin Pioneers Group TRADING ™ | Bitcoin Daily Analysis Day1
👋 Welcome to Altcoin Pioneers Group TRADING ™!
Let’s analyze Bitcoin. Let’s explore the reason behind it and what Bitcoin’s next move might be.
The price appears to follow a descending triangle pattern 🔻, with two notable bottoms (Bottom 1 ⬇️ and Bottom 2 ⬇️) marked on the chart.
The price has declined 📉 from a higher level, forming a resistance line 🚧 (the upper boundary of the triangle) and a support line 🛡️ (the lower boundary) around 114,000 USDT.
A target price 🎯 of approximately 118,000 USDT is indicated, suggesting a potential breakout 🚀 above the resistance.
The current price is around 112,513.38 USDT 💰, with recent fluctuations 📊 showing a slight recovery ⬆️ after hitting Bottom 2.

Bitcoin – Bulls Hold the Edge After 110k BounceBitcoin – Trading Plan Update
Hello traders,
BTC has followed the scenario well, reacting strongly at 110.4k and bouncing higher. This level effectively cleared short-side liquidity, while the H4 candle failed to close below the 111.8k support. As such, long entries around 110k remain valid, with upside targets towards 115.5k.
The bias stays on the long side as long as price does not confirm a decisive bearish break. Long positions remain in play until price moves firmly below 110k.
For those who closed longs or missed the earlier move, watch for a retest of the FVG zone near 111.5k. If price reacts higher, fresh longs can be taken around 113k.
Short opportunities may also arise at resistance levels near 115.5k and 117.2k.
My BTC strategy continues to align with current market action. However, this is my personal view based on my trading approach. Always remain disciplined, manage risk, and follow your own plan.
What’s your outlook on BTC at this stage? Share your perspective in the comments below.

BTC CAN TURN MONDAY IN A GREEN DAY..📊 Market Update
On the lower time frame, BTC is still in a downtrend. However, there is a possibility of a green day if BTC targets the first level at 113.8K, with a 1-hour time frame confirmation.
The main confirmation for BTC will be at 115.4K. A move from 113.8K could provide an opportunity to consider new day trades.

TradeCityPro | Bitcoin Daily Analysis #163👋 Welcome to TradeCity Pro!
Let’s analyze Bitcoin. Yesterday, Bitcoin made a bearish move. Let’s explore the reason behind it and what Bitcoin’s next move might be.
⏳ 4-Hour Timeframe
Yesterday, during the New York session, a large number of Bitcoin were sold by one of the whales, which caused Bitcoin to make a large red 4-hour candle with high volume.
✨ This candle caused the price to make a long shadow below the range, and afterward, the price started to gradually decline. With the break of 112233, the price is now heading towards the 110183 support.
🔔 The 110183 zone is a very important support, and the price’s reaction to this zone will significantly impact the future market trend.
🧩 Bitcoin’s dominance trend is still bearish, and if this continues, altcoins could provide excellent long positions as long as Bitcoin doesn’t experience a sharp decline.
✔️ However, Bitcoin itself is still experiencing a lot of selling pressure, and the volume is still increasing. If this increase in volume continues, the price could reach at least the 110183 support.
💥 The RSI oscillator has reached near the 30 zone again. A break of this zone and entering Oversell would increase the likelihood of further bearish movement.
⚡️ For now, I’m not opening any positions and I’m waiting for the right structure to form before entering a trade.
❌ Disclaimer ❌
Trading futures is highly risky and dangerous. If you're not an expert, these triggers may not be suitable for you. You should first learn risk and capital management. You can also use the educational content from this channel.
Finally, these triggers reflect my personal opinions on price action, and the market may move completely against this analysis. So, do your own research before opening any position.c

THIS IS WHY BITCOIN DUMPED...Last night Bitcoin took a sharp hit – but why? In this video, we break it down with a skeptical lens . From forced selling by companies holding crypto in their treasuries to the impact of Wall Street’s institutional players, we’ll uncover the possible reasons behind the drop and what it could mean going forward. Plus, we’ll talk about risk management, diversification, and why stop-losses matter more than ever.
💡 Trade smart, keep risk tight, and don’t FOMO. Share your thoughts in the comments, boost if it helps

Analytics: market outlook and forecasts
📈 WHAT HAPPENED?
Last week, Bitcoin declined to a significant low of $112,000, where it formed a small false breakout.
Amid news of a potential key rate cut in September, the price broke through the descending trendline. The first volume zone was passed without a reaction; however, in the $117,200-$119,000 zone (accumulated volumes), Bitcoin corrected and subsequently found no support until it formed a new low.
The overall context is now shifting back to the bearish side. The key support zone of $110,000-$105,000 (accumulated volumes) has still not been tested, and its proximity makes this range a natural "magnet" for the price. At the same time, significant resistance levels based on volume have formed above the current price.
💼 WHAT WILL HAPPEN: OR NOT?
The current market situation appears highly manipulative, and the lack of reaction in the mirror volume zone around ~$115,000 only reinforces this impression.
We anticipate a test below the $110,000-$105,000 support zone. From this level, buyers will most likely resume their activity.
Buy Zones:
$110,000–$105,000 (accumulated volumes)
Sell Zones:
$114,400-$115,500 (volume zone)
~$116,500 (volume anomaly)
$117,200–$119,000 (accumulated volumes)
$121,200–$122,200 (buy absorption)
📰 IMPORTANT DATES
This week, we expect the following macroeconomic developments:
• Monday, August 25th, 14:00 (UTC) — US New Home Sales for July.
• Tuesday, August 26th, 14:00 (UTC) — US CB Consumer Confidence Index for August.
• Thursday, August 28th, 12:30 (UTC) — US GDP for Q2 and US Initial Jobless Claims for August.
• Friday, August 29th, 12:00 (UTC) — German Consumer Price Index (CPI) for August.
• Friday, August 29th, 12:30 (UTC) — US Core PCE Price Index for July and the year-over-year comparison (July 2024).
*This post is not financial recommendation. Make decisions based on your own experience.
#analytics

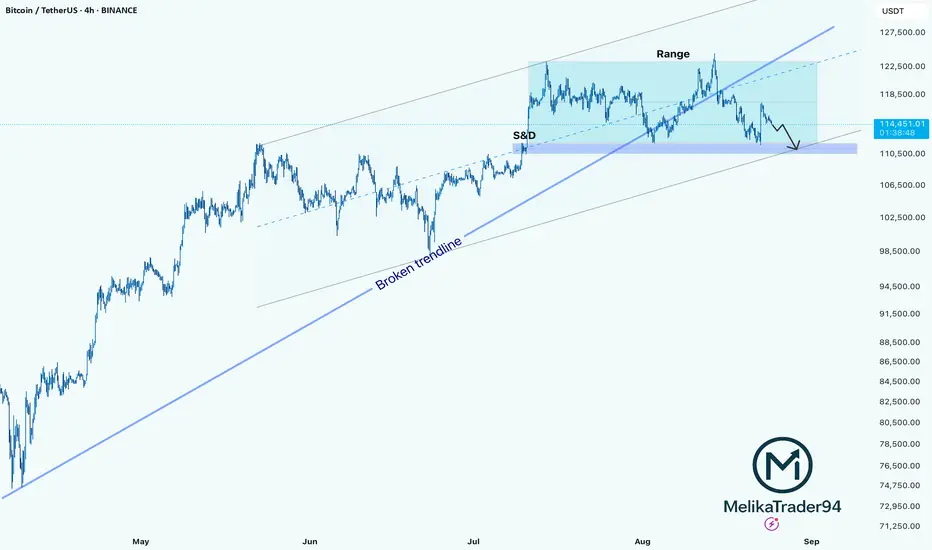
BTC Testing Key Demand Zone After Range BreakdownHello guys!
Bitcoin has been trading inside a clear range after breaking the previous trendline.
We had a Supply & Demand (S&D) reaction at the range’s beginning, and price is now moving lower after failing to hold above the broken trendline.
Currently, Bitcoin is approaching the demand zone (highlighted in blue). If price respects this area, we could see a bounce. Otherwise, a breakdown could trigger further downside movement along the lower channel.
For now, the bias remains cautious, watching how the price reacts to the 111,000–112,000 USDT zone will be key.
BTCUSDT. When will the buyer appear?Hi traders and investors!
Went exactly by the March 3 scenario.
Who would’ve guessed… and why didn’t anyone warn me?
Weekly candle with declining volume.
No strong buyer at the bottom of the trading range — no reason to go long.
The price will keep pushing lower and lower until it finally meets a strong buyer.
Wishing you profitable trades!

BTC recently broke through the descending channel Market picture and sentiment
The price is trading around $114,942, down slightly by about -0.65% on the day. Daily range: high - $115,833, low - $114,583.
The medium-term and long-term trend remains bullish, supported by large capital infusions (ETFs, institutional purchases).
Bernstein analysts suggest that the current bull rally could last until 2027, which is significantly different from the usual four-year cycles.
Support and resistance levels
Resistance:
The nearest zone is $120K-121K, where growth was expected to slow and consolidation.
The long-term target is $135K, and even $150K by 2026, according to analysts' forecasts.
Support:
Multiple bounce point at $110K–112K is critical to maintain bullish momentum.
Nearest technical support at $111.9K, followed by $107.4K and $105.2K.
Technical Momentum and Structure
Consolidation is seen around $113.8K, with volumes rising (to $48B), signaling pent-up interest despite short-term fatigue.
BTC recently broke out of its downward channel, a positive sign. RSI remains favorable, and declining balances on platforms indicate institutional accumulation.
A breakout of $114K could trigger upside potential to $143K (25%) and further to $200K, according to Rosenberg Research.

Why BITCOIN Looks Bearish ? (1D)Let’s break down why Bitcoin looks bearish:
1. A key support line has been lost.
2. Price is sitting on a key level. If this level breaks, bears will take control, and there won’t be any strong support until the green “flip zone” below. Once this key level is lost, it will flip into resistance.
3. The flip zone is still untested. When there’s an untested flip level, the market usually gravitates toward it after creating triggers in multi-timeframes.
4. From the point where we placed the green arrow on the chart, a bullish phase started. That bullish phase (WXY structure) has now completed.
5. The best area for a trend reversal and opening sell/short positions is the red zone.
On the way down, set intermediate targets for yourself, secure profits, and trail your stop-loss to lower levels.
This outlook will only be invalidated if a daily candle closes above the invalidation level.
For risk management, please don't forget stop loss and capital management
When we reach the first target, save some profit and then change the stop to entry
Comment if you have any questions
Thank You

Important range: 115854.56-119177.56
Hello, traders!
Follow us for quick updates.
Have a great day!
-------------------------------------
(BTCUSDT 1D chart)
This period of volatility is expected to last from August 23rd to 25th.
It found support near 111696.21 and rose above 115854.56.
Therefore, the key question is whether it can find support near 115854.56 and rise above 119177.56.
If it falls below 115854.56, it could fall to around 108353.0.
If it rises above 119177.56 this time and holds, it could attempt to rise near the right Fibonacci level 2.618 (133889.92) during the next volatility period, around September.
Therefore, we should watch for support in the HA-High ~ DOM (60) range of 115854.56-119177.56 and see if it rises above that level.
-
Looking at the OBV indicator of the Low Line ~ High Line channel, it appears to be transitioning into a downward channel.
Therefore, if the OBV indicator fails to rise above the High Line, there is a possibility of forming a short-term top.
-
Thank you for reading to the end.
I wish you successful trading.
--------------------------------------------------
- Here's an explanation of the big picture.
(3-year bull market, 1-year bear market pattern)
I will explain more in detail when the bear market begins.
------------------------------------------------------

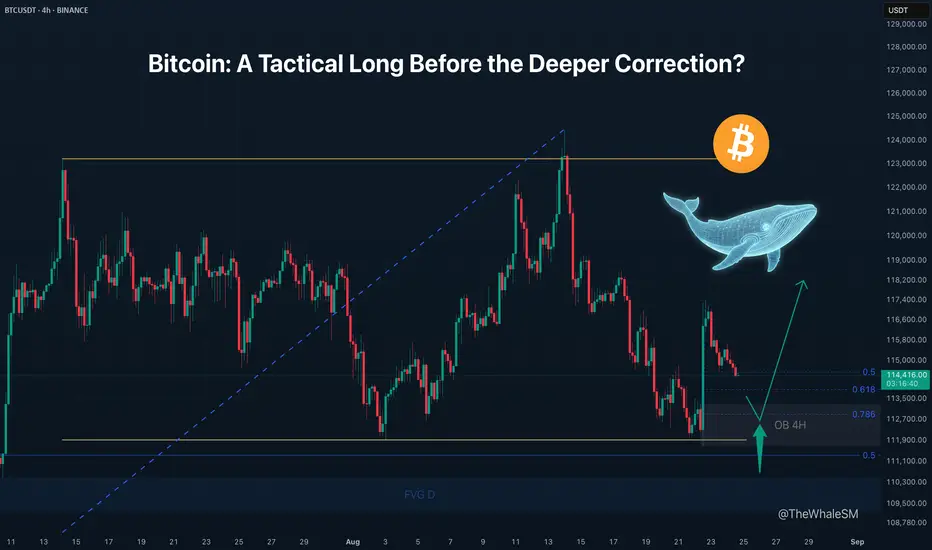
Bitcoin: A Tactical Long Before the Deeper Correction?After the "fake" update of its ATH, the price of Bitcoin confirmed the formation of a range on the weekly/daily timeframe, as it became clear that the new ATH was just a liquidity sweep of the previous one and a deviation at the top of this range.
Before a new, legitimate ATH is formed, I was expecting a correction on the higher timeframe to the levels I described in my previous global Bitcoin analysis: " Bitcoin's Tumble: How Deep Does the Rabbit Hole Go? ". However, Powell's unexpected statement last Friday about a possible interest rate cut in September led to an intensive weakening of the Dollar Index by 1%, pausing Bitcoin's deeper corrective dive and causing its return inside the range.
Just before this news event, the price managed to sweep the external liquidity from the lower boundary of the range (which was essentially a deviation below) and formed a 4H order block in the process. This order block, in conjunction with the 61.8% or 78.6% local retracement levels , can be considered as an intermediate long scenario , with targets at the midline of the range or its upper boundary. I consider the formation of a new ATH from this local POI (the 4H order block) a less probable scenario compared to the instrument still needing a deeper correction first.
The conditions for this local setup to form will be the mitigation of the 4H order block with a concurrent reach of the 61.8% or 78.6% local retracement levels, price finding acceptance above one of them, and the beginning of a bullish order flow on the LTF.
► Invalidation: The invalidation of the long scenario would be a break of the 78.6% level.
► Risk Factor: An important context that could affect the probability of the setup is that liquidity in the form of the Previous Week's Low (PWL) will be formed just below the order block. If the price gets too close to it when reaching the 78.6% level, this liquidity could act as a magnet and pull the price out of the range to the downside, towards the corrective levels from my global analysis.
~~~~~~~~~~~~~~~~~~~~~~~~~~~~~~~~~~~~~~~~~~~~~~~~~~~~~~~~~~~~~~~~~
The principles and conditions for forming the manipulation zones I show in this trade idea are detailed in my educational publication, which was chosen by TradingView for the "Editor's Picks" category and received a huge amount of positive feedback from this insightful trading community. To better understand the logic I've used here and the general principles of price movement in most markets from the perspective of institutional capital, I highly recommend checking out this guide if you haven't already. 👇
P.S. This is not a prediction of the exact price direction. It is a description of high-probability setups that become valid only if specific conditions are met when the price reaches the marked POI. If the conditions are not met, the setups are invalid. No setup has a 100% success rate, so if you decide to use this trade idea, always apply a stop-loss and proper risk management. Trade smart.
~~~~~~~~~~~~~~~~~~~~~~~~~~~~~~~~~~~~~~~~~~~~~~~~~~~~~~~~~~~~~~~~~
If you found this analysis helpful, support it with a Boost! 🚀
Have a question or your own view on this idea? Share it in the comments. 💬
► Follow me on TradingView for timely updates on THIS idea (entry, targets & live trade management) and not to miss my next detailed breakdown.
~~~~~~~~~~~~~~~~~~~~~~~~~~~~~~~~~~~~~~~~~~~~~~~~~~~~~~~~~~~~~~~~~
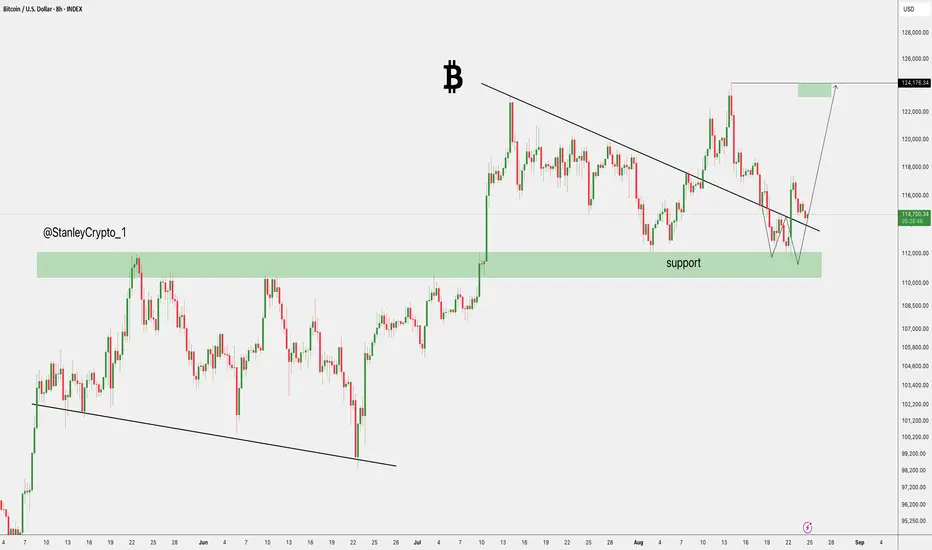
$BTC Looks Ready to Break OutCRYPTOCAP:BTC is holding steady above its support zone and showing signs of breaking out of the downtrend.
If it holds this momentum, a move toward the 124,176 level could be on the table, keeping the bullish setup alive.
DYOR, NFA
BTC 1H Analysis – Key Triggers Ahead | Day 21💀 Hey , how's it going ? Come over here — Satoshi got something for you !
⏰ We’re analyzing BTC on the 1-hour timeframe timeframe .
👀 On the 1-hour timeframe of Bitcoin, we can see that Bitcoin has still maintained a good bullish trend after breaking out of the channel and is currently in correction, but it hasn’t yet formed a proper structure for trades.
⚙️ The key RSI zones are 40 and 70. When the oscillator crosses these levels, trading volatility increases and this will cause price movement.
🕯 Candle size and volume grew during the Jackson Hole event, but since the market is in holidays, there isn’t much volume present. We need to wait for the opening of the next weekly candle for volume to enter the market.
💵 On the 1-hour timeframe of USDT.D , we can see that during the Jackson Hole event, Tether dominance moved strongly downward into an oversold area, and a large amount of Tether entered the market.
🔔 Bitcoin alarm zones are still the same as before. Breaking these levels can give us positions. Since Bitcoin hasn’t built a complete structure yet and the market is in holidays, we won’t take trades.
❤️ Disclaimer : This analysis is purely based on my personal opinion and I only trade if the stated triggers are activated .
