From 107K to 104K — Bitcoin’s Next Stop Before the Big Drop?An update to my previous Bitcoin outlook — we’ve almost reached my 107K target.
Now, I’m setting a new short-term goal at 104K, though I believe we might even dip toward 100K.
Let’s see how the chart reacts as we approach the 104K zone.
On a larger scale, as I mentioned in one of my earlier posts, my global target remains around 83K.
The invalidation zone for this scenario is marked directly on the chart.
Let’s summarize 👇
📉 Nearest target: 107K (almost reached)
📉 Next target: 104K
📉 Possible drop to: 100K
🌋 Global target: 83K
👁️Follow me so you don’t miss future updates to my forecasts!
BTCUSDT

BTC Scalp Sell/Short Setup (15M)The trend and structure are bearish, and Bitcoin is approaching a bearish origin point. If it fails to break through this origin, the low that created this bullish wave will be at risk.
With this in mind, we can prepare a position for Bitcoin with a risk-to-reward ratio of 1:2.
The last bullish wave on the lower timeframes also has a bearish CH.
Let’s see what happens.
For risk management, please don't forget stop loss and capital management
When we reach the first target, save some profit and then change the stop to entry
Comment if you have any questions
Thank You

BTC/USDT 1H Chart Short-Term📉 Descending Channel (black lines)
The price previously moved within a clear descending channel, which was broken upward.
A breakout from the channel signals a change in the short-term trend – from supply pressure to an attempted rebound.
From a technical perspective, a breakout from a descending channel often leads to an upward correction, the extent of which is at least the midpoint of the previous downward impulse.
🔷 Triangle Formation (blue lines)
After breaking out of the channel, the price formed a symmetrical triangle (consolidation) – a sign of market indecision.
Triangles of this type are often trend continuation patterns, but in this context – after a breakout from a descending channel – an upward breakout (i.e., a further upward rebound) is more likely.
The key resistance level to watch is $111,145 – a breakout with volume confirmation would open the way to $112,320 and then $113,921.
🧭 Key Technical Levels
Resistance:
$111,145 – local resistance (upper boundary of the consolidation/triangle).
$112,320 – another strong resistance level from the previous local high.
$113,921 – major medium-term resistance.
Support:
$110,442 – lower boundary of the triangle (short-term support).
$108,793 – support after the recent bounce.
$107,285 – next demand level.
$104,969 – bulls' defensive boundary in the broader context.
📊 Stoch RSI (bottom of the chart)
The Stoch RSI oscillator is currently in a rebound phase from the neutral level (~40–60).
If the lines (blue and orange) cross upwards and enter the zone above 80, this could confirm bullish momentum and a breakout from the triangle to the upside.
However, a rejection from 60 and a further drop below 20 would signal a false breakout and a possible retest of USD 108,800.
🔎 Scenario Summary
➡️ Upside Scenario (more likely):
Breakout from the triangle to the upside (confirmed by a 1-hour candle above USD 111,150).
Potential move to USD 112,300 → USD 113,900.
Momentum indicators support a rebound if the Stoch RSI maintains its upward trend.
⬇️ Downside scenario (alternative):
Unsuccessful breakout and return below $110,400.
A correction to $108,800 can then be expected, and if this level is broken, a further decline to $107,300.

BTCUSDT -- Is 98K a key level??BTCUSDT -- Is 98K a key level and we see another ATH or we already hit the top of this cycle?
I would like some insights from expert and experienced traders here.

TradeCityPro | Bitcoin Daily Analysis #207👋 Welcome to TradeCity Pro!
After a short break, let's get back to the daily Bitcoin analysis. The market is still in a very large range box.
⏳ 1-Hour Timeframe
Currently, Bitcoin is recovering after the drop to the 106319 level and has moved up to 110803.
✅ Today is Saturday, and as you can see, the market volume has dropped significantly. It seems that the market may range until tomorrow afternoon and won't move much upwards, with the main movement starting next week.
⚡️ The triggers we have for opening positions right now are:
For long: 110803
For short: 108844 and 106319
💥 Overall, Bitcoin is in a very large range box between 106319 and 115808, and as long as the price stays between these two levels, I will open my positions with very low risk.
❌ Disclaimer ❌
Trading futures is highly risky and dangerous. If you're not an expert, these triggers may not be suitable for you. You should first learn risk and capital management. You can also use the educational content from this channel.
Finally, these triggers reflect my personal opinions on price action, and the market may move completely against this analysis. So, do your own research before opening any position.

what if $BTC Bitcoin has been trading within this ascending channel for years.
It has repeatedly touched the red resistance line but has never broken through.
Now, it's quietly recovering within the lower band.
The next upward move is $200k which coincides with the red resistance line.

ElDoradoFx – BTCUSD WEEKEND ANALYSIS (01/11/2025)
🧭 1️⃣ Market Overview
Bitcoin has entered a consolidation phase following rejection near 111,600. Despite the weekly bearish close, price remains above key structural support around 108,600 and the long-term 50 EMA. The medium-term trend is corrective but still sits within a larger macro uptrend. Bulls must defend 109,600–109,900 and break 111,000 to regain control, while bears look for continuation below 109,500.
⸻
📊 2️⃣ Technical Breakdown
✅ Weekly (W1)
• Structure: Macro bullish, currently retracing within an ascending channel.
• Support zone: 108,000–105,000 (major demand + EMA confluence).
• RSI: 51 – neutral midrange; momentum slightly cooling.
• MACD: Weak bearish histogram, suggesting temporary correction.
→ Interpretation: Still structurally bullish unless 108,000 breaks.
✅ 1-Hour (H1)
• Price consolidating between 111,000 resistance and 109,600 support.
• EMAs (20–50–200) compressing — breakout imminent.
• RSI hovering near 54; momentum neutral.
→ Interpretation: Breakout from triangle formation expected; direction depends on 111,000 or 109,600 break.
✅ 15M–5M (Intraday)
• Multiple BOS events show mixed order-flow.
• RSI showing mild bullish divergence from 109,800 lows.
• MACD flattening – low volatility phase before expansion.
→ Interpretation: Expect liquidity sweep before directional push.
⸻
📐 3️⃣ Fibonacci Analysis
Swing Range: 108,605 → 111,611
Level Price Observation
38.2% 110,493 EMA alignment + intraday support
50.0% 110,108 Structural midpoint
61.8% 109,723 Trendline + liquidity pool
✅ Golden Zone: 110,493 – 109,723
→ High-probability buy zone aligned with EMA50 (H1).
⸻
🎯 4️⃣ High-Probability Trade Scenarios
🟢 BUY SCENARIOS (Primary Bias)
Scenario A – Breakout Continuation
• Trigger: Break & retest above 111,000–111,100
🎯 TP1 → 111,600 TP2 → 112,000 TP3 → 112,500
🛑 SL → Below 110,400
Scenario B – Golden Zone Dip Entry
• Trigger: Bullish rejection inside 110,493–109,723
🎯 TP1 → 111,000 TP2 → 111,600 TP3 → 112,000
🛑 SL → Below 109,300
⸻
🔻 SELL SCENARIOS (Alternative)
Scenario A – Breakdown Confirmation
• Trigger: Break & retest below 109,600–109,900
🎯 TP1 → 108,900 TP2 → 108,200 TP3 → 107,600
🛑 SL → Above 110,200
Scenario B – Rejection from Resistance
• Trigger: Bearish engulfing at 111,600–111,800
🎯 TP1 → 110,500 TP2 → 109,800
🛑 SL → Above 112,000
⸻
🕐 5️⃣ Fundamental Watch
• DXY stable near 104.9; neutral macro tone.
• US equities consolidating; crypto sentiment balanced.
• No major weekend news – expect liquidity-driven volatility.
• ETF and halving expectations continue to support long-term bullish bias.
⸻
⚙️ 6️⃣ Key Technical Levels
Type Levels
Resistance 111,000 / 111,600 / 112,000
Support 110,100 / 109,600 / 108,600
Golden Zone 110,493 – 109,723
Breakout Confirmation Above 111,100 or Below 109,600
⸻
🧾 7️⃣ Analyst Summary
BTC remains within a corrective structure but is positioned near equilibrium. Bulls retain the advantage above 110,000, targeting a clean breakout toward 112,000+, while sellers only gain momentum on a confirmed close below 109,600. The Golden Zone (110,493–109,723) is the highest-probability buy area, providing both trendline and EMA confluence.
⸻
📈 8️⃣ Final Bias Summary
🟢 Bullish above 110,000 → Targets 111,600 / 112,000
🔻 Bearish below 109,600 → Targets 108,800 / 108,000
⸻
🥇 ElDoradoFx PREMIUM 3.0 – PERFORMANCE 31/10/2025 🥇
📅 Closing the month with precision and momentum.
━━━━━━━━━━━━━━━
❌ ASIA SELL LIMIT -60 PIPS (SL)
🟢 BUY +150 PIPS
🟢 BUY RE-ENTRY +150 PIPS
🟢 BUY +320 PIPS
🔻 SELL +30 PIPS
🟢 BUY +100 PIPS
🟢 BUY +150 PIPS
━━━━━━━━━━━━━━━
💰 GOLD TOTAL PIPS WON: +840 PIPS
📊 7 Trades → 6 Wins | 1 SL
🎯 Accuracy: 86%
━━━━━━━━━━━━━━━
🔥 Strong finish to the month — bullish follow-throughs and precise timing on entries delivered another profitable session!
👏 Congratulations if you profited! ✅✅✅🚀🚀🚀

ATH incoming...The price will rise to $115,000 and then drop to the $103,000 range. This movement is driven by the liquidation of long and short positions. After collecting these liquidations, the price is expected to return to its previous all-time high (ATH)

Has Bitcoin already priced in its next move ? | Day 56☃️ Welcome to the cryptos winter , I hope you’ve started your day well.
⏰ We’re analyzing BTC on the 1-Day timeframe .
👀 Bitcoin on the daily timeframe. After the flash crash it experienced, Bitcoin is almost building a box with a top at $114,559 and a bottom at $106,431, which by breaking these areas, it can get out of this trading range and give us a position.
The noteworthy point in the recent days is the Monday meeting between Trump and the President of China, which can determine the destiny of the market and give it a good direction.
🧮 The RSI oscillator, two key zones have formed for us in the areas of 54.5 and 36, and by the fluctuation limit crossing these areas, the next move of Bitcoin can begin.
🕯 Bitcoin’s volume on the daily timeframe has increased sharply after recording a new all-time high, and this has been a tendency toward increasing selling pressure. In the image, it is completely clear that you can see exactly what happened to the market after the flash crash it experienced.
📈 To take a position with this structural style that we currently have, you can refer to the multi-timeframe analysis of Bitcoin and extract the long and short position triggers, and if Bitcoin gives you an entry, enter the position around the anticipated top or bottom with low risk so that later you can add more volume to your position at higher or lower levels.
❤️ Disclaimer : This analysis is purely based on my personal opinion and I only trade if the stated triggers are activated .

BTC/USDT Setup Confirmed – Capital Flow Points to Upside!🚀 BITCOIN (BTC/USDT) Capital Flow Blueprint: Smart Pullback + Liquidity Grab Strategy
📊 Setup Overview
Asset: BTC/USDT | Strategy: Swing Trade | Bias: Bullish with Pullback Confirmation
🎯 Trading Plan Thesis
Bullish structure confirmed with Volume-Weighted Moving Average (VWMA) Pullback + Liquidity Zone Grab. Bitcoin continues to accumulate at demand zones while respecting higher timeframe resistance. This layered entry strategy captures value during temporary pullbacks before the next impulse.
Current Market Context: BTC trading near $109,768 (as of November 1, 2025)
📍 Entry Strategy: Multi-Tier Limit Orders (Layering Method)
Think of this as smart accumulation zones rather than one aggressive entry:
Layer 1: $106,000-107,000 (Deep pullback target)
Layer 2: $107,500-108,000 (Mid-level support)
Layer 3: $108,500-109,000 (Current support zone)
Ratio: Scale position size across layers (30%-40%-30% allocation suggested). This approach reduces timing risk and averages your entry price during volatility.
🛑 Stop Loss: Risk Management First
SL Level: $105,000
Rationale: Sits below the 4-hour swing low, providing buffer for wick rejection while maintaining favorable risk-reward ratio
⚠️ Risk Disclaimer: Stop loss placement is YOUR decision based on your account size and risk tolerance. Never risk more than 2% of your trading capital per trade.
📈 Take Profit: Multi-Exit Strategy
Target: $119,000
Confirmation: ATR (Average True Range) acting as resistance + Overbought RSI confluence + Previous resistance break
Exit Plan:
Partial 1 (50%): $115,000 (Take some profits early)
Partial 2 (30%): $117,000 (Lock in most gains)
Final (20%): $119,000 (Let runners chase the moon 🌙)
⚠️ Risk Disclaimer: Profit targets are based on technical analysis. Market conditions change. Take profits at levels that suit YOUR strategy and risk profile.
🔗 Correlated Pairs to Monitor (Market Ecosystem Check)
Direct Correlation Pairs:
ETH/USD ($3,865): Major altcoin bellwether. Watch 1-4 hour RSI divergence
BNB/USD (~615): Binance ecosystem health indicator
SOL/USD (~245): Alt season strength confirmation
Inverse Watch:
USDT Dominance: If BTC dominance drops >59%, profit-taking likely incoming
VIX Index: Higher volatility = more chop (avoid during spikes)
💡 Key Technical Points
✅ Volume Profile: Sellers exhausted at $105K-106K zone
✅ Order Flow: Institutional absorption at weekly support
✅ Micro Resistance: $112,000-113,500 (breakout confirmation needed)
✅ Macroeconomic: Fed sentiment + Bitcoin ETF flows = liquidity tailwind
⚡ Pro Tips for Better Execution
Timeframe: Confirm entry on 4-hour chart before scaling on 1-hour bounces
Volume Filter: Only take Layer 1/2 if volume > 20-day average
News Calendar: Avoid entries 2 hours before major economic data
Trail Stop: Move stop to breakeven once price hits Layer 3 + $1,000
🎁 Community Love
✨ "If you find value in my analysis, a 👍 and 🚀 boost is much appreciated — it helps me share more setups with the community!"
#Bitcoin #BTC #CryptoTrading #SwingTrade #TechnicalAnalysis #LiquidityGrab #VWMA #CryptoChart #TradingStrategy #CryptoSignals #LayeringStrategy #BTCUSD #CryptoAnalysis #TraderLife #AlgoTrading

Bitcoin - The manipulation!On the weekly Bitcoin chart, there’s a clear bearish rising wedge pattern, and right now it’s trading near the lower side of that wedge — getting ready for a downward weekly breakout.
But let me remind you of something important — this will likely be part of a psychological game played by market makers, so remember my words carefully:
- Bitcoin will break down from the wedge, giving a bearish signal, and many traders will enter short positions.
- It’ll even dip slightly below the 50 EMA, making everyone more confident in the bearish move.
- Then, it’ll reverse sharply upward, liquidating all the short positions.
Market makers always make you believe your plan is playing out perfectly — right before they turn against you and take your money.
So stay alert, place your buy orders slightly below the 50 EMA, and avoid using high leverage.
Best Regards:
Ceciliones🎯

Has Bitcoin entered the distribution phase yet?👋🏻 Hey everyone! Hope you’re doing great! Welcome to SatoshiFrame channel.
✨ Today we’re diving into the 4-Hour Bitcoin analysis. Stay tuned and follow along!
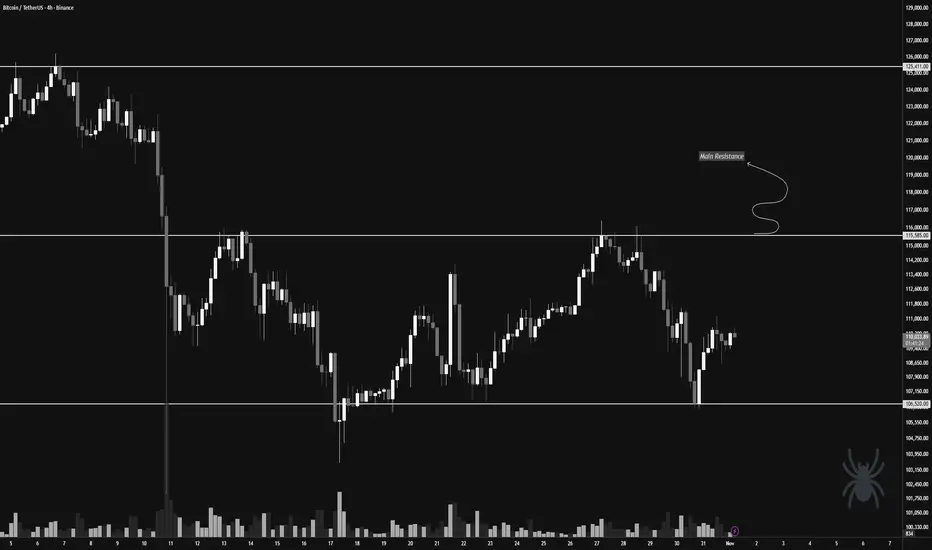
👀 On the 4-hour timeframe, we can see that Bitcoin recently dropped due to the impact of the FOMC news but then rebounded from the key support level at $106,520 and is now facing its multi-timeframe resistances. Looking at the chart more broadly, we notice equal highs and lows around the $115,585 and $106,520 zones. With a breakout of either of these levels, Bitcoin could experience a sharp and significant move.
🧲 Bitcoin’s selling volume has slightly increased, and if the supports break, this selling could turn into pressure — collectively applying downward force on the market price. Then, buyers may re-enter and start buying Bitcoin again. The hypothesis of a possible distribution phase could turn into a valid theory; however, we must be cautious — if Bitcoin decides to move upward after Monday’s session, it could confirm a new all-time high and continue its upward trend.
✍️ The main scenario for Bitcoin lies around the $115,585 price zone. If this level breaks, we could enter a long position and stay with it for a potentially extended upward move. It’s worth noting that an increase in buying volume along this path could serve as a strong confirmation for our long position.
On the other hand, the short position scenario would become valid if the price breaks below the support and selling pressure intensifies, giving us a high-momentum short setup.
❤️ Disclaimer : This analysis is purely based on my personal opinion and I only trade if the stated triggers are activated .
BTC/USDT 4HOUR CHART UPDATE !!BTCUSDT 4-Hour Chart Update and Analysis
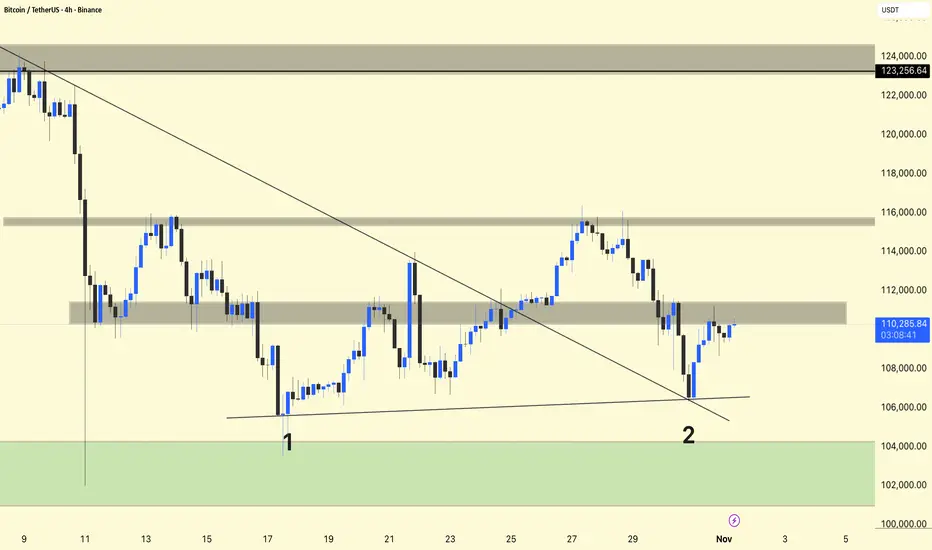
Support: BTC has successfully formed two higher lows near $106,000-$107,000 (marked 1 and 2), indicating that the green area remains strong.
Resistance: The price is currently facing resistance near $111,500. This area served as previous support and could now limit short-term upside.
Trend: Price activity is showing stabilization after a pullback and is attempting to reclaim the breakdown level.
Outlook: Sustaining above the trendline and the $109,500-$110,000 range provides bullish support. If resistance is broken, a return to $113,000-$115,000 is targeted.
DYOR | NFA
BTC Weekend Setup — Possible Volume Push Toward 116KBTC Weekend Setup — Possible Volume Push Toward 116K 🔥
Coinbase effect + China can play an important role for the breakout of 116K+
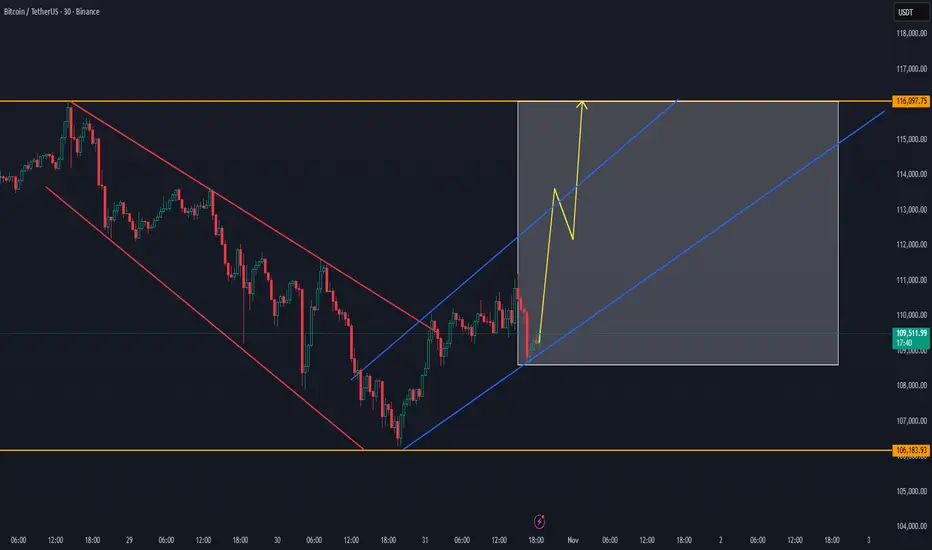
Bitcoin has broken out of its descending channel, reclaiming structure and showing early signs of strength.
Momentum is gradually building within the new ascending trend, suggesting that the weekend could bring a volume expansion targeting the 116K zone.
📈 Technical Outlook:
BTC successfully flipped the 106K–108K area into support.
The new uptrend channel is forming higher lows and showing a steady recovery pace.
Volume remains low but is expected to increase into the weekend, often a period of volatility and directional moves.
🎯 Targets:
First resistance: $112K–$113K
Main target zone: $115K–$116K
If volume confirms, a push to 116K could complete this short-term recovery cycle.
⚠️ Risk note:
Failure to hold above $108.5K could slow momentum, bringing price back to retest lower trendline support.
💬 Summary:
BTC is positioned for a potential weekend volume push, with a clear channel structure guiding price toward the 116K resistance zone. Momentum is cautiously bullish — watching for confirmation through weekend trading activity.
Bitcoin Weekend Volume Could Exceed 116K as Smart Money Accumula📊 Market Update
Bitcoin has been building strength since the 106K–107K level, showing signs of a new uptrend. Both the lower time frames and the main trend are currently positive. There’s a strong possibility that BTC will target 112K as the first level, with 116K+ also possible depending on the weekend trading volume.
🔹 Market Structure
The market structure is gradually building, suggesting smart money inflows into BTC over the last 10 hours. We’ll continue tracking this development closely further

My expectations for November and December.According to my possible wave counts the first week of November may be a sell-off, then the direction may be upwards, and declines may occur with the Christmas holiday.
Note: It's shown on a 1-hour chart, but waves will form over longer timeframes. So, disregard the date chart you see at the bottom of the page.
* The purpose of my graphic drawings is purely educational.
* What i write here is not an investment advice. Please do your own research before investing in any asset.
* Never take my personal opinions as investment advice, you may lose your money.

Fair Value Gaps: The Market Secret You Shouldn’t IgnoreEver scrolled through a chart and spotted a weird empty space in the candles — like the market just skipped a beat? That’s a Fair Value Gap (FVG). It’s one of those subtle price imbalances smart traders love to hunt for. Understanding how these gaps form and how price reacts around them can seriously level up your chart-reading game.
What Is a Fair Value Gap in Trading?
A Fair Value Gap happens when there’s a sudden surge in buying or selling pressure that causes price to move so fast, it doesn’t fully balance out between buyers and sellers. In simple terms, it’s an imbalance — a zone where the market skipped over potential orders.
When you hear traders talking about FVG in trading, they’re referring to those little pockets of unfilled liquidity left behind during strong moves.
So, what is FVG in trading, and why does it matter? Because price often comes back to those areas later to “rebalance” — filling the gap before continuing in the original direction. That’s the core logic behind Fair Value Gap trading.
Bullish and Bearish FVGs
There are two main types of Fair Value Gaps — bullish and bearish:
Bullish Fair Value Gap (bullish FVG): Forms during a strong upward move, when aggressive buyers push price higher, leaving a void below. Price might later dip back into that zone before continuing upward.
Bearish Fair Value Gap (bearish FVG): Forms in a sell-off, when sellers dominate and the market drops quickly, skipping over potential buy orders. Later, price often retraces upward to “fill” that gap.
Both can act as magnets for liquidity — areas where smart money likes to re-enter the market.
Fair Value Gap Example
Let’s say Bitcoin jumps from $110,000 to $120,000 in a single bullish candle, with almost no trading in between. That sudden move leaves a Fair Value Gap — the zone between the candle’s high and low where little to no trading took place.
If the market later pulls back to that range and finds support before bouncing, you’ve just witnessed a textbook Fair Value Gap example in action.
Using a Fair Value Gap Indicator
You can spot these zones manually by looking for three-candle structures — one candle that “leaves the gap” and two surrounding it that don’t overlap. But if you prefer automation, you can use a Fair Value Gap indicators:
Fair Value Gap Trading Strategies
Fair Value Gap trading isn’t about chasing price — it’s about waiting for the market to come back to you. Within Smart Money Concepts, traders often combine FVGs with CHoCH (Change of Character) to confirm a potential shift in structure before entering.
A common approach is to mark recent FVGs, identify the broader trend, and wait for price to revisit a gap in line with that trend.
In a bullish trend , traders look for bullish FVGs below current price as potential demand zones — ideally after a CHoCH confirms that buyers are stepping back in.
In a bearish trend , they watch for bearish FVGs above current price as potential supply zones, again validated by a CHoCH showing a shift in control.
Still, it’s important to remember — these setups are not guarantees. The market doesn’t owe you a fill. Use FVGs and CHoCH as part of the Smart Money framework, not as standalone signals. Always manage risk and make your own trading decisions based on your personal strategy and comfort level.
Final Thoughts
So, what is a Fair Value Gap really? It’s not magic — just the market showing where it moved too fast. Learning to read Fair Value Gaps gives you insight into liquidity, momentum, and potential reversals. Whether you use a Fair Value Gap indicator or mark them by hand, mastering FVG in trading can give you a serious edge in spotting high-probability zones.
Just keep in mind — no indicator or setup replaces good judgment.
Observe, adapt, and let the charts speak for themselves.

Today's Bitcoin Trading StrategyTechnical aspect: "Support broken + Trend continuation", the bearish dominant pattern has been established
The price has successfully broken through the key support range: $109,100 is located between the psychological threshold of $110,000 and the 200-day moving average ($107,846). The 1-hour chart shows that after the price continuously attempted to reach $110,000 for 3 times without success, it formed a "head and shoulders top" pattern and broke through, with the neckline at $109,500 being lost. After that, the decline measured pointed to $107,000. More importantly, the 50-day moving average at the daily level has crossed below the 100-day moving average, forming a "death cross". This is the first medium-term bearish signal since 2024 May. Historical data shows that when such a technical combination occurs, the average decline within 5 trading days is 5.3%. Meanwhile, although the RSI indicator has entered the oversold zone, there is no divergence signal, indicating that the downward momentum has not yet exhausted.
Today's Bitcoin Trading Strategy
sell:109000-110000
tp:108000-107000
sl:111000

Multidimensional short-selling strategies and in-depth analysisFunding situation: "Institutional wait-and-see + Small investors' takeover", with a disparity in takeover strength
ETF and on-chain data show a distinct divergence: During the rebound period, the net inflow of the US Bitcoin spot ETF was only 0.8 billion US dollars, significantly less than the selling scale (5.2 billion US dollars) during the previous decline. This indicates that institutions have a low recognition of the rebound; while on-chain small addresses (1-10 BTC) increased their holdings by 62% around 110,000 US dollars, contrasting with the net outflow of whales (1000+ BTC), presenting a dangerous structure of "small investors' takeover + large players' cash-out". The derivatives market exposes more risks: Although the short-to-long ratio of perpetual contracts has risen from 0.89 to 1.02, the long positions are concentrated on platforms dominated by small and medium-sized investors (such as Huobi, with a 54% long position), while the long positions on leading platforms (Coinbase, Binance) are only 49.3%, indicating a disparity in capital quality that suggests the rebound is unlikely to last.
Cross-market "risk assets' linkage retreat", with valuation anchors moving downward
The 30-day correlation between Bitcoin and the Nasdaq 100 Index dropped from 0.75 to 0.61, and the weakened synchronization is due to the overall pressure on risk assets: The earnings reports of leading US technology stocks like Apple and Microsoft were below expectations, and the Nasdaq 100 Index broke below the 50-day moving average, leading to a cooling of risk appetite; at the same time, the hedging attributes of gold and US Treasuries have rebounded, with the 10-year US Treasury yield falling from 4.2% to 4.05%, indicating a clear trend of capital shifting from high-risk assets to safe-haven assets. This combination of "stock-currency linkage retreat + risk aversion rise" has deprived Bitcoin of external upward momentum, and its own valuation (the current price is still 1.8% lower than the average cost of institutions at 112,300 US dollars) has partially released the demand for valuation repair through the rebound.
Emotional aspect: "Rebound overextension + expectation correction", optimism has peaked
The panic and greed index quickly rose from the "panic" range of 28 to the "neutral" range of 45, with short-term emotional recovery being too rapid, and the implied volatility (IV) of call options in the futures market (higher than put options IV) from -3% to +2%, indicating that the optimistic expectations for the rebound have been overpriced. Historical data shows that when the emotional indicator rises by more than 15 points within 3 trading days and the IV premium of options turns positive, the probability of a correction within the next 48 hours is 73%, and the overextension of the emotional aspect provides an opportunity for short sellers to reverse.
Today's Bitcoin Trading Strategy
sell:109000-110000
tp:108000-107000
sl:111000

Did you Know ?!!!Did you really think that profiting from the current bull run (a comprehensive upward market) would be easy? Don't be naive. Do you think they will let you buy, hold, and sell at low levels without any struggle? If it were that simple, everyone would be rich. But the truth is: 90% of you will lose. Why? Because the crypto market is not designed for everyone to win. They will shake you. They will make you doubt everything. They will panic you and sell at the worst possible moment. Do you know what happens next? The best players in this game buy when there is fear, not sell; because your panic gives them cheap assets. This is how the game goes: strong hands feed off weak hands. They exaggerate every dip, every correction, every sale. They make it look like the end of the world so that you abandon everything, and when the market starts up again, you'll sit there saying, "What the heck just happened?" This is not an accident. It's a system. The market rewards patience and punishes weak emotions. The big players already know your thoughts. They know exactly when and how to stir fear to make you give up. Because when you panic, they profit. They don't play the market. They play you. That's why most people never succeed. Because they fall into the same traps over and over again. People don't realize that dips, FUD (fear, uncertainty, doubt), and panic are all part of the plan. But the winners? They digest the noise. They know that fear is temporary, but smart decisions last forever. We've seen this hundreds of times. They pump the market after you sell. They take your assets, hold them, and sell them to you at the top, leaving you with nothing, wondering how it happened. Don't play their game. Play your own.
REMEMBER

BTC Falls with Strong DollarDollar rally is dominating the markets today after Powell is hinting that December cut is not a sure thing. BTC normally more focused on stock market than dollar so I bet on recovery. The lower line of the channel is 107300, but BTC often make spikes at key leves so I plan to enter 106890 with 4.52 RR ratio.

Do you think I'm joking ???I might be wrong and this might never happen, but it might come true From a technical perspective!!!
Give me some energy !!
✨We spend hours finding potential opportunities and writing useful ideas, we would be happy if you support us.
Best regards CobraVanguard.💚
_ _ _ _ __ _ _ _ _ _ _ _ _ _ _ _ _ _ _ _ _ _ _ _ _ _ _ _ _ _ _ _
✅Thank you, and for more ideas, hit ❤️Like❤️ and 🌟Follow🌟!
⚠️Things can change...
The markets are always changing and even with all these signals, the market changes tend to be strong and fast!!

BTCUSDT — Full Report (Oct 31, 2025 09:30 UTC)1. Macro and Fundamental Facts
- US Fed (Oct 30): Rate cut by 25 bps to 3.75–4.00%. This policy easing supports risk assets.
- Quantitative Tightening: From Dec 1 the balance sheet runoff stops; the Fed will reinvest, increasing dollar liquidity.
- US GDP Q3 (preliminary): +3.1% QoQ, confirming a soft landing.
- PCE Inflation (Oct 31, 12:30 UTC): Expected moderate growth; may cause short-term volatility.
- BTC ETFs (US): Mixed flows; after mid-month outflows, moderate inflows observed (Farside). Institutional demand remains stable.
2. Market Statistics (CoinGecko, weekly)
- 7-day range: $108,604–$115,957
- Today's 24h range: $108,201–$113,567
- Mid-point: $112,280
- Range / mid ≈ 6.55%
- October ATH: $126,080 (Oct 6)
- Market has stabilized after the early-October peak around 125‑126k.
3. Sentiment & Forecasts
- Fear & Greed Index: 37 (Fear) → cautious mood.
- Polymarket probabilities for 2025: ≥$130k ≈53%, ≥$150k ≈15%, ≤$80k ≈10%; market volume ≈$38M.
- Social tone: discussion of Fed easing and a possible retest of the ATH.
4. Key Levels This Week
- Support S1: $108.0–$108.6k (lower bound of the 7-day range)
- Support S2: $106–$107k (October accumulation zones)
- Resistance R1: $113–$116k (upper bound of the 7-day range)
- Resistance R2: $118–$120k (gateway to retest $125k).
5. Microstructure (SSE, Binance BTCUSDT)
Snapshot time: 2025-10-31 08:57:51 UTC (real-time SSE feed; delay ~80 ms).
- Last price (LTP): $110,043.82
- Bid / Ask: $110,043.81 / $110,043.82 → balanced.
- Spread: $0.01 ≈ 0.91 m-bps (ultra tight).
- Bid sum (top-20): 0.46 BTC → thin support below.
- Ask sum (top-20): 11.55 BTC → dense overhead layer.
- Imbalance: −0.923 → seller dominance.
- Orders per second: 46 orders/s → active flow.
- Net flow: +0.58 → orders coming into the market; buyers active.
- Micro-price: $110,043.81 ≈ mid → neutral.
- Health score: 80/100 → good liquidity.
Observation: there is instant dominance in the ask side. Order flow is positive, but for price to rise, the cluster at $110,043–110,045 (~5 BTC) must be absorbed. The book below is thin; a downward spike could drop $30–50 without much resistance.
6. Probability Assessment (1-week horizon)
Model: normal distribution around the mid ($112,280) with σ ≈1.64%.
- Range scenario ($109–$114k): ≈60%
- Upward scenario (> $116k; requires inflows): ≈12%
- Downward scenario (< $108.5k; reaction to inflation or ETF outflows): ≈12%
- Tail events (<$106k or >$120k): ≈4–6% each.
Microstructure indicates ask-side dominance, so a short-term pullback within the range is slightly more likely than an immediate breakout.
7. Practical Observations (no advice)
- Spread <1 m-bps → optimal conditions for limit orders.
- Rise in orders/sec above 50 with imbalance moving toward zero → market ready for an impulse.
- Spread >3 m-bps → decreasing depth and higher liquidity risk premium.
- Monitor FGI and ETF flows: FGI >40 and two days of ETF inflows often coincide with a break out of the range.
- Watch Polymarket: an increase in the ≥$150k probability above 20% signals stronger long-term optimism.
8. TL;DR
- The Fed eased policy (−25 bps; QT stop from Dec 1).
- BTC trades between $108.6k and $116k; mid ≈$112k.
- Sentiment is cautious (Fear 37).
- Microstructure: LTP $110,043.82; spread $0.01; ask dominance (imbalance −0.92); 46 orders/s; net flow +0.58.
- Probabilities for the next week: range 60%, upside 12%, downside 12%, tails 4–6%.
- Conclusion: the market is stable within the range; the macro backdrop is softening. A breakout requires absorption of ask clusters and confirmation from ETF inflows.
