TradeCityPro | Bitcoin Daily Analysis #162👋 Welcome to TradeCity Pro!
Let’s analyze Bitcoin. Since yesterday, Bitcoin hasn’t made any significant moves, so today I’ll analyze it for you on the 1-hour timeframe.
⏳ 1-Hour Timeframe
Since yesterday, Bitcoin has been sitting on a support level around 114612 and has touched this zone twice in the 1-hour chart.
📊 The volume has dropped significantly, which makes sense because it’s the weekend, and traders are waiting to see where the market will move in the coming week.
✔️ In my opinion, given Powell’s speech was positive for the market, the probability of Bitcoin turning bullish is higher, and with long position triggers being activated, the chance of profit increases.
⚡️ If the 115497 zone is broken, we can open a risky long position. I recommend keeping an eye on Bitcoin dominance while this trigger is being activated — if it’s still in a downtrend, then it’s better to open the position on altcoins.
✨ On the other hand, if the price moves downward, we can open a short position by breaking 114612. Personally, I still don’t think shorting is logical, and until I get confirmation of a trend reversal in higher cycles, I won’t open short positions.
🔽 But if you want to short, it should be for a short-term trade down to the 112233 support zone.
❌ Disclaimer ❌
Trading futures is highly risky and dangerous. If you're not an expert, these triggers may not be suitable for you. You should first learn risk and capital management. You can also use the educational content from this channel.
Finally, these triggers reflect my personal opinions on price action, and the market may move completely against this analysis. So, do your own research before opening any position.
BTCUSDT

FunTrade very Low Probability the price wont reach thereThis BTCUSDT setup is more like a funtrade ngl. Chances are the pending order won’t even trigger, and if it does… most likely it’ll hit SL. So yeah, just treat this one as entertainment
Hipotesis BCTUSDT Create a ATHBTC moving mad boring… pumps too fast then dumps. I’ll just set it a bit lower, let’s see if it actually runs to ATH this time 👀

Bitcoin 4H Chart | Trend is My Best Friend – Smart Money Points Bitcoin 4H Chart | Trend is My Best Friend – Smart Money Points to 119K 🚀🔥”
Market Structure
The price recently rejected the key resistance zone (120,000 – 123,000 USD), which acted as a strong supply area.
After the rejection, BTC experienced a sharp decline forming lower highs and lower lows, indicating short-term bearish momentum.
Multiple Break of Structure (BOS) levels confirm bearish pressure, but the price is now approaching a significant demand zone.
2. Liquidity & Demand Zones
A clear liquidity sweep occurred near the 123,000 zone, where buyers were trapped before the drop.
The Demand Zone and Bullish Order Block (OB) around 112,000 – 114,000 USD serve as the primary area of interest for institutional buying.
This zone overlaps with previous support, strengthening its validity as a high-probability reversal point.
3. Entry & Targets
Entry Zone: Highlighted between 114,000 – 115,500 USD, where demand is expected to absorb sell orders.
First Target: 119,000 USD – this aligns with the chart’s projection and acts as a liquidity grab zone before further moves.
Second Target: If bullish momentum sustains, BTC may retest the 120,000 – 123,000 resistance range.
4. Risk Factors
If BTC breaks below 112,000 USD, the demand zone will be invalidated, potentially opening downside continuation toward 110,000 USD.
Strong rejection at 119,000 USD could also bring sellers back into control.
📌 Conclusion
BTC is currently in a bullish accumulation phase after a heavy correction. Price is sitting at a high-probability demand zone where institutional buying interest is expected. The next impulsive move is projected toward 119,000 USD, with potential continuation toward 120,000 – 123,000 USD, but rejection at resistance remains a risk.

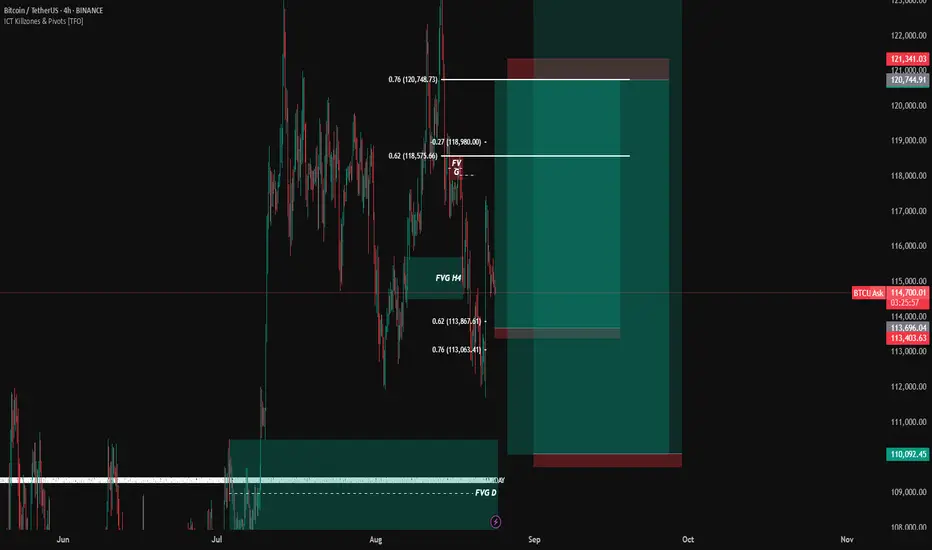
(BTC/USDT) – Rally Strengthened After Fed RemarksHello everyone, Bitcoin (BTC/USDT) is currently trading around $115,839 and approaching key Fair Value Gap (FVG) zones, particularly between $115,500 – $117,000. Following Fed Chair Jerome Powell’s speech at the Jackson Hole symposium, the market responded positively. Hints of potential rate cuts weakened the USD, encouraging capital flows into safe-haven assets like Bitcoin and reinforcing the current bullish momentum.
Rising trading volumes highlight buyer dominance, while Ichimoku cloud signals remain favorable with price staying above the cloud, clearly reflecting bullish sentiment.
Combining technical factors with macro news, Bitcoin’s short-term outlook continues to lean bullish. As long as price holds above the $115,500 – $117,000 FVG zone, the next upside target around $119,000 looks well within reach.
Bitcoin Is Still Bearish (4H)This analysis is an update of the analysis you see in the "Related publications" section
As we mentioned in the previous analysis, Bitcoin remains bearish, and our view has not changed.
We had considered two scenarios for Bitcoin, and both were bearish
Nothing has changed now either | from the current price or slightly higher, Bitcoin may see a serious correction. If the 103k zone is broken to the downside, Bitcoin’s price could correct down to the 93k area or even 86k.
Remember: when good news is released but the price cannot rally and make higher highs, the trend is bearish. It means market giants are selling to buy back at lower levels.
For risk management, please don't forget stop loss and capital management
When we reach the first target, save some profit and then change the stop to entry
Comment if you have any questions
Thank You

Bitcoin Looks Bearish (4H)This analysis is an update of the analysis you see in the "Related publications" section
We identified an **ABCDE structure** in the previous analysis.
Currently, the structure remains the same, with only wave **E** appearing to be completed.
The price moved close to the **first target** from the previous analysis but was rejected. This rejection seems to mark the beginning of a new bearish wave.
Now, it is expected that either from this point or after a slight upward pullback, the price will enter a correction for **wave D** or another bearish wave.
For risk management, please don't forget stop loss and capital management
When we reach the first target, save some profit and then change the stop to entry
Comment if you have any questions
Thank You

btc logTwo things are certain about Bitcoin: it has not yet reached its local peak, and it will continue to rise much higher.

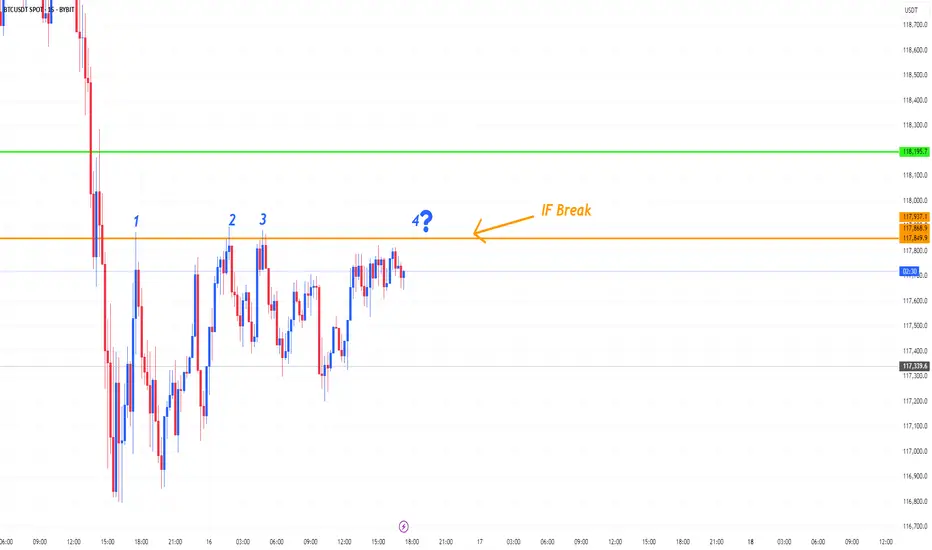
Is it possible to climb on the 4th attempt?
Hi my dears
In all the previous moves, a major resistance level has not been broken. Is there a possibility of this level being broken in the coming times? If and only if this level is broken with a good candle, then there is a possibility of an uptrend. So for now, the best decision is to watch.
What do you think, buddy?
BTCUSDT: Price Action Trade Bitcoin 121K!Hello friends, based on the price action levels and this phase change from a bearish mode and back to a broken level, Bitcoin is expected to reach the level of 121,000.

TradeCityPro | Bitcoin Daily Analysis #161👋 Welcome to TradeCity Pro!
Let’s move on to Bitcoin’s analysis. Today, after yesterday’s upward movement, Bitcoin has entered a correction. Let’s see what triggers we have for trading today.
⏳ 4-Hour Timeframe
After yesterday’s bullish move that came following Powell’s speech, I mentioned that since the movement was news-based and also close to the weekend, the probability of a correction was high.
⚡️ That’s exactly what happened. Bitcoin itself did not continue upward today and was rejected from the 116829 resistance level. However, Bitcoin dominance remains in a downtrend, which has allowed some altcoins paired with Bitcoin to continue moving upward.
🔍 If Bitcoin dominance continues to decline while Bitcoin ranges or trends upward, altcoins can provide very good positions and it’s better to focus on them.
🧩 But if dominance begins to correct and forms green candles, we can shift our focus back to Bitcoin and open long positions.
🚀 In this case, the current trigger for a Bitcoin long position is the breakout of 116829. Breaking this trigger could push the price toward 122545.
💥 If the RSI bounces from the 50 level and moves upward, we can take it as momentum confirmation for this position. Additionally, if volume increases while the price approaches the 116829 resistance, we can use a candlestick setup to enter, or place a stop-buy order above the resistance.
❌ Disclaimer ❌
Trading futures is highly risky and dangerous. If you're not an expert, these triggers may not be suitable for you. You should first learn risk and capital management. You can also use the educational content from this channel.
Finally, these triggers reflect my personal opinions on price action, and the market may move completely against this analysis. So, do your own research before opening any position.

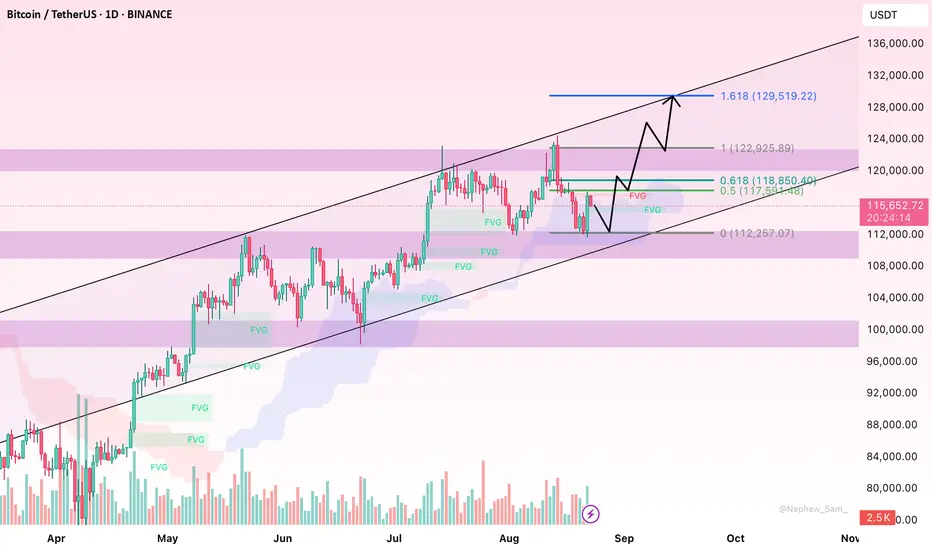
Bitcoin Soars: Buying Opportunity with Strong Uptrend!On the BTCUSDT chart, Bitcoin is trading in an upward channel, with strong support at 111,900 USD. The next target for Bitcoin is 123,400 USD. If BTC holds support at 111,900 USD, the uptrend could continue.
News Impact:
Fed Chairman Jerome Powell hinted at a potential interest rate cut in September, weakening the USD and reducing bond yields, which has led to a flow of money into safe-haven assets like Bitcoin. Additionally, the Trump administration is calling for strong interest rate cuts, which could further weaken the USD and push Bitcoin prices higher.
Conclusion:
With supportive macroeconomic factors and a positive technical trend, Bitcoin could continue to rise strongly in the future. Investors can look for buying opportunities around the 111,900 USD support level and expect the price to reach higher targets like 123,400 USD.

BTC 4H Analysis – Key Triggers Ahead | Day 20💀 Hey , how's it going ? Come over here — Satoshi got something for you !
⏰ We’re analyzing BTC on the 4-hour timeframe timeframe .
👀 On the 4-hour timeframe, Bitcoin is moving inside a 4H range box. The top of this box is at the $122,300 level and the bottom is at the $112,000 level. The midline of the box is around $117,000, and after touching this level the price got rejected downwards .
⚙️ On the RSI, we have two key zones: 30 and 64. When the oscillator crosses these zones, long or short trading volatility increases and the probability of entering overbought or oversold conditions rises .
🕯 On the 4H chart, the size of the buying candles has become noticeably large. After yesterday’s news, the market faced holidays and volume decreased, but with the opening of the new weekly candle, we may see an increase in trading volume. This could bring more volume into long positions .
💵 USDT.D on the 4-hour timeframe has a support at 4.19% and a resistance at 4.35%. Breaking either of these levels could inject significant volume into Bitcoin. Tether selling volume has been relatively strong and faced selling pressure, which could push this drop further .https://www.tradingview.com/x/4bTsKokC
🔔 Our trading alarm zones are placed at $117,000 and $112,000. Price action around these levels, with the start of the new week, can be strong. Selling pressure on Tether and a potential interest rate cut may shift the market sentiment toward long positions .
❤️ Disclaimer : This analysis is purely based on my personal opinion and I only trade if the stated triggers are activated .

Multiple altcoins · The 2025 bull market is onBIOUSDT:
Here we have three weeks closing green and the highest volume ever as Bitcoin retraces. No altcoin can grow this strongly if Bitcoin is now in a bear market. No altcoin would start a bullish wave if Bitcoin is entering correction mode. The only time the altcoins grow is when Bitcoin is rising or sideways within a bull market, at other times the altcoins drop. Seeing bullish altcoins confirms a bullish Bitcoin.
BTCUSDT:
Bitcoin has been red seven days, since 14-August. Is this the start of a major correction or a period of consolidation before higher? Consolidation before higher. The proof are the altcoins.
Here Bitcoin is still trading above EMA89. Last time this level worked as support.
Bitcoin can easily move sideways within a wide range, $100,000 to $120,000, and still support major bullish action across the entire market.
Bitcoin can also consolidate between $110,000 and $120,000. $112,000 is still holding as support. Above this price, Bitcoin is bullish even short-term.
ZECUSDT:
20-August is a higher low vs 7-April and then it goes bullish, a strong breakout with two full green candles. This candles are coupled with high volume, the highest since April.
The move broke EMA89 and EMA55 as resistance. MA200 was also conquered and immediately confirmed as support.
Two strong green days while Bitcoin is moving down. It reveals what is coming for Bitcoin.
HTUSDT:
HuobiToken (HT) goes up more than 280% since 20-August. The same 20-Aug. we just saw with Zcash. Is this the latest higher low date? Let's continue.
SKLUSDT:
Here we have the highest (buy) volume week ever last week as SKLUSDT broke above EMA55. This is happening after a new all-time low. Think about it.
The market bottoms and from the bottom we have the strongest buying ever and this is also coupled with the break of a long-term resistance level. We can easily say Skale Network hit bottom and is ready to grow. While Bitcoin retraces, here we have another very strong bullish breakout, this only happens within a bull market.
Toncoin:
Clearly, a long-term rising trend. TONUSDT is trading above all the short-term moving averages; EMA8/13/21 weekly, the bulls are in.
There are many pairs like this, hundreds literally.
Remember we also saw the big ones: Cardano, Chainlink, XRP, Solana and Ethereum. Look at where Binance Coin is at right now and don't forget Tron, it is all going up.
The smaller projects are yet to catch up, yet to move; the entire market is yet to grow, but here we have proof enough that shows the 2025 bull market is on.
Namaste.

$BTC – Key Level to RegainBitcoin surged rapidly to $117,374 on strong volume, reclaiming the level it previously broke down from — a key level that needs to be regained.
Sentiment stays positive, fueled by Fed rate-cut expectations and steady whale accumulation driving inflows.
Technical Outlook
CRYPTOCAP:BTC | 1h
Local support: 113.8k–113.3k
Local resistance: 117.5k
If 113.3k–112.8k breaks, higher chance we sweep the lows probably into 110k.

Bitcoin Trendline Breakdown: The Pullback Trap Before Further DoBitcoin has officially broken its ascending trendline on the daily chart — a strong technical signal that the bullish momentum is weakening. Yesterday’s sharp pump was nothing more than a classic pullback to retest the broken trendline, and price is now showing signs of rejecting it.
From a price action perspective, this setup often acts as a trap for late buyers, with the market typically retracing the entire pullback move.
🔑 Key Points:
• Daily ascending trendline has been broken.
• Yesterday’s rally = pullback retest of the broken structure.
• Market likely to erase yesterday’s gains and resume downward momentum.
📊 Key Levels to Watch:
• Support 1: $112,000
• Support 2: $108,000
• Invalidation: A daily close back above yesterday’s high (~$117,000).
🎯 Trading Strategy:
• Wait for confirmation on lower timeframes (1H/4H) such as a CHoCH (Change of Character) or BOS (Break of Structure).
• Short entries become favorable if price fails to reclaim $117k.
• Initial targets: $112k → $108k.
• Keep stops above the recent swing high to control risk.
⚡ Summary:
The break + retest of the ascending trendline is a bearish sign. As long as BTC trades below the retest zone, the path of least resistance is down. Traders should stay patient, wait for proper entry signals, and avoid being trapped by the pullback.
⸻

Bitcoin 4H BullishBitcoin tapped into the liquidity at $111,881. There was strong support from the green trendlines, along with a bullish signal from a bullish divergence ✅. This pushed the market significantly higher.
News: Powell also added a positive impulse, helping the 4h candle close above 115k.
👉 As long as we remain within this range, the outlook stays bullish for next week.
👉 A possible re-entry for me is in the yellow box ($114,119), where a high-leverage long position is also placed.
👉 Our weekly close remains the key support for further upward movement.
Wishing you a great weekend! ✌️🚀"

BTCUSDT. Find the differences.Hi traders and investors!
On the left — March 3, 2025.
On the right — August 23, 2025.
Same structure, different time.
👉 What happened after March 3?
Will we see the same outcome now — a pullback all the way to the start of the move — or is the market setting up a different scenario this time?
Wishing you profitable trades!

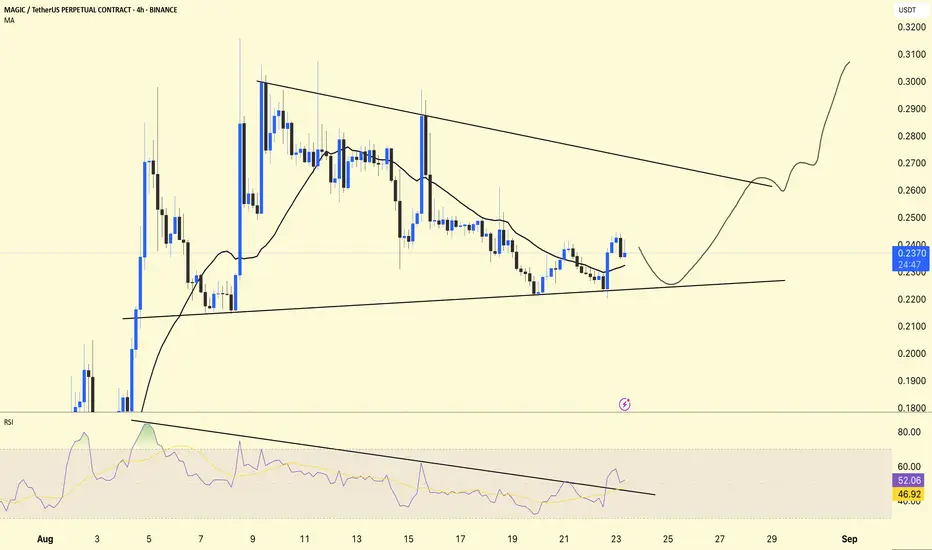
MAGIC/USDT 4H Analysis !!
MAGIC is currently trading at $0.2376, showing a falling wedge structure with RSI breakout confirmation.
📊 Chart Overview:
Falling Wedge Pattern
The price is consolidating between a lower high and a higher low.
If it breaks to the upside, it is a bullish reversal pattern.
Support Area
Strong support (trendline support) near $0.22–0.225.
As long as this level holds, downside looks limited.
RSI Indicator
RSI = 52.64, above its MA (46.96).
RSI broke its downtrend line → early sign of bullish momentum building.
Moving Average (MA 25)
The price is slightly above the moving average (0.2324), which is a sign of short-term correction.
DYOR | NFA
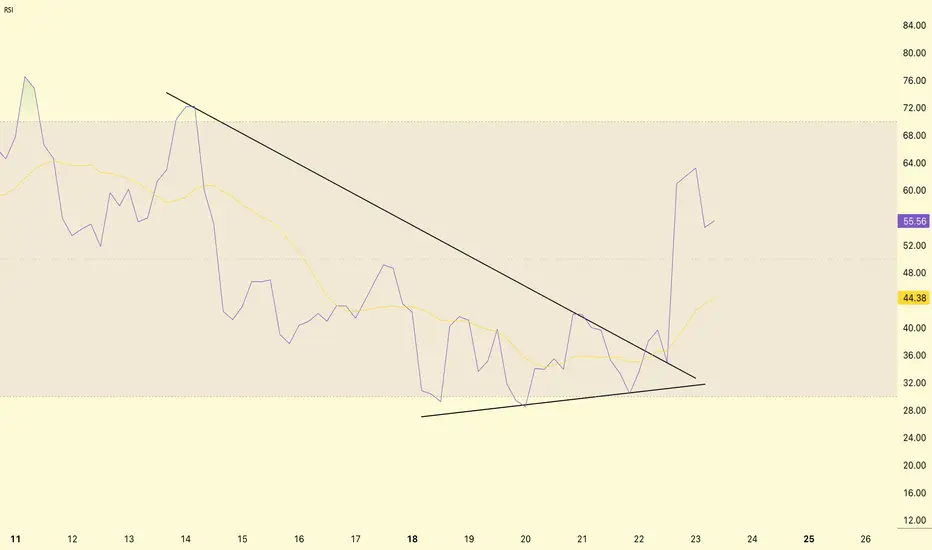
BTC/USDT RSI Analysis !!BTC/USDT RSI Analysis
RSI (Relative Strength Index) breakout analysis.
Descending wedge in RSI
From August 11 to August 22, RSI was forming a descending wedge pattern (lower high, higher low).
This is usually a bullish reversal setup.
RSI breakout
RSI broke out of the bullish wedge on August 22 → rose from ~30 to ~65.
Current RSI = 55.97 → from neutral to bullish territory.
Moving average (yellow line) = 44.41, which means RSI is above the trend, indicating positive momentum.
RSI breakout confirms strong buying interest.
This could mean that BTC has completed its short-term correction phase and is ready for another rise.
DYOR | NFA
112K THE POWER RETURN OR THE END OF CYCLE? - BTC now still GREENBTC is currently at a critical point. From a cycle perspective, we are at the bottom of the cycle—a zone where major whales can decide whether to continue the cycle or bring it to an end.
When BTC just slips below 112K it does not directly end the cycle; it need also provides time frame confirmation of at least 4H+ There is high chance BTC can return from 112k zone.
If BTC holds its levels and rises above 112K with confirmation, we could the strong cycle.
If BTC breaks down further below 12K–10K, it would signal the end of the cycle that started around 84K.
At this moment BTC is still long for the cycle
Momentframe by 112K /110K = END CYCLE
Low time frame BTC = RED
High frame time BTC = RED
Cycle frame time BTC = GREEN

Bitcoin – Medium-Term Outlook for Long/Short TradersBitcoin – Medium-Term Outlook for Long/Short Traders
Hello traders,
BTC continues to respect the descending channel structure. Recently, price bounced strongly from the solid support around 112k, and it is now only about 2k away from the swing long target zone.
If BTC can break above the 114.8k resistance, a short-term reversal could unfold, with potential to extend towards 117.5k before resuming the broader downtrend. This scenario may also act as a trap for those holding longer-term short positions.
The structure is showing early signs of change: price is trading above the descending channel trendline, while MACD indicates rising volume and its moving averages are curving upward. These signals point to a possible corrective rally in the near term.
Strategy: Consider long entries near current levels, with the option to scale in if price breaks 114.8k.
Medium-term short positions from around 115k remain valid, targeting the 110k zone, which could also serve as a new accumulation area.
This is my personal view of the BTC market. Stay disciplined and manage risk accordingly.
What’s your outlook on Bitcoin here? Share your perspective in the comments below.

Bitcoin Bullish & $137,000 in August 2025 —Top Altcoins ChoiceOk, many not August 2025 but the rise starts this same month...
What I am trying to say is that Bitcoin is bullish now and will continue growing immediately. By late August Bitcoin will be green and the entire altcoins market is already turning green. The retrace is what you are seeing now. The retrace is no big deal because there was a jump before the move was deployed.
Bitcoin moved to $125,000 and then dropped. This happens to strengthens support. Notice how $112,000 remains unchallenged. If Bitcoin produced a drop without moving to 125,000 that would be a different story.
Bitcoin is bullish because prices are not trading at $110,000 or lower. The fact that the action is happening above $112,000 confirms a very strong bullish bias on all timeframes and based on all charting systems. The Bitcoin bull!
Simplicity. Above $112,000 we win. Above $100,000 bullish long-term.
Above $110,000 bullish mid-term.
The amount of noise we have so far reveals plenty. Bearish volume was high but not high enough. Ethereum was hit but not strong enough. The smaller altcoins are showing no signs of lower lows. This will be a stop that will only last a few more days.
What about the altcoins? —Top Altcoins Choice
With the market shaking I want to know what is going to happen with my holdings, each trading pair is different. Has the chart been compromised?
Share a comment with your favorite trading pair and I will do an analysis for you.
Your support is highly appreciated.
👉 If you enjoy the content follow.
The bull market is not over.
Bitcoin will continue rising.
The altcoins will continue rising.
We know we are bullish based on hundreds of charts.
The best is yet to come.
Namaste.
