BTCUSDT

BTCUSD rebounds from firm support of 112,000.00BTCUSD rebounds from firm support of 112,000.00
The asset experienced the big decline since the mid-August, falling off the ATH at 124,500.00 towards support level of 112,000.00, which is a 10% correction. Currently now the asset shows bullish divergence on MACD. The price is expected to rise towards 115,000.00 level with a potential final target of 117,000.00.

BTC Warning: Hidden Signals Before October’s Big Move!Right now, I’m leaning a bit bearish on BTC. Why?
I’m spotting a bearish divergence both on the daily and weekly timeframe.
Volume has also been drying up, which makes the move look a bit weak.
And historically… September tends to be shaky before October kicks in with that bullish momentum.
That said, I’ve marked key support zones in case BTC decides to dump before a bounce:
🔴 112,770 (0.236 Fib) – first line of defense
🟠 105,455 (0.382 Fib) – solid support zone
🟢 99,543 (0.5 Fib) – critical level to hold
🔵 93,631 – 92,028 (0.618–0.65 Fib) – last strong demand zone
So if BTC wants to test liquidity, these are the areas I’m watching closely.
👉 What do you guys think? Are you also seeing the same bearish signs, or do you think BTC skips the dump and runs straight into October bullish?
Drop your thoughts below ⬇️ and hit that follow if you’re tracking BTC moves with me. Let’s ride this market together. 💯

BITCOIN IN DANGER Bitcoin has reached to a major resistance area between 120k to 130k, which is the resistance zone since 2021 tops.
This is the second rejection in this cycle. A fake breakout to $130,000 may occur, but the monthly candle could close below this resistance again.

Could Bitcoin continue to be bearish?
Hi my dears
We are at your service with a risk analysis.
The only important thing is that the condition stated on the chart occurs. If the price does not break the orange level you have specified, the trade will not be opened and you should just watch. Wait and keep the condition in mind. If the condition is met, there is a possibility of further decline in the price of Bitcoin.
What do you think, friend? Please share your opinion with us.

Is it time to reform the EURUSD?
Hi dears
It looks like a head and shoulders pattern has formed which could be a sign of an interesting pullback.
I think we should see the dollar strengthen against its peers over the coming week.
What do you think?
If you like my analysis, just follow my page.

Bitcoin (BTCUSDT) – Smart Money Update🔔 Following our previous analysis predicting BTC drop to ~112k, we now update the market scenario using Smart Money & Price Action concepts.
📉 As expected, BTC entered a bearish phase after a Break of Structure (BOS) and distribution phase, currently approaching the key liquidity zone 108k–110k. This zone is a strong area for liquidity grab and institutional buy orders.
📌 Probable Scenario:
• BTC may touch 108k and then perform a corrective move to 113k–114k.
• A breakout above this range (e.g., towards 120k) is not guaranteed and requires reassessment of Price Action at that time.
🔑 Key Points (Smart Money Concepts):
• Liquidity below recent lows is still unfilled.
• The 108k–110k range acts as a higher timeframe Order Block.
• Pullback to 113k–114k could simply be a retracement to the Supply Zone.
📍 Summary:
Short-term: higher probability of BTC drop to 108k, followed by a limited recovery to 113k–114k. Further upside continuation or breakout needs reevaluation at that time.

TradeCityPro | Bitcoin Daily Analysis #159👋 Welcome to TradeCity Pro!
Let’s dive into the Bitcoin analysis. Today, Bitcoin is sitting right on a very important support level. Let’s see what could happen in the market.
⏳ 4-Hour Timeframe
Today, I removed the old range we had on Bitcoin and added a support zone around 112000.
✔️ The reason for removing the old range was that the price had broken through it several times, both from above and below, so it could no longer be considered a Maker Buyer or Maker Seller zone.
🔔 The new zone I drew is a very strong support, and right now the price is fluctuating inside it.
✨ The 114790 trigger is a good entry signal for a long position, confirming that the price has been supported by the Maker Buyer zone. The important resistance levels above are at 116829 and 119096.
💥 If the 112233 level breaks, a sharp bearish leg could occur. But in my view, it is unlikely to happen today. If it does, it will probably come after Powell’s speech tomorrow.
🧩 Breaking the 30 level on RSI is still the momentum trigger for Bitcoin. If it enters the oversold zone, Bitcoin’s momentum will turn bearish, and the RSI could move down toward 24.60.
🔍 For today and tomorrow, I prefer not to open any new positions and wait until Powell’s speech at the Jackson Hole event to see when the market chooses its direction.
❌ Disclaimer ❌
Trading futures is highly risky and dangerous. If you're not an expert, these triggers may not be suitable for you. You should first learn risk and capital management. You can also use the educational content from this channel.
Finally, these triggers reflect my personal opinions on price action, and the market may move completely against this analysis. So, do your own research before opening any position.

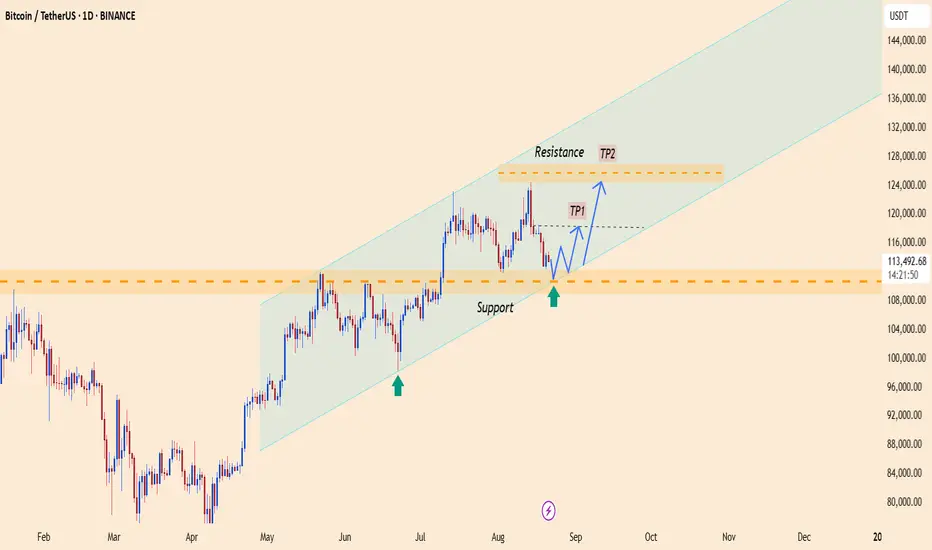
BTC Game PlanBTC Game Plan
📊 Market Sentiment
Overall sentiment remains bullish, supported by expectations of a 0.25% rate cut in the upcoming FOMC meeting. A weakening USD and increasing global risk appetite are creating favorable conditions for further upside in crypto assets.
📈 Technical Analysis
Price is currently retracing lower after printing new all-time highs.
It is moving toward the 112,000$ level, which contains significant liquidity. Therefore, I expect a strong bounce from that zone.
Additionally, price is approaching the equilibrium level (0.5 Fibonacci), which represents a discount for me.
📌 Game Plan
I expect price to retrace to the 111,316$ level and bounce from there.
🎯 Setup Trigger
I will be watching the 4H market structure for confirmation before initiating a position.
📋 Trade Management
Stoploss: 4H swing low confirming the BOS
Targets:
TP1: 118,446$
TP2: 124,351$
💬 Like, follow, and comment if you find this setup valuable!
⚠️ Disclaimer: This content is for informational and educational purposes only and does not constitute financial, investment, or trading advice. Always do your own research before making any financial decisions.

BTC 1H Analysis – Key Triggers Ahead | Day 18💀 Hey , how's it going ? Come over here — Satoshi got something for you !
⏰ We’re analyzing BTC on the 1-hour timeframe timeframe .
👀 On the 1-hour timeframe of Bitcoin, we can see that after hitting the $115,000 zone, it got rejected with a relatively strong red candle and is now moving toward its support at $112,700 .
⚙️ We have two key zones in the RSI : the support zone at 30 , and the resistance zone for long positions at 59.67. Breaking these levels can push Bitcoin toward its alarm zone and sensitive price area for a breakout .
🕯 The size of the red candles is getting smaller , showing reduced selling pressure , while the green reversal candles from $112,700 are closing larger and stronger than before .
💵 USDT.D on the 1-hour timeframe is moving toward its resistance at 4.46% , but the trend is weakening and the size of the buying candles is shrinking . In previous attempts to reach this zone, it faced rejection . If the 4.36% support level is lost , strong inflows could move into Bitcoin .
🔔 Our trading alarm zones are at $115,000 and $112,700 . These zones usually break with increased volume and volatility , and by watching price behavior there , we can find the best trading opportunities .
❤️ Disclaimer : This analysis is purely based on my personal opinion and I only trade if the stated triggers are activated .

BTC at the bottom of GTF range🎯 Key Levels to Watch:
• Above: 114150 / 115700 / 116455
• Below: 112300 / 111850 / 110653
🔥 BTC Liquidation Heatmap:
• Above: 114957 / 116098 / 116953
• Below: 112866 / 112201 / 110061
Liquidity pool under 111850 remains major magnet for the price. Will it be wiped out or not, no one knows for sure, but chances are very high. Especially since stocks took a hit yesterday. So either BTC dips and pumps back up fast, or that can turn into full scale correction down to 109k at least.
Developing quarter VWAP and Daily 20sma now form the strongest resistance on the way from 116010 to 116455 (values are approximate).
⏰ TG alarms set for: 111850, 110432, dev Quarter VWAP/VAH & Day 20-sma

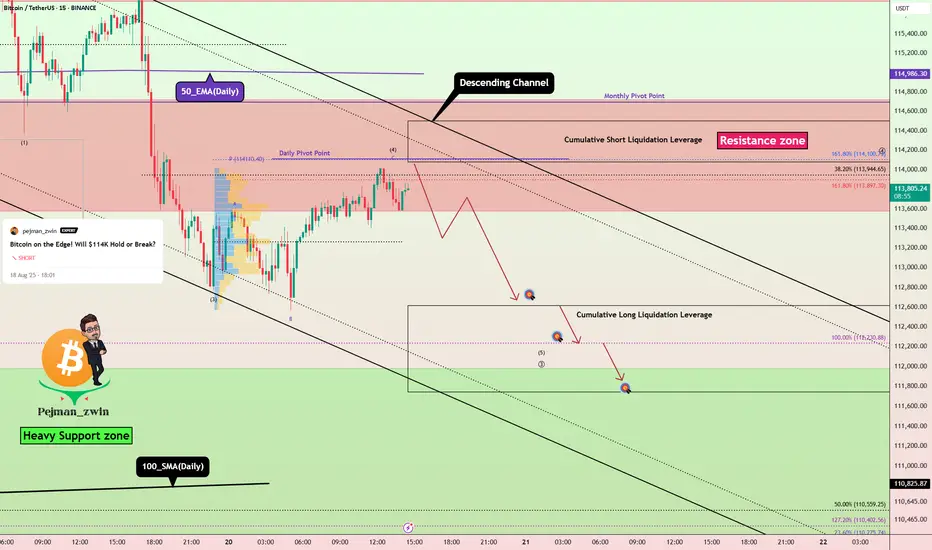
Bitcoin Short Setup _ Short-termBitcoin ( BINANCE:BTCUSDT ) has managed to break the Support zone($114,720-$113,570)/Now=Resistance zone and 50_EMA(Daily) , as I expected in the previous idea . And now it seems that Bitcoin is completing a pullback .
Also, on the 1-hour time frame , if you look closely, Bitcoin seems to be moving inside a descending channel .
In terms of Elliott wave theory , Bitcoin seems to be completing microwave 4 of the main wave 3 , so that microwave 4 could have an Expanding Flat structure(ABC/3-3-5) .
I expect Bitcoin to drop to at least $112,640 after completing the pullback ( microwave 4 of the main wave 3 ).
Second Target: $112,323
Cumulative Short Liquidation Leverage: $116,755-$115,778
Cumulative Short Liquidation Leverage: $114,500-$114,077
Cumulative Long Liquidation Leverage: $112,615-$111,743
Note: From today until Friday, important indexes will be released from the US, which can create excitement in financial markets, especially crypto, and even change the market trend when released.
Note: Most likely, after Bitcoin touches the Heavy Support zone($111,980-$105,820) and 100_SMA(Daily), we should wait for Bitcoin to bounce back (you might be able to look for a long position trigger in that zone).
Note: Stop Loss(SL): $114,823
Please respect each other's ideas and express them politely if you agree or disagree.
Bitcoin Analyze (BTCUSDT), 15-minute time frame.
Be sure to follow the updated ideas.
Do not forget to put a Stop loss for your positions (For every position you want to open).
Please follow your strategy and updates; this is just my Idea, and I will gladly see your ideas in this post.
Please do not forget the ✅' like '✅ button 🙏😊 & Share it with your friends; thanks, and Trade safe.
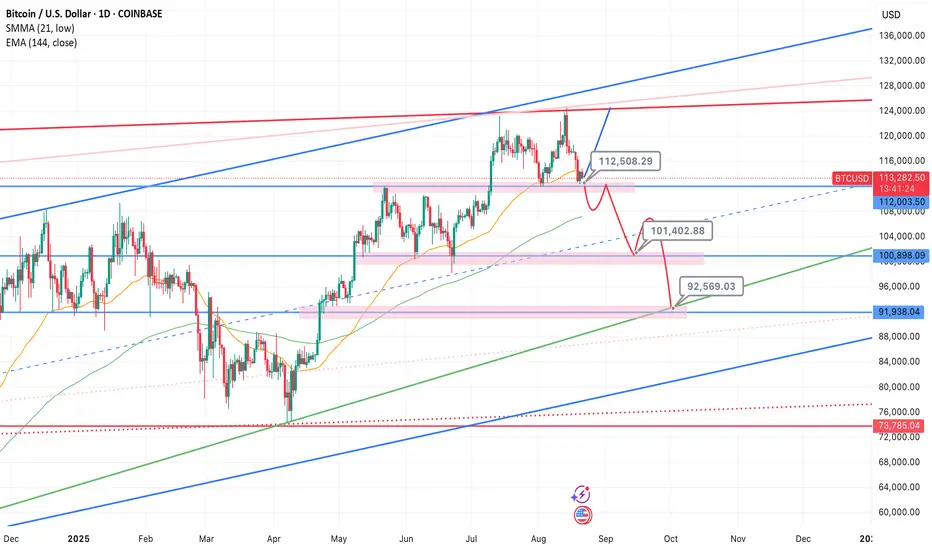
Bitcoin Holds the Line – $112.2K Is Key SupportAccording to on-chain data, BTC’s move to $125K was driven by short liquidations, not new capital inflow, therefore a rejection of highs into further consolidation was expected, after confirming by technical analysis reversal pattern. When rallies aren’t backed by real inflows, the downside tends to be ruthless. After rally printed a new all-time high, then tactical traders triggered a chain of long liquidations.
So the question now is—was this just a flush before a fresh leg up? Or is this market still unwinding?
I remain bullish from current levels. The recent drop looks more like a healthy correction than a trend reversal.
Key Risk:
The bullish scenario breaks if $112,200 support fails and we see a confirmed reversal structure (not just one wick/ short-term candle, but several days of follow-through).
Support Levels to Watch (Buy-the-Dip Zones):
$112,500
$101,400
$92,600
Macro View:
Liquidity signals continue to improve, profit-taking is largely complete, and we don’t see a cycle top yet. Long-term structure remains bullish, and this pullback should be seen as an accumulation opportunity.
Disclaimer:
Markets are subject to unpredictable events and the randomness of markets, please use appropriate risk management. DYOR
BTC Explodes: Heading Towards New Targets!The BTC/USDT chart shows a strong upward trend, with the price currently trading within a stable ascending channel. Bitcoin has rebounded from the support level at 3,314.700 USD and is now heading towards the next target at 3,372 USD. This price structure, with higher highs and higher lows, indicates that the bullish trend is strengthening. If BTC remains above the support level at 3,334 USD, the probability of continuing the upward movement towards 3,372 USD is very high.
News Supporting the Uptrend:
FOMC Minutes: The dovish tone from the FOMC has weakened the USD, which supports BTC's upward trend.
Jobless Claims: Higher-than-expected jobless claims data signals a weaker economy, pushing BTC higher.
PMI Index: Weak PMI figures reinforce the decline of the USD and create favorable conditions for BTC's price increase.
Trading Strategy:
Buy when BTC stays above the current support level, targeting the next level at 3,372 USD. Protect capital with a reasonable stop loss.
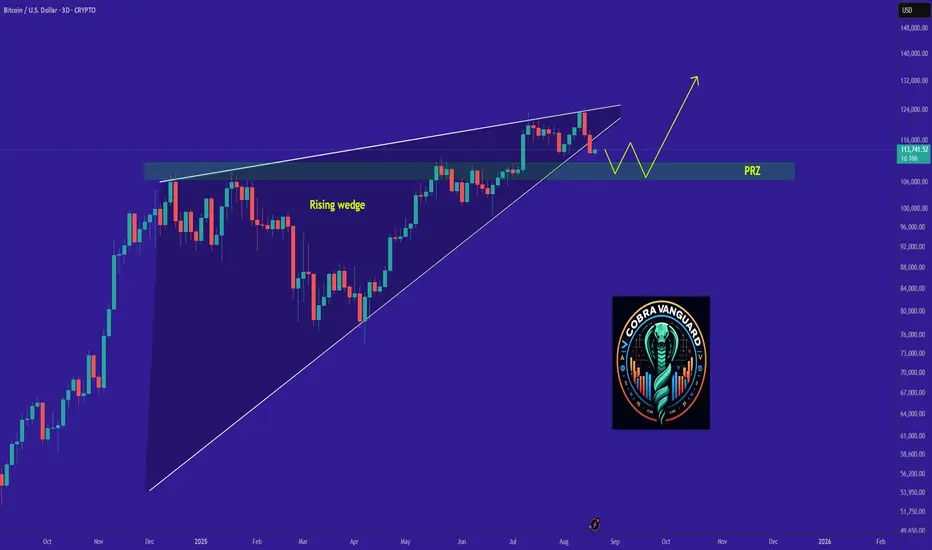
bitcoin's Situation, A Comprehensive Analysis !!!The price has broken the descending wedge and could now drop to 109K. It seems the PRZ (Potential Reversal Zone) is a stable range for Bitcoin.
BITCOIN BTC PRICE ANALYSIS AND NEXT EXPECTED MOVES!!CRYPTOCAP:BTC Update & Next Possible Trade Ideas!!
• Right Now For Short term i am expecting sideway movement in CRYPTOCAP:BTC Price. (Overall No Trade Zone Area)
REASON:
Volume is Low, LTF's Structure look Bullish & HTF's Structure is Bearish... I think we will stuck in a trap🚨
• But after consolidation if price manage to hold 114600$ then we will look for long setup OR It's Price Drop B/w 111500$ to 110000$ zone then we will also look for quick long scalp🫡
• Trade ideas that i marked on a chart are also for quick scalp.
• Let's see how Price react in comming days🫠
Warning : That's just my analysis DYOR Before Taking any action🚨🚨

Shorting BTCUSDT – Strong HTF Bearish Signals in PlayRecent Price Action:
- First Rejection (8/14): Bitcoin was rejected at the previous ATH (~$102.3K).
- Second Rejection: Price failed to surpass the secondary swing high (~$122.4K), leading to a sharp drop (liquidation of buy orders).
- Rebound Attempt: Price dipped to $106.8K, filling the CME gap and likely triggering short-term short liquidations over the weekend. However, the rebound lacked sustainability.
- Breakdown Confirmation: On Monday’s market open, BTC broke below key support, extending the drop to the 0.786 Fib level (~$114.6K).
Market Structure Shift (Higher Timeframe Confirmation):
- The breakdown invalidated the prior bullish structure on H4+ timeframes, confirming a bearish bias.
- The inability to hold above key levels and the liquidation-driven moves suggest weakening demand.
Short Setup Opportunity:
- Ideal Entry Zone: 116.8K - 117K
- SL: ~118k
- TP: ~112k
- Confluence: 0.618 Fib retracement from recent swing high.
Rejection at this zone would further validate bearish continuation.

BTCUSDT (Daily)✅ BTC/USDT — 1D (Spot) | Aug 22, 2025 — Professional Technical Analysis
🔎 Chart Context
• Pair: BTC/USDT
• Timeframe: Daily
• Current price: ~113,983
• The chart shows BTC in a retracement phase after rejecting from the 123,260 high, with projected upside target 131,438.
📊 Key Observations
1. Market Structure
• BTC created a higher high at 123,260 earlier this month.
• The correction is testing key daily demand zones.
• Structure remains bullish on daily timeframe as long as price holds 111,900 – 110,600 block.
2. Support & Demand Zones
• 111,999 – 111,915: Immediate demand zone, currently being tested.
• 110,600 – 110,400: Deeper liquidity shelf, acting as a strong structural support.
• 103,269 – 100,403: Long-term support zone (last defense before bullish invalidation).
3. Resistance & Supply Zones
• 118,000 – 120,000: Minor supply zone from breakdown.
• 123,260: Recent high & liquidity cluster.
• 131,438: Key upside target (marked on chart), representing the next liquidity pool.
4. Liquidity & Fair Value Gaps
• Current retracement is designed to rebalance liquidity gaps left by July’s rally.
• Liquidity sits below 111,900; once swept, a bullish continuation into 131,000+ becomes likely.
📈 Bullish Scenario (Higher Probability)
• BTC holds above 111,900–110,600 demand block.
• Path:
• Accumulation → reclaim 118,000–120,000 → break 123,260 high.
• Target: 131,438 (major liquidity zone).
• This aligns with the chart projection, suggesting a sweep into demand before a new impulse.
📉 Bearish Scenario (Lower Probability)
• BTC fails to hold 111,900–110,600 block.
• Breakdown path:
• Retest from below capped at 115,000–116,000.
• Move toward 103,269–100,400 support.
• A daily close below 100,000 would shift structure bearish and invalidate bullish continuation.
⚡ Trading Plan
Long Setup (Preferred with trend):
• Entry: 111,900–110,600 demand zone.
• TP1: 118,000
• TP2: 123,260
• TP3: 131,438
• Stop: Below 110,000
Short Setup (Countertrend, Risky):
• Entry: Failure bounce into 118,000–120,000.
• TP: 111,900 → 103,000
• Stop: Above 123,500
✅ Conclusion
BTC/USDT Daily remains structurally bullish, with the current pullback retesting 111,900–110,600 demand. As long as this zone holds, the probability favors continuation toward 131,438 after reclaiming 123,260. A breakdown below 110,000 would signal deeper correction into 103,000–100,000.

Wait for confirmation and execute SELL BTCUSD signal✏️BTCUSD is trading in a narrow range of 117000 and 114500. It is quite difficult to have a trading strategy in this range. The best is to wait for the sellers to be strong enough to break 114500 to find SELL signals to a stronger support zone. Or wait for the buyers to react around the upper resistance zone of 117000. Because this is a breakout zone in the past with retests.
📉 Key Levels
SELL Rejection 117000
SELL DCA Trigger Break of Support Zone 114500
Target 110000
Leave your comments on the idea. I am happy to read your views.
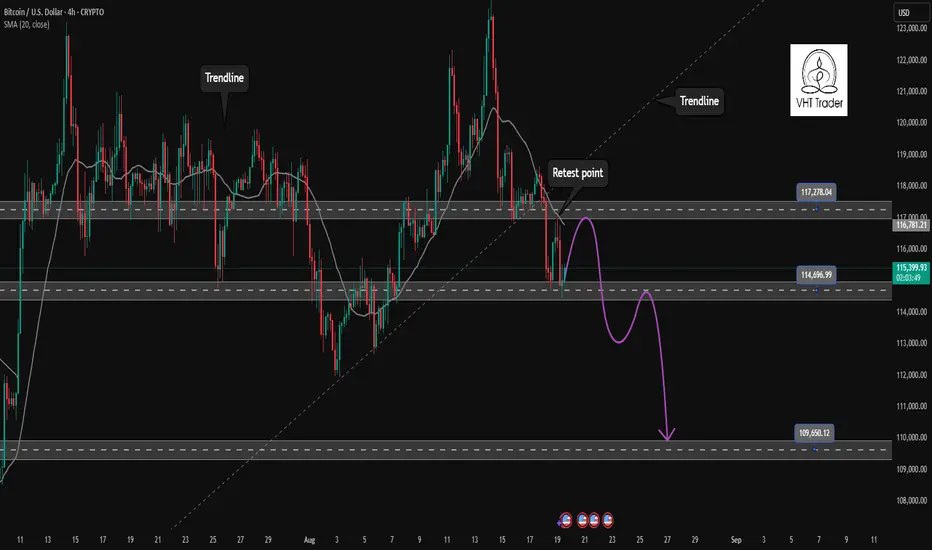
Bitcoin – Still Tracking the Bearish ChannelBitcoin – Still Tracking the Bearish Channel
Bitcoin continues to respect the bearish outlook, with price retesting the 115,000 zone before extending lower. The descending channel remains firmly in play, and the next key target sits around the 110,000 level.
To reach this objective, BTC may establish another leg down within the Dow structure, moving in line with the descending trendline. However, traders should remain cautious: MACD is showing increasing volume and its moving averages are beginning to turn upward — early signs that could challenge the short-side momentum.
In trading, the dominant trend should always take priority. Counter-trend opportunities are best reserved for clear liquidity zones or when market psychology shifts at critical levels. Otherwise, trading with the prevailing direction offers more consistency and less risk.
For now, BTC’s strategy remains focused on the descending channel. Scalping opportunities may appear around 112,600 and 111,800 as price reacts to the trendlines. The medium-term short entered near 115,000 remains valid, with a target towards 110,000. This area will also serve as a potential accumulation zone, where traders can reassess whether to build long-term positions.
This is my current outlook for BTC. Stay patient, trade with structure, and let the market confirm your entries.
#BTCUSD #Bitcoin #CryptoAnalysis #TechnicalAnalysis #PriceAction #Trendline #DowTheory #MACD #CryptoTrading #SwingTrading

TradeCityPro | Bitcoin Daily Analysis #158👋 Welcome to TradeCity Pro!
Let’s get into Bitcoin analysis. Yesterday, Bitcoin’s decline continued, and now, after finding support at its key support zone, it is showing an attractive entry point for opening a position.
⏳ 4-Hour Timeframe
Yesterday, Bitcoin made another bearish leg and dropped close to the 112233 zone.
✔️ The recently closed 4-hour candle shows market indecision since it came with high volume and left large wicks on both sides, signaling a battle between buyers and sellers.
💥 The RSI oscillator still hasn’t dropped below the 30 zone and was supported there. Breaking this level would trigger another bearish leg toward 110000.
📊 If 112233 breaks, we can open a short position. It’s not a bad trigger, and the break of this zone would be the first sign of a trend change.
⚡️ However, I personally am still waiting for confirmation of the main trend and won’t open any position yet. For shorts, I think it’s still too early, and for longs, the structure hasn’t formed properly.
🔍 If today Bitcoin makes a bullish leg and climbs above 114790, then tomorrow we can consider opening a long position. But for now, no suitable trigger has been formed yet.
❌ Disclaimer ❌
Trading futures is highly risky and dangerous. If you're not an expert, these triggers may not be suitable for you. You should first learn risk and capital management. You can also use the educational content from this channel.
Finally, these triggers reflect my personal opinions on price action, and the market may move completely against this analysis. So, do your own research before opening any position.

BTCUSD set to rise $124482?BTCUSD trade setup for today :
Before we look at potential entry in this pair first let’s look at multiple timeframe analysis in this market.
Monthly: 124482 Monthly resistance price has got rejection strongly from the top
Weekly: Price has just got just broken out of the support
Daily: Price on the daily significant support level
Entry timeframe 4H : Price has printed 4h has got rejected strongly from the daily support level.
Possible trade recommendation : Bullish trade with high probability set up

Bitcoin Goes Bullish · Altcoins Market Resumes GrowingBitcoin and the altcoins market is about to perform one of those surprise moves that it really loves, a huge major advance; we are going up.
How are you feeling in this wonderful new week my friend?
I am happy to have your attention. Please, continue reading below and let me know in the comments what you think about this analysis.
The markets are open, people are trading, buying and selling while prices are rising. Bitcoin is no longer going down and the retrace was very small. The total drop so far amounts to less than 10%, but it is wise to consider that the current range is not $110,000 to $120,000 but $100,000 to $120,000. It is a wide range.
The new all-time high is not a major new level but instead a double-top compared to mid-July. Seeing how a double-top made no impression on the bears, seeing how the market continues super strong, we can easily predict that the bull market is not over and Bitcoin will continue to grow. What about Litecoin?
Chainlink is no longer trading at bottom prices but it has plenty of room available for growth. It is not at the bottom but certainly not a new all-time high either. The same for Cardano. Will it stop growing and enter a bear market when it was already doing so great? No, it will continue growing long-term.
Hedera also grew nicely and a small portion of the market is in the same boat. The bigger part though is still trading near support but not for long. August is the last chance to get those still behind while prices are still low. The fact that many projects are ahead, high up, confirms where the market is headed.
If you think a few years back, everything was down including Bitcoin.
If you think last year, everything was down but Bitcoin.
If you see how the market is doing now, many projects are very strong and growing. This reveals what is coming to the rest of the market.
First one, then two, then six, then twenty and then everything grows.
Bitcoin is about to make a surprise move... The entire market is set to grow.
Namaste.
