bitcoin Analysis (Update)As I mentioned earlier, the price has reached the bottom of the channel and completed the final bearish wave. I'm hopeful that Bitcoin will respect the technical setup and begin a bullish wave from here.
!!! However, Bitcoin might surprise everyone and break the channel structure.so we need to wait for confirmation, which I believe will become clear by next week .
Follow us for upcoming updates and market insights.
PREVIOUS ANALYSIS
BTCUSDT

BTCUSD 4H Bullish setup Bitcoin (BTCUSD) is showing early signs of a potential recovery after defending key support around the 107K zone. The 4-hour chart suggests a possible bullish reversal setup, with price stabilizing near the lower band and momentum indicators hinting at renewed buying interest.
Bullish Influences
Support Rebound: Price respected the 107K area — a previous structure low — showing buyers stepping in.
EMA Ribbon Compression: The EMAs are tightening, signaling a possible momentum shift and upcoming breakout.
Higher Low Potential: If price holds above 107K, it may establish a higher low, confirming a reversal pattern toward mid-band resistance.
🎯 Fibonacci Bullish Targets
Using the swing low (~107K) to swing high (~111.9K):
Target 1 (0.382 Fib) → $108,900 – $109,000
First resistance and short-term breakout confirmation zone.
Target 2 (0.618 Fib) → $110,100 – $110,200
Key confluence level near EMA resistance; potential pause or consolidation point.
Target 3 (1.000 Fib Extension) → $111,900 – $112,000
Full bullish extension target aligning with prior high and upper volatility band.
⚠️ Invalidation
A close below $107,000 would negate the bullish structure and could trigger renewed selling pressure toward $105,500.

BTCUSDT Chart Analysis (2H).BTCUSDT Chart Analysis (2H).
Breakout: BTC has broken its descending trendline and reclaimed the $110,000 resistance area. Bulls are pushing the price towards the upper side of the supply zone marked around $112,000.
Setup: If BTC maintains a price above $110,000, the chart forecasts further upside, with the next resistance level at $115,000-$117,000.
Caution: Support is at $108,000-$110,000; losing this level could risk a retracement to $106,000-$104,000.
DYOR | NFA

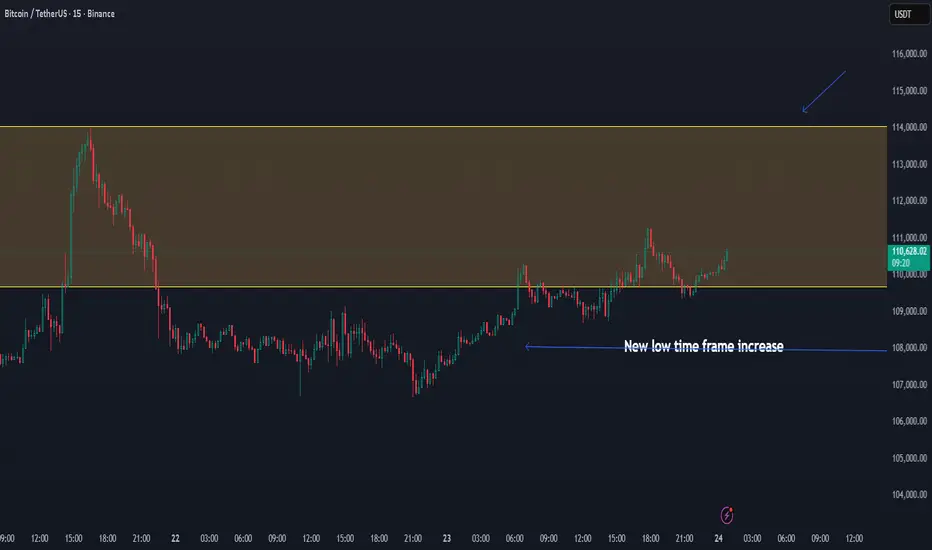
BTC/USDT — Positive Momentum Building, Eyeing Breakout To $114KBTC/USDT — Positive Momentum Building, Eyeing Breakout Toward $114K 🚀
Bitcoin continues to trade with strength after forming a new low-timeframe increase above the $108K level. This structural recovery confirms short-term bullish momentum, suggesting that BTC may now be ready to retest the upper range near $114K.
The consolidation inside this $108K–$114K range has created a stable base of support, while rising volume and sustained higher lows signal a potential expansion phase.
📊 Technical Overview:
Support: $108K
Range Resistance: $114K
Upside Target: $114K+
Bias: Positive / Bullish on short-term timeframe
If BTC maintains this momentum and confirms above $110K, the probability of a move toward $114K becomes increasingly strong — marking a continuation of the low-timeframe uptrend.
📈 Outlook: Positive momentum confirmed
🎯 Targets: $110K → $114K
See if it can rise above 110644.40-111696.21
Hello, fellow traders!
Please "Follow" to always get the latest information quickly.
Have a great day.
-------------------------------------
(BTCUSDT 1W Chart)
Support levels for maintaining an uptrend are:
1st: 104463.99-108353.0
2nd: 87814.27-93570.28
Support must be found within the first and second levels above.
To rise above the right Fibonacci ratio of 2.618 (133889.92), which is my target level, the price must rise above the uptrend line (1) and maintain its position.
In other words, the price must rise above the HA-High indicator level of 116259.91 on the 1W chart and maintain its position.
-
(1D Chart)
The key is whether the price can find support near 10443.99-108353.0 and rise above the 110644.40-111696.21 range.
If the price fails to rise, it is highly likely to fall further, so we need to consider countermeasures.
Since the M-Signal indicator on the 1W and 1D charts is passing near the 110644.40-111696.21 range, I believe the trend will likely be determined by the presence of support.
The HA-High ~ DOM(60) range on the 1W chart is formed within the 116,259.91-119,086.64 range, while the HA-High ~ DOM(60) range on the 1D chart is formed within the 120,760.81-124,658.54 range.
Therefore, the 116,259.91-124,658.54 range is likely to act as resistance.
Therefore, I believe a surge in capital is needed to break above this range.
-
Therefore, I believe BTC dominance should rise while USDT dominance should decline.
If BTC dominance rises, most altcoins are likely to move sideways or decline, so altcoin trading requires a strategy to counter this.
BTC dominance is likely to rise to around 61.73,
USDT dominance is expected to fall below 4.55 and break above the resistance level.
-
If both BTC and USDT dominance decline simultaneously, an altcoin bull market could begin.
However, BTC dominance must decline below 55.01, and USDT dominance must also decline below 4.91.
The next period of volatility is expected to occur around October 25th (October 24th-26th).
-
Thank you for reading.
We wish you successful trading.
--------------------------------------------------
- This is an explanation of the big picture.
(3-year bull market, 1-year bear market pattern)
I will explain in more detail when the bear market begins.
------------------------------------------------------

$GOLD at Top, $BTC at Bottom.Gold has received rejection at the top band of the rising wedge formation and the 0.618 Fib channel, making the top signal clear.
Bitcoin, on the other hand, is at the opposite end of the same structure, at the bottom band...
At the next stage, Bitcoin should move towards the 0.618 fib channel and the upper band of the rising wedge

BTC: Correct prediction today👏Our prediction for Bitcoin's short-term fluctuation characteristics has also been accurately validated today.
✔We indicated that it would fluctuate around the key range in the short term, and in reality, Bitcoin has shown obvious wide-ranging fluctuations today, which is in complete alignment with the preset oscillation pattern.
✔Meanwhile, the market's competition for key levels has also confirmed our judgment:after testing the high level, the price gradually pulled back and then rebounded, highlighting the suppressing effect of the upper resistance. Moreover, the "V-shaped" rebound trend during the session has further verified the effectiveness of the short-term support range, which is highly consistent with our core prediction logic that Bitcoin is in a "shock adjustment phase, with price movements dominated by key levels".

TradeCityPro | Bitcoin Daily Analysis #204👋 Welcome to TradeCity Pro!
Let’s go over today’s Bitcoin analysis, Bitcoin is still ranging, so let’s take a close look at the market together.
⏳ 1-Hour Timeframe
Yesterday, Bitcoin had a short position trigger at the 107,486 zone, which was activated.
🔔 The break of this level created a short-term bearish move, and if you had opened a position on Bitcoin, you probably hit your stop-loss by now.
✨ However, considering the dominance charts, short positions on altcoins made more sense — and if you had opened them, they likely hit their targets.
✔️ Currently, after the fake-out of this zone and the breakout above 108,943, price has made a bullish move up to the next resistance area at 110,213.
💥 Now, price has returned again to the 108,943 level. Volume has decreased along this move, and overall, this drop in volume shows that the market isn’t in a great condition — so the best move for now is to stay without a position.
📊 For short-term trades, if price breaks 110,213, we can open a continuation long position.
💡 For short positions, the current trigger is still 107,486, but since this level has already been faked once, we should wait for another reaction to it — and only open a position if it breaks again on the next attempt.
❌ Disclaimer ❌
Trading futures is highly risky and dangerous. If you're not an expert, these triggers may not be suitable for you. You should first learn risk and capital management. You can also use the educational content from this channel.
Finally, these triggers reflect my personal opinions on price action, and the market may move completely against this analysis. So, do your own research before opening any position.


Bitcoin: Strong Downtrend – Don’t Miss the Sell Chance!Hello traders,
Although Bitcoin showed a slight recovery on Wednesday, the crypto market is still struggling after the sharp decline in early October. Selling pressure remains strong, as the market hovers near recent lows with no clear signs of recovery.
With uncertainty surrounding the U.S. economy and ongoing trade tensions with China, investors are avoiding risk – further weighing on risky assets like Bitcoin. In addition, the drop in gold prices hasn’t provided enough buying momentum for the crypto market to rebound.
The BTC/USDT chart clearly shows a strong downtrend with a steep descending trendline, and resistance around $112,000 has already been pushed back. The price is expected to continue falling, with the next support area around $102,000.
A great opportunity to sell Bitcoin and take advantage of this downtrend!

BTC 4H Analysis | Day 8🥳 Hey everyone! Hope you’re doing great! Welcome to SatoshiFrame channel.
✨ Today we’re diving into the 1-Hour Bitcoin analysis. Stay tuned and follow along!
👀 On Bitcoin’s 4-hour time frame, as shown in the chart, we can see that after a series of declines, Bitcoin has consolidated inside a large 4H range (box). This box has been classified by traders and is currently being “priced in” for the market’s next move. For now, price is still some distance from the top of the box, but the mid-range area, where price is currently hovering, could be a good zone for a potential long setup.
⛏ Multi time frame levels (1H and 15M) have already triggered signals for traders, and price is now moving toward $111,144. A breakout above this level could confirm a long entry. However, breaking this resistance may be challenging and could have a lower win rate, so we’ll use a more conservative risk approach for this move.
🧮 Looking at the RSI oscillator, it’s forming a short-term oscillating resistance near the overbought zone. The 65 level aligns beautifully with the $111,144 price resistance, meaning if RSI breaks above this threshold, that resistance could be taken out, allowing momentum to push further into the overbought region.
🕯 Bitcoin’s volume over the past few days has been strong enough to support powerful moves, but the activity has been mostly indecisive, aimed at liquidity collection within the range. If you pay close attention, you’ll notice extremely precise triggers forming at the box’s highs and lows. In short, large amounts of capital that are expected to exit gold are still in a phase of indecision, and Bitcoin hasn’t yet absorbed that risk capital.
🧠 I’m considering two main scenarios for Bitcoin’s position:
🟢 Scenario 1
Breakout above the $111,144 resistance, accompanied by RSI crossing above 65 and a noticeable increase in buy volume, signaling intent for a Bitcoin pump.
🟢 Scenario 2
Set a buy stop with a larger stop size, staying positioned for a gradual breakout. As Bitcoin breaks higher levels, we can scale in with additional volume.
❤️ Disclaimer : This analysis is purely based on my personal opinion and I only trade if the stated triggers are activated .

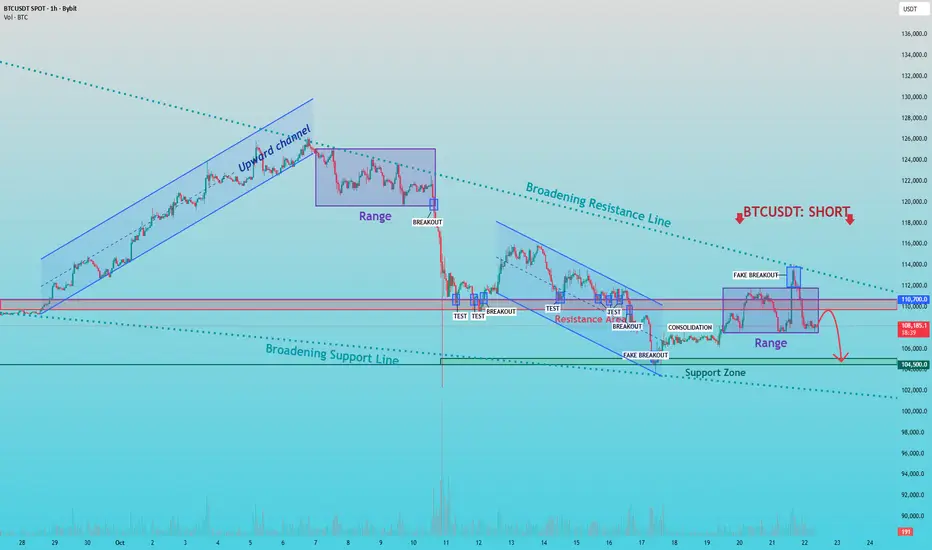
BTCUSDT — Bearish Structure Intact, Watching for BreakdownHello everyone, here is my breakdown of the current Bitcoin setup.
Market Analysis
From a broader perspective, BTCUSDT has been trading inside a broadening formation, marked by expanding highs and lows — a typical sign of increasing volatility and market uncertainty. After a strong upward move within an ascending channel, the structure broke down, shifting the market momentum from bullish to bearish.
Following the breakdown, price entered a period of range-bound consolidation and multiple tests of resistance, each confirming that sellers remain in control. The most recent fake breakout above the 114,000 zone served as a strong rejection signal — a clear sign that buying momentum is fading and that the market could be preparing for another leg down.
My Scenario & Strategy
My scenario is based on the idea that the current movement is a corrective rebound within a larger bearish structure. As the price approaches the resistance area around 110,700, I expect selling pressure to increase once again. The plan is to watch how the price reacts around this resistance zone. A confirmed rejection or failure to break above this level would validate the short scenario, potentially leading to a continuation move toward the 104,500 support zone, which aligns with the lower boundary of the broadening formation.
That's the setup I'm tracking. Thank you for your attention, and always manage your risk.
BTC:Oscillating upward📈The BTC price shows an oscillating upward trend, with the low points gradually rising. However, trading volume has slowed down, indicating a strong wait-and-see sentiment in the market.
📝On the daily chart, after a sharp decline on the 22nd, the rebound momentum on the 23rd was weak, and the market is still in a consolidation phase overall. It is necessary to pay attention to whether it can break through the key moving averages.
💡From the perspective of moving averages, the value of MA10 is greater than that of MA30, indicating a certain upward tendency in the short-term trend.
🎉The intraday support range for BTC is around 105,500–106,000, and the intraday resistance range remains around 111,000–111,500.
💎Trading Strategy:
Buy 107,500 - 108,000
SL 106,500
TP 109,000 - 110,500 - 111,000
Sell 110,000 - 110,500
SL 111,000
TP 109,500 - 108,500 - 107,500
Daily-updated accurate signals are at your disposal. If you run into any problems while trading, these signals serve as a reliable reference—don’t hesitate to use them! I truly hope they bring you significant assistance

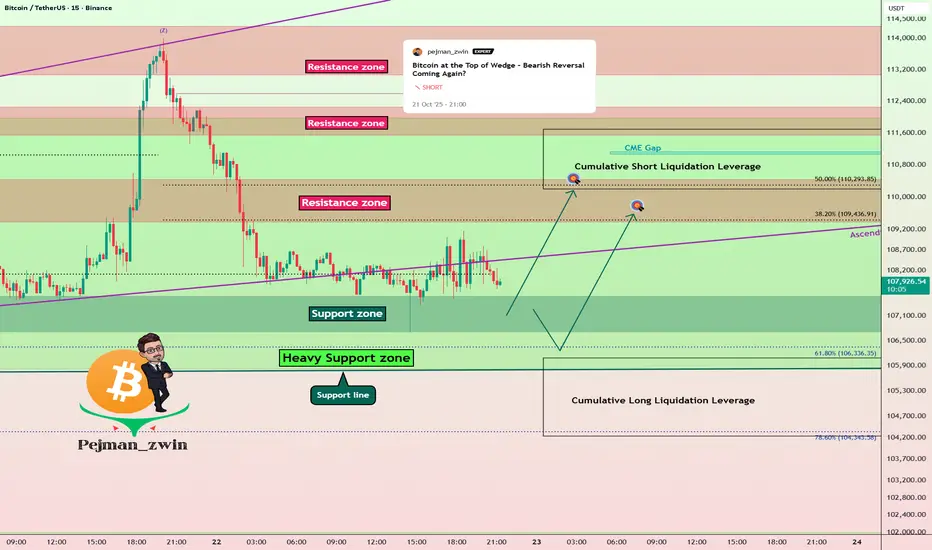
Bitcoin Short Term Setup – One More Push Before Fall?As I expected in yesterday’s idea , Bitcoin( BINANCE:BTCUSDT ) dropped down into the lower ranges of the Heavy Support zone($111,980-$105,820) .
Today, I want to share a quick 15-minute timeframe analysis with you.
Currently, Bitcoin is moving near that Support zone($107,580-$106,700) , but it hasn’t managed to break the lower line of the ascending broadening wedge pattern with strong momentum .
So I expect Bitcoin might at least make another move up to the Resistance zone($110,430-$109,380) . If BTC finds a Short Trigger near the Resistance zone and Cumulative Short Liquidation Leverage($111,687-$110,198) , it could drop sharply afterward, potentially breaking the Heavy Support zone eventually.
Cumulative Long Liquidation Leverage: $106,090-$104,234
Stop Loss(SL): $104,077
Please respect each other's ideas and express them politely if you agree or disagree.
Bitcoin Analysis (BTCUSDT), 15-minute time frame.
Be sure to follow the updated ideas.
Do not forget to put a Stop loss for your positions (For every position you want to open).
Please follow your strategy and updates; this is just my Idea, and I will gladly see your ideas in this post.
Please do not forget the ✅' like '✅ button 🙏😊 & Share it with your friends; thanks, and Trade safe.
Stop!Loss|Market View: BTCUSD🙌 Stop!Loss team welcomes you❗️
In this post, we're going to talk about the near-term outlook for the BTCUSD ☝️
Potential trade setup:
🔔Entry level: 107751.78
💰TP: 96726.16
⛔️SL: 114171.76
"Market View" - a brief analysis of trading instruments, covering the most important aspects of the FOREX market.
👇 In the comments 👇 you can type the trading instrument you'd like to analyze, and we'll talk about it in our next posts.
💬 Description: The main scenario for sell via a breakout of the lower border of the global accumulation of 110,000 - 122,000 remains. The price has already tested the lower border 4 times, indicating clear seller initiative. Following a downward breakout, the price is expected to approach at least the 100,000. A target near 90,000 is also looked for.
Thanks for your support 🚀
Profits for all ✅
❗️ Updates on this idea can be found below 👇

Today's Bitcoin trading strategy, I hope it will be helpful to y The emerging favorable factors (leaving room for long - positions) are as follows:
Capital is starting to : Previously, Bitcoin ETFs saw an outflow of $1.23 billion in a single week, but on October 21st, there was a net inflow of $477 million, and none of the twelve ETFs had an outflow. In particular, large - institution ETFs like BlackRock saw an inflow of $211 million in a single day. This indicates that some of the funds that fled in panic before are now coming back to bottom - fish.
The Federal Reserve may cut interest rates: Federal Reserve Chairman Powell recently signaled in his speech that "more attention should be paid to employment and less worry about inflation", and the market expects a possible interest - rate cut at the end of October. Once the interest rates are cut, the interest on US - dollar deposits will decrease, and the money originally lying in banks may flow into assets like Bitcoin, which is equivalent to "injecting liquidity" into the market.
Regulatory relaxation in some regions: Singapore has postponed the new regulations on crypto - assets originally scheduled for 2026 to 2027, giving the market more time to adapt and also making local institutional funds more confident to participate. This regional regulatory relaxation can, to a certain extent, offset the regulatory pressure in other places.
Today's Bitcoin Trading Strategy
BTC @ buy:107000-108000
pt:109000-110000
sl:105000

BTC/USDT Short-Term 4H Review Chart🧩 Market Structure
After a strong decline, the price has rebounded, creating a local uptrend (marked with the orange trend line).
The price has currently broken through the uptrend from below, which is the first sign of bullish weakening.
The current candle is testing this line from below—a classic trendline retracement (potential pullback).
📉 Support and Resistance Levels
From the chart:
Resistance (green lines):
113.868 USDT — key high.
111.240 USDT — strong resistance (previous local high).
109.133 USDT — currently being tested from below (confluence with the trendline).
Support (red lines):
107.524 USDT — first support.
105.253 USDT — lower support, a boundary for maintaining the higher low structure.
103,582 USDT — key support, below which the upward structure will be negated.
🔍 Volume
Increasing volume is visible on the red candles — selling dominated the trend breakout.
The last green candle has a large lower wick and slightly higher volume — a signal of a possible defensive reaction from the bulls, but without confirmation of continuation.
📊 Stochastic RSI (oscillator)
Located in the oversold zone (around 20).
The %K line is starting to curve slightly upward — it could signal a short-term rebound, but until there's a crossover and confirmation, this is only an early signal.
📈 Scenarios
✅ Bullish:
If BTC rebounds and closes the candle above 109,100 USDT, it will be a false breakout of the trend and a possible upward move towards 111,200–113,800 USDT.
Support to be maintained: 107,500 USDT.
❌ Bearish:
If the price remains below the trendline and 109,000 USDT, and then breaks above 107,500 USDT, the path opens to:
105,200 USDT, and then
103,500 USDT (strong support and potential buy zone).
⚙️ Summary
Short-term trend: neutral → slightly downward (after the trendline breakout).
Key level to watch: 109,100 USDT (retest trendline).
Potential support: 107,500 → 105,200 → 103,500.
Momentum (Stoch RSI): A bullish rebound is possible, but confirmation is lacking.

Bitcoin at the Top of Wedge – Bearish Reversal Coming Again?As I expected in yesterday’s idea , Bitcoin dropped to the $107,800 level, hitting its target .
In the last few hours, BTC started to pump again and is now trading near a cluster of resistances : the 100_SMA(Daily) , the 50_SMA(Daily) , and Cumulative Short Liquidation($117,517-$116,020) . This creates a strong resistance , and I don’t think Bitcoin will easily break through it. ( As of the time of writing, there’s no fresh news influencing the market .)
From an Elliott Wave perspective, it looks like Bitcoin is forming a Triple Three Correction(WXYXZ ).
On the Classical Technical side, Bitcoin is at the top of an ascending broadening wedge pattern , which is a reversal pattern . There’s also a Regular Bearish Divergence (RD-) between the two peaks in this pattern.
I expect that in the coming hours, Bitcoin will start to drop again. After breaking the important $111,000 level , it could fall at least to the lower line of the ascending broadening wedge .
Note: In these past few days, the Bitcoin and crypto market have been quite volatile and driven by news, especially related to US-China tensions. So always manage your risk carefully and avoid impulsive decisions based on sudden headlines.
New CME Gap: $107,690-$107,220
Cumulative Long Liquidation: $107,105-$104,297
Cumulative Short Liquidation: $115,241-$113,454
Stop Loss(SL): $116,200
Please respect each other's ideas and express them politely if you agree or disagree.
Bitcoin Analysis (BTCUSDT), 1-hour time frame.
Be sure to follow the updated ideas.
Do not forget to put a Stop loss for your positions (For every position you want to open).
Please follow your strategy and updates; this is just my Idea, and I will gladly see your ideas in this post.
Please do not forget the ✅' like '✅ button 🙏😊 & Share it with your friends; thanks, and Trade safe.

TradeCityPro | Bitcoin Daily Analysis #203👋 Welcome to TradeCity Pro!
Let’s get into today’s Bitcoin analysis. The market is really uncertain right now and is showing a lot of random, irrational volatility. It’s very important to stay closely updated in these kinds of situations — so let’s dive into the chart.
⏳ 1-Hour Timeframe
Yesterday, Bitcoin made an upward move and managed to reach the 113,429 zone.
⭐ However, after this move, the price faced a strong rejection from that level, completely retraced the entire upward move, and is now back around the 107,486 support zone.
✔️ We can say that this move was a Dead Cat Bounce (DCB) because heavy bearish momentum has now entered the market, and Bitcoin is currently fluctuating around 107,486.
✨ A break of this level will give us the main confirmation of a bearish continuation, and the next bearish leg of Bitcoin could begin.
🧩 For now, it’s better not to rely on momentum oscillators like RSI, since the market lacks clear momentum. However, the volume shows that buyers have been trying to defend the 107,486 support — but as long as the price stays below 113,429, those efforts won’t have much impact.
💥 I’ll open a short position if 107,486 breaks. The next zones that the price might react to are 106,319 and 104,488.
🔔 For long positions, there’s currently no valid trigger — we’ll need to wait until a proper structure forms.
❌ Disclaimer ❌
Trading futures is highly risky and dangerous. If you're not an expert, these triggers may not be suitable for you. You should first learn risk and capital management. You can also use the educational content from this channel.
Finally, these triggers reflect my personal opinions on price action, and the market may move completely against this analysis. So, do your own research before opening any position.

Bitcoin Update - Stay range bound or breakdown
In this video I briefly recap on the expected swing failure at the lows and how we stayed rangebound since .
Although now we are back at the range lows I look at what might be ahead of us, do we break down this time or hold and push back inside .

BTC 1H Analysis | Day 7🥳 Hey everyone! Hope you’re doing great! Welcome to SatoshiFrame channel.
✨ Today we’re diving into the 1-Hour Bitcoin analysis. Stay tuned and follow along!
👀 On the one-hour timeframe of Bitcoin, we can see that after last night’s pump, Bitcoin failed to break through the resistance zone at $113,400 and was rejected downward from this area. It’s currently sitting at its support floor around $107,537, and losing this level could lead to a further decline.
🧮 The RSI oscillator has now formed two important zones — 50 and 38 — and when the fluctuation limit crosses these zones, Bitcoin may start its next move with increased volatility.
🕯 Last night, Bitcoin had good buying volume while approaching its resistance, but the key point was that it was then pushed down sharply by heavy selling pressure, losing even its multi–timeframe support floors. Keep in mind that Bitcoin needs an increase in buying or selling volume to break through these identified levels.
🧠 I’ve explained the upcoming Bitcoin scenarios in the following paragraph.
🟢 Long Position Scenario: A breakout of the nearest resistance zone at $109,383, along with the RSI crossing above the 50 level and buying pressure strong enough to absorb all the sell orders in this area.
🔴 Short Position Scenario: The current level Bitcoin is sitting at is a very critical support. Losing this support at $107,537, combined with the RSI dropping below 38 and increased selling pressure, could trigger a continued downward move, pushing Bitcoin toward its lower support zones.
❤️ Disclaimer : This analysis is purely based on my personal opinion and I only trade if the stated triggers are activated .

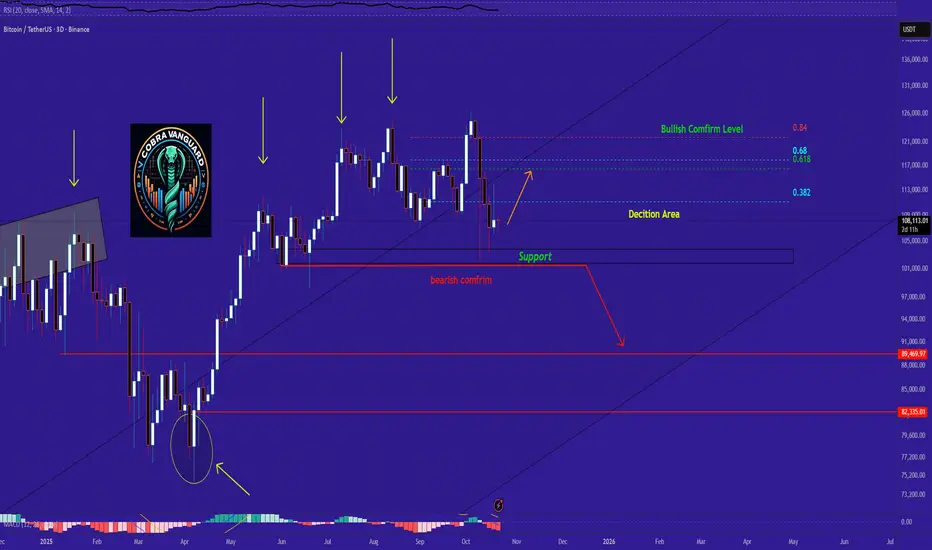
Bitcoin Technical Outlook (Based on Recent Observations)So far, Bitcoin has not yet completed the 3-day red candle close we've been watching. The key decision zones I previously marked—especially the 0.382 Fibonacci level at $112,890—remain unbroken. This level is critical for confirming bullish continuation.
For Bitcoin to maintain its upward momentum, we need a candle close above both the decision zone and the channel's midline, as illustrated by the orange arrow I previously shared.
In my view, if the $103K–$100K support zone breaks downward, we could shift into a bearish stance. This type of behavior from Bitcoin has been typical over the past 640 days.
BTC: Shows an obvious volatile trendToday, BTC’s situation is relatively complex, with intertwined bullish and bearish factors, showing a volatile trend.
Price Movement: There has been sharp volatility, with rapid rises and falls. From the hourly chart, the price surged to around 114,000 last night, followed by a significant pullback from the highs, retesting the key support level around 107,500.
Influencing Factors:
News: The Federal Reserve held a meeting with payment companies to facilitate better institutional access to the stablecoin sector. This news triggered a short-term surge in Bitcoin prices. However, subsequent remarks by Trump proposing a 155% tariff led to a price decline. The uncertainty in news has had a significant impact on the market.
Market Sentiment: The fear index stands at 25, indicating a tendency toward panic in market sentiment. Additionally, the large traders’ long-short ratio shows a slight dominance of bears at 52.34%, reflecting relatively stronger short-term bearish momentum in the market.
Capital Flow: U.S. Bitcoin ETFs have seen net inflows exceeding $3.6 billion this month, the highest since January. Institutions like BlackRock continue to increase their holdings, forming bottom buying support for prices. However, the total open interest across the network has reached $48 billion, highlighting high leverage risks. A sharp price fluctuation could trigger massive contract liquidations, exacerbating market volatility.
Technical Analysis: On the hourly timeframe, the MACD has re-formed a death cross pointing downward. Although the blue bars have shortened and started to turn red, indicating a partial shift in short-term momentum, bears still hold the overall advantage. The upper resistance level is around $111,000, and the lower support level is around $107,500. A break below this key support could lead to further downside.
Trading Strategy:
Focus on range-bound trading. Avoid taking positions at mid-range levels, exercise caution in chasing trends, and patiently wait for key levels to enter trades.
Buy 107,500 - 108,500
SL 106,500
TP 109,500 - 110,500 - 111,500
Sell 111,000 - 110,500
SL 112,000
TP 109,500 - 108,500 - 107,500
Daily-updated accurate signals are at your disposal. If you run into any problems while trading, these signals serve as a reliable reference—don’t hesitate to use them! I truly hope they bring you significant assistance
